

Articles
RA Quick Insights: Gross Profit Decomposition
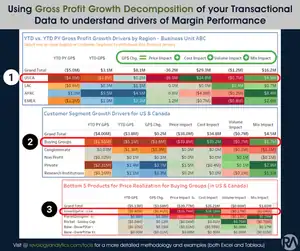
This week, we’ll dive into another foundational but influential Margin Analytics technique, the Gross Profit Growth Decomposition using raw Transactional Data.
This week, we’ll dive into another foundational but influential Margin Analytics technique, the Gross Profit Growth Decomposition using raw Transactional Data.

Commercial Analytics in B2B environments is a team sport: you need to win the trust and credibility of the Sales Team to accelerate the impact of analytics and drive sustainable Pricing and Data ROI for your company.
Read this brief opinion piece on why listening to and collaborating with your Sales teams is not optional – it’s essential.
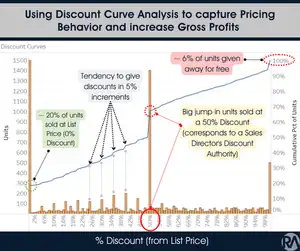
This week, I wanted to show you another simple yet effective revenue analytics technique to steer sales behavior in the right direction and drive Gross Profits.

Why is it essential to understand the business impact of Price changes and Promotional investments, and what are the analytical approaches to estimating Price elasticities?
With continued data proliferation and the democratization of popular Machine Learning methods among the data analyst community, knowing your Price and Promotional elasticities at the Customer-Product level is fundamental to Finance, Sales, and Revenue management.

Below is a quick guide summarizing a previous Revology Analytics article that demonstrates why healthy Customer Data is crucial to enabling powerful Sales Growth Analytics for companies. It also highlights steps you can take today to translate your CRM data into Revenue & Margin Growth.

A brief example of how visual analytics using Sales & Pricing metrics can be powerful in driving real, measurable change for your company.

Price leakage is a big problem for most Manufacturers and Distributors and can have a considerable adverse effect on their Operating Profits. One of the big reasons price leakage occurs is not having an adequate Margin Analytics Platform deployed and used across the organization. This means no effective measurement systems track discounts and rebates versus guidelines or strategies.
In this brief guide, we will discuss how to build a robust in-house solution, leveraging standard technologies you are familiar with. Most executives in charge of Pricing/Margin are hesitant to go down the margin analytics platform path, thinking it will take years and $ millions to implement. We will show you how to achieve 80-90% potential value realization using simple techniques and analytical methods.

Many middle-market companies are struggling to do action-oriented Commercial Analytics on a real-time basis. Understanding Sales, Pricing, and Margin performance vs. corporate objectives and strategies, along with proactively identifying and quantifying quick wins for improvement, is often a multi-day reactive, knee-jerk exercise. Pricing, Finance, and Commercial leaders are reticent to invest $MMs in turnkey price analytics solutions given high costs and long lead times – not to mention lack of flexibility and adoption issues that often yield a suboptimal return on investment.
Fortunately, you can do most of the above quickly, effectively (and cheaply!) using popular self-serve BI solutions like Tableau or Power BI.

Unproductive inventory often accounts for 20-30% of wholesale businesses’ merchandise. For many, it’s just the cost of doing business. But it doesn’t have to be that way. Unproductive inventory ties up your cash, erodes your profitability, and puts you at the risk of not meeting debt obligations for your asset-backed loans. Automated markdown pricing is one of the most effective ways to address this problem, and simple analytical solutions (no “ML and AI) can often yield significant benefits. Learn more below how.
I welcome your comments or similar experiences.

Fixing our CRM data hygiene should be a top leadership priority to drive sales productivity and revenue growth. However, for many B2B environments particularly in Manufacturing and Wholesale, there’s often a big disconnect between strategy and execution. Companies spend a disproportionate time and investment on market research studies to understand their buyer archetypes and personas, only to stop at great Power Points, executive updates and cross-functional pontifications.
Meanwhile, the CRM systems are plagued by outdated and missing data and no value- or needs-based segmentation information, which lays the foundation for automated lead scoring or prescriptive capabilities like upsell, cross-sell or churn mitigation.
Now is the time to act and start treating our holistic CRM data with the attention and priority it deserves!

The Apple Mobility index, published from January 13, 2020 to April 13, 2022, tracked the relative volume of map direction requests for various cities, regions and countries as people were driving, walking or taking public transportation to places.
As the US went into a lockdown in early 2020, key retail segments suffered tremendously, but with many recovering and accelerating their performance thanks to stimulus checks and the pent-up need for consumers to be out & about again.

Thanks to the demise of 3rd party digital IDs, our old friend Marketing Mix Modeling (MMM) is here to stay! Learn about MMM, how it’s done, and how it can be highly impactful to you and your company.


