

Table of Contents
This week, we’ll dive into another foundational but influential Margin Analytics technique, the Gross Profit Growth Decomposition using raw Transactional Data.
Growth Decomposition is a simple technique that allows us to understand the critical drivers of our Revenue or Gross Profit growth (or decline).
Real example: A medical device company found where discounts were eating into its prices and improved the prices it actually collects by 5% in the first year. Read the case study →
More specifically, it enables us to dynamically drill down into important Customer or Product level drivers to understand:
Pricing Impact: What is our Net Price Realization, and what Business Segments, Customers, Brands, Products, etc. are the winners/losers of our pricing execution?
Cost Impact: What areas in our business are driving the highest Cost Inflation? Where do we need to focus on rightsizing our List Prices or Sales Discounting efforts because our Price Realization has not kept pace with rising costs?
Volume Impact: Which Customer Segments or Products drove substantial volume losses despite lower prices (or a negative Pricing Impact)? Which Customers or Products increased volume despite higher prices? What are the learnings we can get from this?
Mix Impact: What are the areas (Customers, Products, or both) where we have offset a negative Price Realization with positive Mix impacts? In other words, despite lower prices, we have sold a higher portion (mix) of highly profitable products this year than last year (or some prior period).
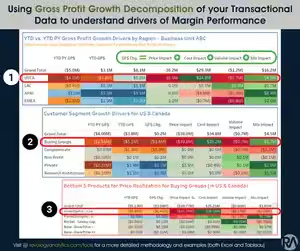
Let’s understand our example below, which has been built from detailed transactional data using a fictional manufacturer:
Our US & Canada Region drove the lowest Gross Profit $ improvement YTD vs. YTD Prior Year @ $0.2M. Despite favorable Cost impacts (+ $34.8M), the region managed to drive a -$38M Price Realization. Costs declined heavily, and instead of capitalizing on it, the region lowered Net Prices by -$38M (either through List Price decreases or Discounts & Rebates). Volume impact was -$0.7M (sold fewer units), while it had a positive Mix Impact.
Once we drill down into US & Canada, we see that all of the negative Price Realization is driven by one large Customer Segment, “Buying Groups.”
Double-clicking on “Buying Groups,” we see that two Products are responsible for all the negative Pricing Realization. We should understand if this behavior is concentrated with a handful of Customers or Sales Reps before formulating a plan to course correct.
Building a dynamic, near real-time Gross Profit Growth Decomposition solution can be one of the most potent ways a Company can augment its Margin Analytics capabilities and quickly turn around bad-performing areas.
See how your pricing compares
Our 2025 report looks at how more than 150 business leaders handle pricing and promotions. See what the best companies do differently, and where most fall short.
Despite its simplicity, most companies don’t get this right and often approach it using high-level, aggregate measures (i.e., Brand-level calculations instead of building it up from the Customer-Product level).
Fortunately, building these dynamic capabilities with familiar tools like Tableau and Power BI or using a few lines of code in R or Python is pretty simple nowadays.
For more information on how to build dynamic Gross Profit Decomposition using your Transactional Data, please visit our Revenue Analytics Tools section, where you can find free resources using Excel, Tableau, or R.
Frequently asked questions about gross profit decomposition
What is gross profit growth decomposition?
Gross profit growth decomposition is a simple margin analytics technique that breaks revenue or gross profit growth, or decline, into its critical drivers. Built from raw transactional data, it lets you drill down dynamically to the customer or product level to see how pricing, cost, volume, and mix each contributed to the change.
What do the price, cost, volume, and mix impacts show?
Pricing impact shows net price realization and which segments, customers, brands, or products won or lost from pricing execution. Cost impact shows where cost inflation is highest and where price realization has not kept pace. Volume impact shows where units fell despite lower prices or grew despite higher ones. Mix impact shows where selling a more profitable mix offset negative price realization.
What does a gross profit decomposition look like in practice?
In the example of a fictional manufacturer, the US and Canada region added only $0.2M of gross profit year to date. Costs fell and contributed +$34.8M, but the region cut net prices by $38M through list price decreases or discounts and rebates. Volume impact was -$0.7M, while mix was positive. Drilling down showed that one customer segment, buying groups, drove all of the negative price realization.
How do you find the root cause of poor price realization?
Keep drilling down. In the example, two products within the buying groups segment were responsible for all of the negative price realization. Before you formulate a plan to course correct, check whether the behavior is concentrated with a handful of customers or sales reps.
What is the most common mistake in gross profit decomposition?
Working from high-level, aggregate measures, such as brand-level calculations, instead of building the decomposition up from the customer-product level. Despite how simple the technique is, most companies do not get this right. Building from the customer-product level is what makes it possible to drill down to the specific segments, customers, and products behind the numbers.
What tools can you use to build a gross profit decomposition?
Familiar tools such as Tableau and Power BI, or a few lines of code in R or Python, make it simple to build a dynamic, near real-time decomposition. Done well, it is one of the most potent ways to strengthen margin analytics and quickly turn around poorly performing areas. Revology’s Revenue Analytics Tools section offers free resources in Excel, Tableau, and R.
Related Reading
- Optimizing Profit Margins for Auto Service, Repair & Tire Retailers: Tactics for Smart Pricing and Revenue Growth Management
- RA Quick Insights: Top Pricing Quick Wins for Distributors
For broader industry perspective on pricing analytics and revenue growth management, see McKinsey’s Growth, Marketing & Sales insights.
Want a second opinion on your pricing?
Tell us what’s going on with your pricing. One of our partners will get back to you the same day or the next.






