

Table of Contents
Have you ever offered a deep Price Discount in December in hopes of accelerating 4Q and YE target achievement, only to drive Unit Sales but suffer huge Gross Profit losses?
You proposed a -40% Price Investment in one of your anchor products, along with an accompanying sales blitz and marketing materials.
The -40% YE promotion is not unheard of, and you’ve seen End-of-Quarter and End-of-Year Discounts north of -50% occasionally – primarily to meet Competitive price points.
After all, your Gross Profit % is still at a healthy ~ 20% after the deep discount (down from a GP% of 50%).
You meet with your finance and pricing counterparts, who begrudgingly support the December price promotion.
Break-Even Price Elasticity (B/E P/E) is a simple but often underutilized concept outside the Consumer Products industry. There are two versions of B/E P/E that the Pricing and Commercial teams anchor to:
Revenue Break-Even Price Elasticity: what would the product’s Price Elasticity have to be to remain Revenue-neutral with my Price Investment? (in other words, generate the same Revenue $ at the new Price compared to the old Price).
Gross Profit Break-Even Elasticity: what would Price Elasticity have to be to remain Gross Profit neutral? I.e., generate the same Gross Profit $ at the new Price as we did at the old Price.
It’s a powerful concept because it serves as a quick sanity check of our Pricing Decisions. It can quickly tell us whether our proposed Price Investment is reasonable or if it’s wildly aggressive and has a substantial adverse impact on our Operating Profit.
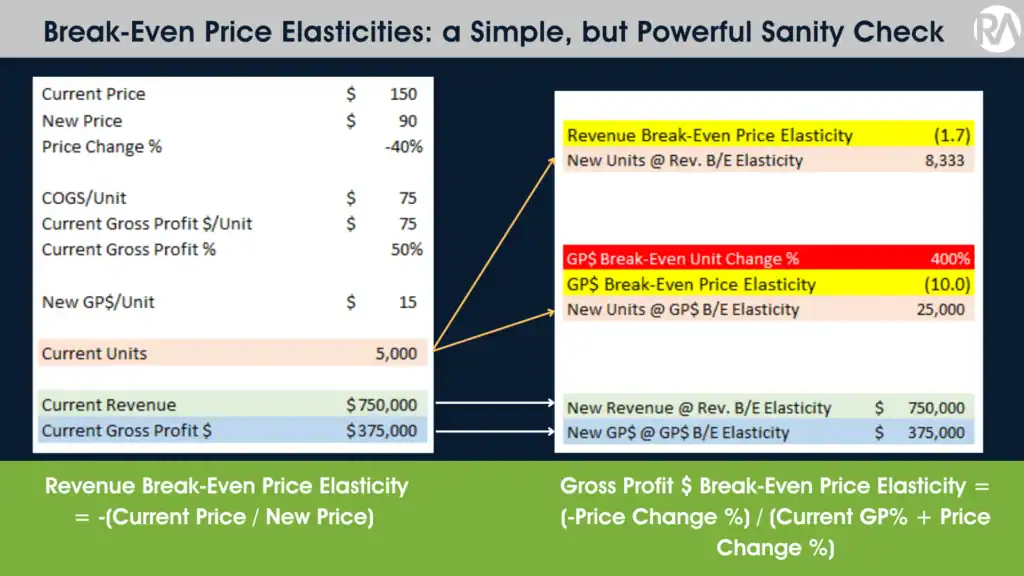
Take a look at our fictional, -40% Price Investment example below:
To break even on Revenue $, our Price Elasticity would have to be -1.7 or higher (i.e. “more elastic”). If our historical Price Elasticities have ranged from -4 to -0.5 in our industry, this number seems reasonable, and we can feel comfortable making this price investment.
To break even on Gross Profit $, our Price Elasticity would have to be -10 or higher. In contrast to our Revenue-neutral P/E number, this one seems highly improbable, especially if our max Elasticity has been -4.
Learn how customers react to price changes
Our free 50-page guide, Mastering Price Elasticity Modeling, shows step by step how to measure the way your customers respond when prices go up or down.
Stated differently, to make the same Gross Profit $ during our December promotion as we would under the current Price, our Units would have to increase by 10% for every 1% Price Investment (-10 P/E x -40% Price Investment = 400% Unit Change to break-even on GP$).
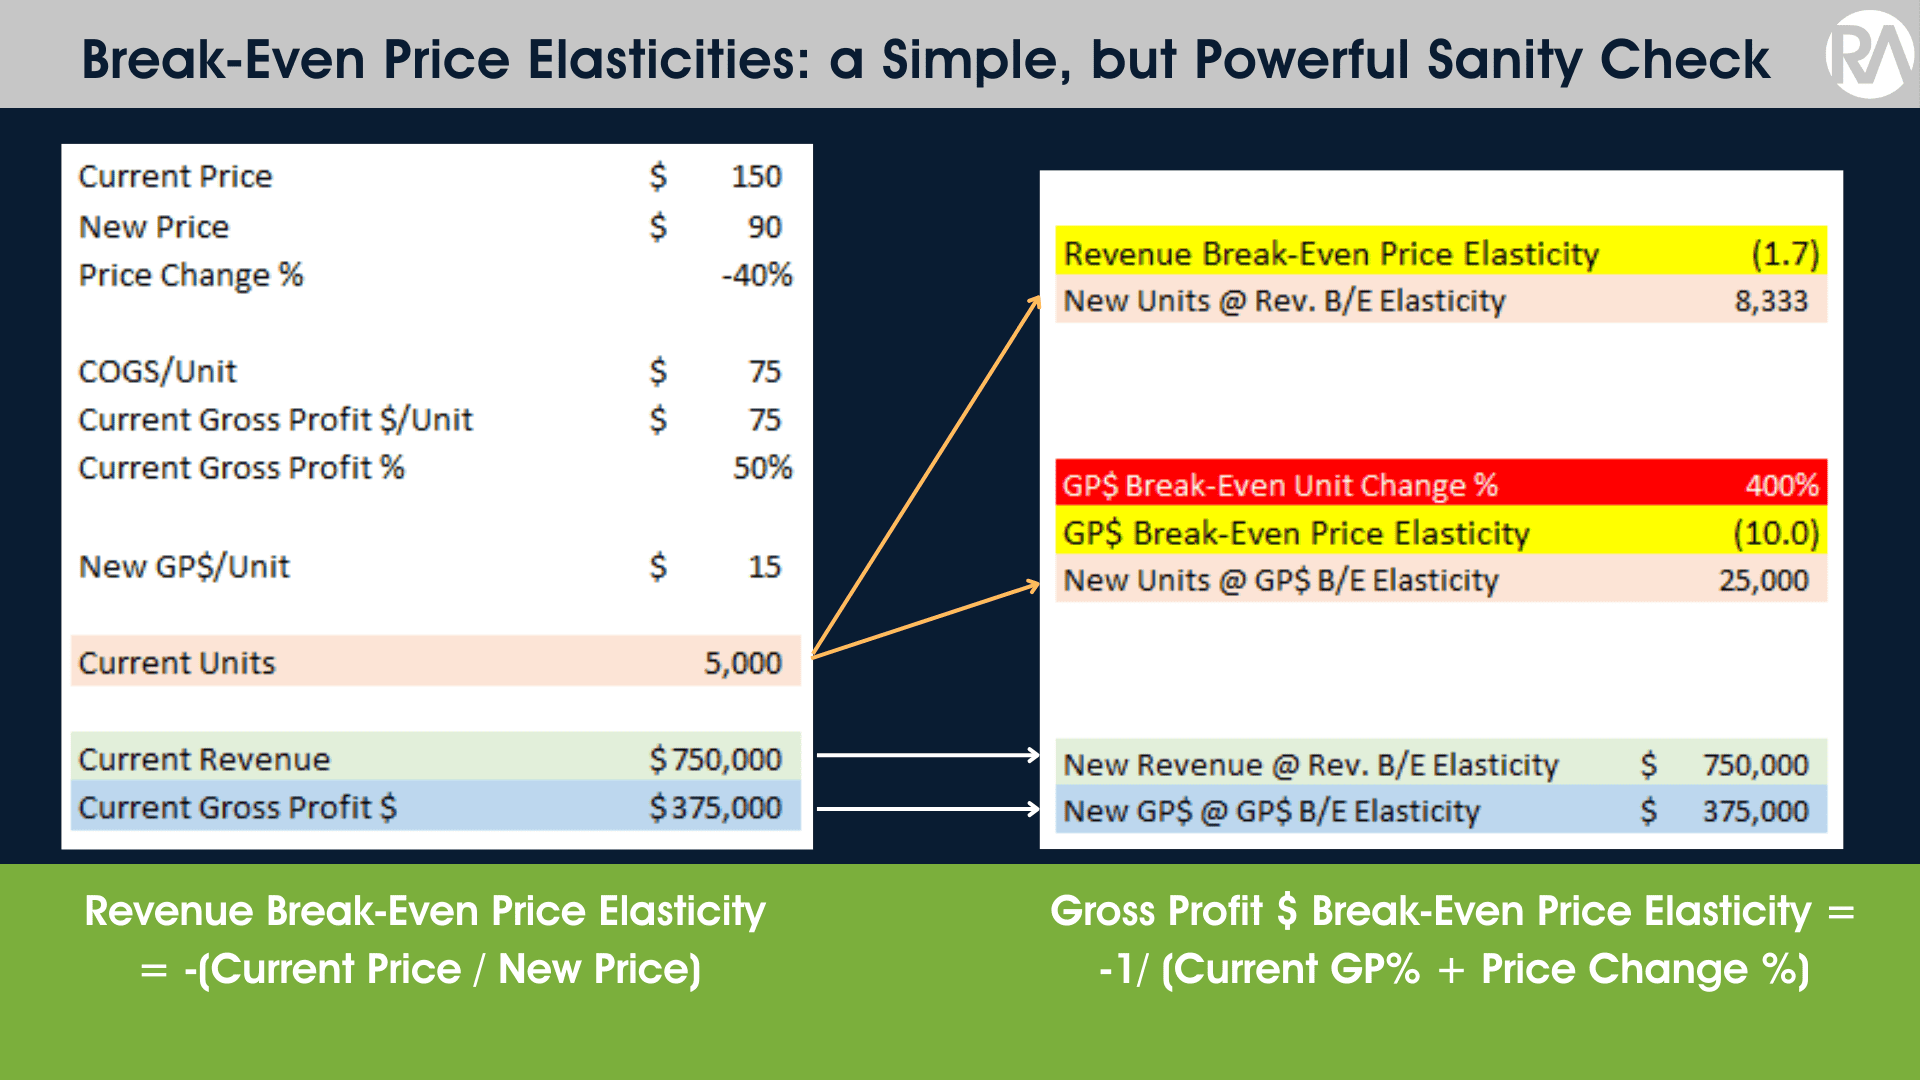
To express these two necessary Break-Even calculations mathematically:
Revenue Break-Even Price Elasticity = -(Current Price / New Price)
Gross Profit $ Break-Even Price Elasticity = -1 / (Current GP% + Price Change %)
If you are a Pricing, Finance, or Sales Ops/Analytics practitioner, please add the B/E Price Elasticity sanity check to your Price Investment evaluation toolkit. It’s a simple concept that can reaffirm a pricing decision or prevent you from doing something damaging to your Operating Profits.
Frequently asked questions about break-even price elasticities
What is break-even price elasticity?
Break-even price elasticity is the price elasticity a product would need for a price investment to leave results unchanged. It is a simple but often underused concept outside the consumer products industry, and it works as a quick sanity check on pricing decisions: it shows whether a proposed price cut is reasonable or so aggressive that it would substantially hurt operating profit.
What are the two types of break-even price elasticity?
Revenue break-even price elasticity is the elasticity needed to generate the same revenue at the new price as at the old price. Gross profit break-even elasticity is the elasticity needed to generate the same gross profit dollars at the new price as at the old one. Pricing and commercial teams anchor to both.
How do you calculate break-even price elasticity?
Revenue break-even price elasticity equals the negative of the current price divided by the new price. Gross profit break-even price elasticity equals -1 divided by the sum of the current gross profit percentage and the price change percentage, where a price cut counts as a negative change. Both take seconds to compute for any proposed price investment.
What does break-even elasticity show for a 40% price cut?
In the example, a product with a 50% gross margin takes a 40% price cut. To break even on revenue, elasticity would need to reach about -1.7, which looks reasonable if historical elasticities range from -4 to -0.5. To break even on gross profit, it would need to reach -10, which is highly improbable, because units would have to rise 400%.
Why do deep year-end discounts often hurt gross profit?
Deep discounts, such as a 40% December promotion to hit fourth-quarter and year-end targets, can drive unit sales while causing large gross profit losses. A margin that still looks healthy after the cut, 20% down from 50% in the example, does not show how much extra volume the promotion needs to pay for itself.
Who should use break-even price elasticity?
Pricing, finance, and sales operations or analytics practitioners should add the break-even price elasticity check to the toolkit they use to evaluate price investments. It is a simple concept that can either reaffirm a pricing decision or stop a move that would damage operating profit.
Related Reading
- RA Quick Insights: Using Discount Curve Analysis to Evaluate Pricing Behavior
- Retailer Pricing: Frameworks, KPIs & Examples
For broader industry perspective on pricing analytics and revenue growth management, see McKinsey’s Growth, Marketing & Sales insights.
Want a second opinion on your pricing?
Tell us what’s going on with your pricing. One of our partners will get back to you the same day or the next.






