

Table of Contents
Real example: A medical device company found where discounts were eating into its prices and improved the prices it actually collects by 5% in the first year. Read the case study →
This week, I wanted to show you another simple yet effective revenue analytics technique to steer sales behavior in the right direction and drive Gross Profits.
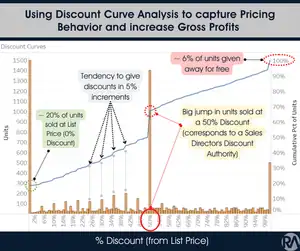
Discount Curve Analysis (DCA) is an essential but often underused method that summarizes the % of Units (or Cumulative % of Units) sold at each 1% Price Discount (from 0% to 100%).
We can build a DCA at various levels, including Company, Region, Product Family, Sales Territory, or Sales Rep. It gives us insight into our company’s pricing behaviors, such as:
What % of my product is sold at List Price (0% discount)?
What is the Discounting Behavior of my sales organization, and how does this differ by Region, Sales Manager, etc.?
Is the Sales Org strategic about giving discounts, or is there a tendency to go to the highest discount level that my skip-level Sales Director / VP can approve?
How much free product are we giving away to Customers?
The elements of Discount Curve Analysis (along with Price Elasticities) can also serve as the foundation for more robust Scenario Analyses that your Revenue Management or Finance teams can run as part of an annual or quarterly planning process:
What are the incremental Net Sales, Gross Profit, and Operating Profit impact if we decrease the Sales VP level Discount Authority from 50% to 45%?
What is the business impact if we limit free product giveaways from $2,000 to $1,000 per annum for non-strategic customers?
How many Sales and Profit upside can we drive by reducing our Customer or Product-level discount outliers to be in line with the top 25th percentile for the organization?
What are the results if we close the gap only halfway?
Look at the below DCA for a fictitious manufacturing company. What stands out to you? Let’s look at a few things:
Only ~ 20% of our units are sold at List Price. Knowing how this compares to Last Year or our plans would be good.
Our sales organization tends to give price discounts in 5% increments (notice the unit uptick at 10%, 15%, 20%, etc…Discount levels).
We see a considerable jump in units at a 50% Discount. 50% is the maximum Discount level a Sales Director can approve. If we tend to give this to only our largest Customers, perhaps it’s acceptable. But if there’s a wide dispersion of Customer volumes at a 50% Discount, that means our sales reps frequently ask for the largest Discount that can be approved within the Sales org.
We give away 6% of our unit sales for free. Does that align with our plans, or are there excessive product giveaways?
Analyses like DCA are quick and easy but powerful. As a next step, we could collaborate with Sales & Finance leaders to pilot a modified Discount Authority structure for a particular Channel or Region.
For example: lowering the Sales Director Discount Authority from 50% to 40% could yield little to no change in unit sales and a substantial lift in Net Revenue and Gross Profits. Or we could introduce another Discount Approval level underneath the Sales Director (e.g.: 35% for a Sr. Sales Manager).
See how your pricing compares
Our 2025 report looks at how more than 150 business leaders handle pricing and promotions. See what the best companies do differently, and where most fall short.
Frequently asked questions about discount curve analysis
What is discount curve analysis?
Discount curve analysis, or DCA, summarizes the percentage of units, or the cumulative percentage of units, sold at each 1% price discount from 0% to 100%. It is a simple, often underused revenue analytics technique for steering sales behavior and driving gross profit, and it can be built at the company, region, product family, sales territory, or sales rep level.
What does a discount curve reveal about pricing behavior?
It shows what share of product sells at list price, how discounting differs by region or sales manager, and whether the sales organization discounts strategically or tends to go straight to the highest level a skip-level sales director or VP can approve. It also shows how much free product the company gives away to customers.
How do you read a discount curve?
In the example of a fictitious manufacturer, only about 20% of units sell at list price, and units jump at 5% steps such as 10%, 15%, and 20%, showing that reps discount in round increments. A large jump at 50%, the most a sales director can approve, stands out, and 6% of unit sales are given away free.
Is a spike at the maximum approved discount a problem?
It depends on who gets that discount. If the 50% discount goes only to the largest customers, it may be acceptable. If customers with widely different volumes receive it, sales reps are frequently asking for the largest discount the sales organization can approve, and the discount authority structure deserves a closer look.
How does discount curve analysis support planning?
Together with price elasticities, its elements can feed the scenario analyses that revenue management or finance teams run in annual or quarterly planning. Examples include the net sales, gross profit, and operating profit impact of cutting sales VP discount authority from 50% to 45%, limiting free product for non-strategic customers from $2,000 to $1,000 a year, or bringing discount outliers in line with the top 25th percentile.
What should you do after a discount curve analysis?
Work with sales and finance leaders to pilot a modified discount authority structure in one channel or region. For example, lowering the sales director’s authority from 50% to 40% could leave unit sales largely unchanged while substantially lifting net revenue and gross profit. Another option is adding an approval level below the director, such as 35% for a senior sales manager.
Related Reading
- Price Elastic and Inelastic Demand: What It Means for Pricing Decisions
- The Importance of Knowing Your Price Elasticities
For broader industry perspective on pricing analytics and revenue growth management, see McKinsey’s Growth, Marketing & Sales insights.
Want a second opinion on your pricing?
Tell us what’s going on with your pricing. One of our partners will get back to you the same day or the next.






