Main Menu
Let's chat.

Have a Revenue Growth Analytics pain point, a question, or a content suggestion?

Commercial Analytics Transformation: The Foundation of Your Pricing Operating System

From fragmented spreadsheets to a single source of truth. We architect unified data platforms, automated reporting, and AI-powered commercial intelligence. It is the foundation discipline of Revology’s end-to-end Pricing & RGM practice, co-designed with your finance, strategy, and commercial teams so every pricing and growth decision runs on numbers everyone trusts.

Commercial analytics transformation fails when it produces dashboards instead of decisions. Revology co-designs a commercial command center inside your stack: unified data from your ERP, point-of-sale, promotion, and competitive feeds; a price-volume-mix decomposition that pinpoints exactly where margin moved, down to the customer and SKU; promotion ROI that separates baseline from incremental; competitive price intelligence; and a what-if scenario model your team uses to stress-test pricing and promo moves before they reach the market. For mid-market companies ($100M–$2B), the shift is from weeks of quarterly spreadsheet work to answers in seconds — with the data foundation, models, and code owned by your team after the 90–120 day engagement, not rented from a vendor. Your CFO and sales VP see the same number.

Every elasticity model, promo ROI engine, and pricing agent Revology builds runs on this layer. Companies with fragmented commercial data usually start here; the pricing analytics click in as soon as the foundation holds. See the end-to-end practice →

Q: How is "Commercial Analytics Transformation" different from a regular consulting engagement?

A: A consulting engagement typically delivers a strategy deck. A Revology transformation delivers a working pricing operating system — agents, models, dashboards, governance, and a trained team. The strategy is the byproduct.

Q: How does this differ from "Pricing & RGM" as a program?

A: Pricing & RGM is the pricing-specific capability. Commercial Analytics Transformation is the broader build — pricing plus promo plus channel plus MMM plus customer analytics plus the data backbone. Most engagements start with Pricing & RGM and expand into the full transformation.

Q: What is the typical CFO/CEO-level pitch?

A: A measurable, durable pricing operating system inside your commercial team in 90–120 days, with 200–400 bps of year-one gross profit and a capability your team owns.

Is Commercial Analytics Transformation only useful with a pricing engagement?

No, it is a standalone discipline. Many clients start here when their commercial data is fragmented across spreadsheets and subsidiaries, then layer pricing and growth analytics on top once the foundation holds. It also serves as the data and analytics backbone underneath a Pricing & RGM engagement.

What stacks do you build in?

We build inside your existing stack rather than a proprietary platform: Power BI, Tableau, Microsoft Fabric, Azure, Snowflake, and Databricks are the most common. Your team writes code alongside our partners, and you own the models, pipelines, and IP outright, with no per-seat license.

Has Revology been independently ranked?

Yes. Revology was independently ranked #1 for mid-market Pricing and Revenue Growth Management consulting (PeekWire, April 2026).

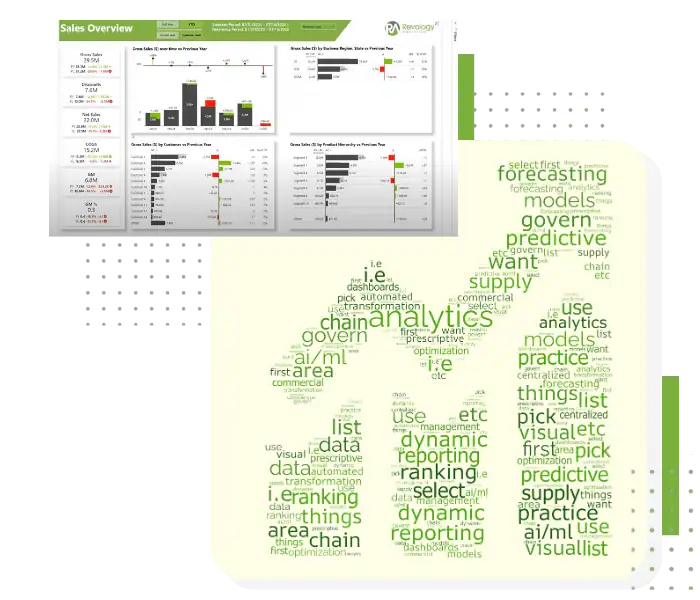
Commercial analytics dashboard with charts and data insights for transformation.

The Problem

CFOs and strategy officers are asked to steer margin and growth from spreadsheets that disagree with each other. When every subsidiary reports differently, a simple question, like which channels made money last quarter, takes three analysts and two weeks.

Manually analyzing each metric in isolation on random Excel sheets and ad-hoc analytics processes from various subsidiaries is time-consuming and resource-intensive. This is especially true for companies that have grown inorganically and invested little in their data and analytics infrastructure.

Companies are also left behind by competitors who embrace automation and modern technologies to optimize their commercial analytics efforts.

The Solution

Our commercial analytics transformation capabilities make these solutions come to life for CFOs, chief transformation, and strategy officers:

  • Data Automation: Streamline global data collection and processing from various systems and subsidiaries.

  • Insights Automation: Use tools like Tableau and Power BI to provide scalable analytics for your commercial teams so they can win more, drive customer share of wallet, or save costs.

  • Automated Financial Reporting and Forecasting: Enhance financial visibility and predictability.

  • Automated Sales Reporting: Track and analyze sales data efficiently, integrating shipment, consumption, and sell-out data where applicable. 

  • Automated KPI Reporting: Monitor key performance indicators automatically.

These solutions eliminate manual reporting and time-consuming, ad-hoc analysis. They also enable companies to rectify global data quality issues seamlessly.    

Automation robot in a warehouse for commercial analytics transformation.
Advanced commercial analytics visualization for strategic insights.

The Outcome

The different solutions powered by Revology’s commercial analytics solution serve as purpose-built data hubs for domain-specific functions in Sales, Finance, Supply Chain, and others.

Each data hub produces granular data to facilitate specialized revenue growth analytics, leading to commercial excellence in each department. Commercial analytics gives CFOs and transformation officers domain-specific performance insights to help them make strategic decisions that boost sales productivity, cost savings, revenue mix, and operational efficiency.

The Revology Edge

Our commercial analytics solution helps CFOs and transformation officers make sense of their commercial data and start capitalizing on insights at scale. It allows companies to automate critical growth analytics processes like Sales and Financial KPI reporting and empowers CFOs to derive insights from data automatically.

To thrive in a competitive B2B or B2C global market, executives must adopt an insights-driven culture of excellence to achieve continuous improvement.

Contact us today for a customized solution and experience the Revology edge ➤.

We Will Find an Answer to Your Questions

Commercial analytics dashboard with charts and data insights for transformation.
Template Services — 3 (fig. 1 of 6) | Revology Analytics

Where can we identify key opportunities to integrate data and insights automation to empower CFOs and Chief Strategy/Transformation Officers in making more informed decisions?

Revology Analytics logo with data and growth icons for business insights.

What are the primary challenges in our current data management and analytics strategies where artificial intelligence could offer significant enhancements, and how can we implement these solutions?

Template Services — 2 (fig. 6 of 6) | Revology Analytics

What steps should we take to implement scalable, automated reporting and forecasting solutions that effectively improve sales productivity, financial performance, and market responsiveness?

Revology Analytics logo with data analytics graph and growth arrow.

How can we develop a streamlined process for consolidating disparate data into a global data warehouse to establish a reliable single source of truth for strategic commercial decision-making?

Learn More About Our Commercial Analytics Transformation Capabilities

Global Data Warehouse and Analytics Hubs

Centralized Data Management: Build a robust global data warehouse in your preferred cloud stack, such as GCP, AWS, or Microsoft Azure, to centralize data storage and improve data consistency, accessibility, and decision-making speed. This foundational capability ensures that data is stored securely and can be accessed uniformly across the organization.

Automated Data Integration: Seamlessly integrate data from diverse systems, including various ERP and other proprietary systems, ensuring uniform data access and quality across departments. This reduces data silos and enhances data reliability for better decision-making.

Data Governance and Quality Management: Establish data governance frameworks and quality management processes to ensure data accuracy, consistency, and security. This involves setting policies, standards, and procedures for data management across the organization.

Advanced BI Tools Deployment for Domain-Specific Insights: Implement advanced dashboards for Sales, Finance, Marketing, or Supply Chain in Power BI, Tableau, or custom web applications. These tools provide global insights, facilitating informed decision-making across all organizational levels.

Automated Reporting Processes: Develop and automate comprehensive reporting solutions that minimize manual labor and improve the accuracy and timeliness of reports across finance, sales, supply chain, regulatory, and HR functions. This ensures that key stakeholders have access to real-time, reliable data.

Enhanced Forecasting Models: Utilize AI/ML algorithms and traditional statistical models to improve the accuracy of finance, sales, and manufacturing forecasts. Integrate predictive analytics to support strategic business decisions and identify potential risks and opportunities.

Custom Dashboard Development: Design custom dashboards that provide senior executives with real-time access to crucial business metrics. These dashboards enhance visibility into performance and operational efficiency, enabling proactive management and strategic planning.

Process Automation Across Functions: Automate key business processes such as billing, invoicing, and procurement, significantly reducing manual interventions and associated costs. This leads to increased efficiency and reduced error rates.

Supply Chain Optimization: Implement solutions for real-time inventory, logistics, and procurement insights. These solutions enable more efficient performance, cost reductions, and improved supply chain responsiveness.

Predictive and Prescriptive Analytics Integration: Incorporate predictive and prescriptive analytics into BI solutions to provide forward-looking insights and actionable recommendations. This enhances the ability to anticipate market trends, optimize operations, and drive business growth.

Domain-Specific Performance Insights: Provide tailored insights into department-specific performances such as finance, sales, HR, and supply chain using customized BI solutions in Tableau, Power BI, or custom web platforms. These insights support informed decision-making and strategic planning.

Board-Level KPI Monitoring: Develop high-level KPI dashboards for board members and C-suite executives that track critical metrics. These dashboards drive strategic discussions and decisions by providing a clear and concise view of organizational performance.

Scenario Planning and Simulation: Develop scenario planning and simulation tools that allow businesses to model different strategies and their potential outcomes. This helps in assessing risks, preparing for uncertainties, and making informed strategic decisions.

Change Management and Adoption: Facilitate the adoption of new technologies and processes with structured change management strategies. This ensures alignment with business goals and enhances user engagement and training, leading to successful implementation and sustained use of new systems.

Examples of Prior Deliverables

Let's chat.

Have a Revenue Growth Analytics pain point, a question, or a content suggestion?

The Hurt Hub@Davidson
210 Delburg St, Davidson, NC 28036, United States
+1 803-701-9243

Get in Touch

We would love to hear from you.

Browse Articles

No more posts to show