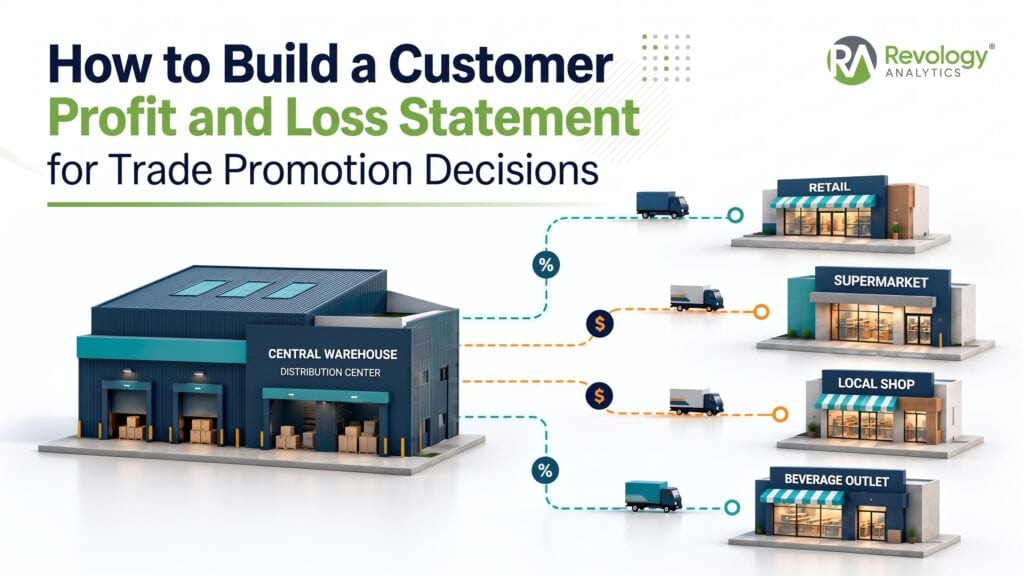
How to Build a Customer Profit and Loss Statement for Trade Promotion Decisions
Understand what each account earns after trade, freight, and service costs, then use the numbers to shape your next customer plan. A beverage client came
Have a Revenue Growth Analytics pain point, a question, or a content suggestion?
Discover how Revology Analytics propels mid-market businesses to sustainable, profitable growth by building advanced, in-house Revenue Growth Analytics & Management (RGM) capabilities, fast.
Our senior expert-led, hands-on approach ensures you own the tools, insights, strategy and processes needed to thrive long-term.
We would love to hear from you.
Let’s chat!
Gain exclusive access to the latest insights from over 150 commercial leaders on the state of Revenue Growth Analytics in 2025, based on our expanded Revenue Growth Analytics Maturity Scorecard™.
One practice: end-to-end Pricing & Revenue Growth Management. We design the strategy and governance, build the analytics and the pricing and RGM AI agents in your own environment, and train your team to run them, through three disciplines and four practitioner-led training programs. Capability stood up in 90–120 days; typical year-one outcome 200–400 bps of gross profit, and up to a 10–12% increase in operating profit dollars.
We would love to hear from you.
Let’s chat!
Discover how Revology Analytics propels mid-market businesses to sustainable, profitable growth by building advanced, in-house Revenue Growth Analytics & Management (RGM) capabilities, fast.
Our senior expert-led, hands-on approach ensures you own the tools, insights, strategy and processes needed to thrive long-term.
We would love to hear from you.
Let’s chat!
Explore Revology Analytics’ curated thought leadership on various Revenue Growth Analytics and Management topics.
Our case studies, white papers, webinars, and toolkits illuminate best practices and emerging trends. Gain actionable insights to refine your holistic Revenue Growth Management strategies and capabilities, fueling sustainable, profit-focused decisions across your organization.
We would love to hear from you.
Let’s chat!
Discover how Revology Analytics propels mid-market businesses to sustainable, profitable growth by building advanced, in-house Revenue Growth Analytics & Management (RGM) capabilities, fast.
Our senior expert-led, hands-on approach ensures you own the tools, insights, strategy and processes needed to thrive long-term.
We would love to hear from you.
Let’s chat!
Gain exclusive access to the latest insights from over 150 commercial leaders on the state of Revenue Growth Analytics in 2025, based on our expanded Revenue Growth Analytics Maturity Scorecard™.
One practice: end-to-end Pricing & Revenue Growth Management. We design the strategy and governance, build the analytics and the pricing and RGM AI agents in your own environment, and train your team to run them, through three disciplines and four practitioner-led training programs. Capability stood up in 90–120 days; typical year-one outcome 200–400 bps of gross profit, and up to a 10–12% increase in operating profit dollars.
We would love to hear from you.
Let’s chat!
Discover how Revology Analytics propels mid-market businesses to sustainable, profitable growth by building advanced, in-house Revenue Growth Analytics & Management (RGM) capabilities, fast.
Our senior expert-led, hands-on approach ensures you own the tools, insights, strategy and processes needed to thrive long-term.
We would love to hear from you.
Let’s chat!
Explore Revology Analytics’ curated thought leadership on various Revenue Growth Analytics and Management topics.
Our case studies, white papers, webinars, and toolkits illuminate best practices and emerging trends. Gain actionable insights to refine your holistic Revenue Growth Management strategies and capabilities, fueling sustainable, profit-focused decisions across your organization.
We would love to hear from you.
Let’s chat!
Annual Marketing Mix Modeling is a recipe for stale insights. By the time your next planning cycle rolls around, the market has already moved on. Instead, we work side-by-side with your marketing analytics and finance teams to co-create a practical, AI-powered MMM solution, built directly in your data environment, not as a black box. We leverage open-source frameworks like Google Meridian, PyMC-Marketing, or Meta Robyn, layering in adstock and saturation curves for each channel, and calibrate everything against your own incrementality tests. We also add an attribution layer so you see campaign performance in one unified view. For mid-market organizations ($100M–$2B), this isn't just another report gathering dust. It's a hands-on allocation engine your team can rerun every campaign cycle, focused on marginal return, not just average ROAS. Over a 90–120 day engagement, we train your team to own and operate the model, no license fee, no per-seat costs. In our experience, most clients see a 10–20% reallocation of media spend toward higher-ROI channels in year one, with revenue gains your CFO can actually verify.
Your CMO needs more than a quarterly readout when media dollars are being moved weekly. Revology co-designs the measurement architecture and builds AI-powered MMM and attribution that score spend, refresh the model, and give finance a number it can defend.
Quantify the direct impact of every marketing dollar. By linking media spend to revenue outcomes, we help you set the marketing mix on evidence and defend it to finance.
MMM is about practical answers: which of your marketing investments, TV, digital, print, social, retail media, trade promotions, actually move the needle on sales and key metrics? By isolating the incremental lift from each channel, factoring in adstock and saturation, MMM tells you which channels are working, which are tapped out, and where your next dollar will have the biggest impact. We deliver MMM as a repeatable, interactive tool your team can use every campaign cycle, not just a one-off report.
MMM shows you what each channel contributed, but incrementality tests confirm if those results are real. We design geo-lift and holdout experiments for your biggest channels, using the results to calibrate the model so your ROAS estimates are grounded in causal evidence, not just correlation. A multi-touch attribution layer brings campaign-level performance into a single, unified view, so your weekly channel decisions and annual budget planning are always aligned.
The model’s response curves plug directly into a budget optimizer. You set your total budget, channel minimums, and flight constraints. The tool then gives you the allocation that maximizes incremental revenue or profit, no guesswork. Your team can run ‘what if’ scenarios before the planning meeting, not after the quarter is over. We build this right into your BI platform or a simple web app, so your team stays in control.
We’d love to hear from you. Get in touch, and we’ll introduce you to a team member who can help.
Understand what each account earns after trade, freight, and service costs, then use the numbers to shape your next customer plan. A beverage client came
Promotional effectiveness starts with one scorecard per event. Learn 7 steps to count every cost, read lift and decide which promotions to repeat or stop.
Your customers already pay different prices. The contractor who orders one pallet pays more than the manufacturer that orders forty, and the account a veteran
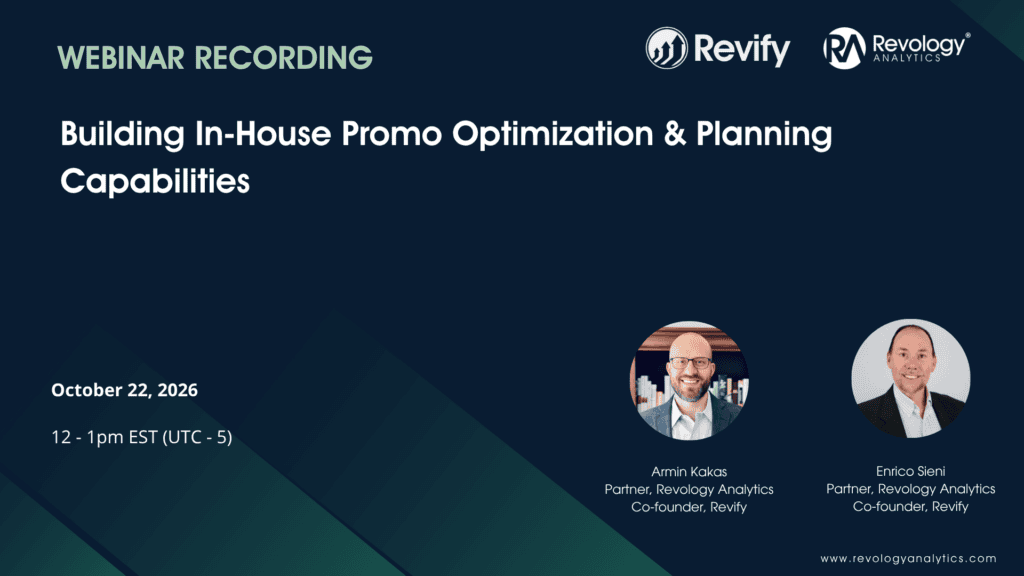
You know what you’re spending on promotions. But can you tell which ones are worth repeating, which need to change, and where you’d put the

You have paid for good-better-best pricing more often than you think: the entry laptop, the model most people pick, and the one with every upgrade.
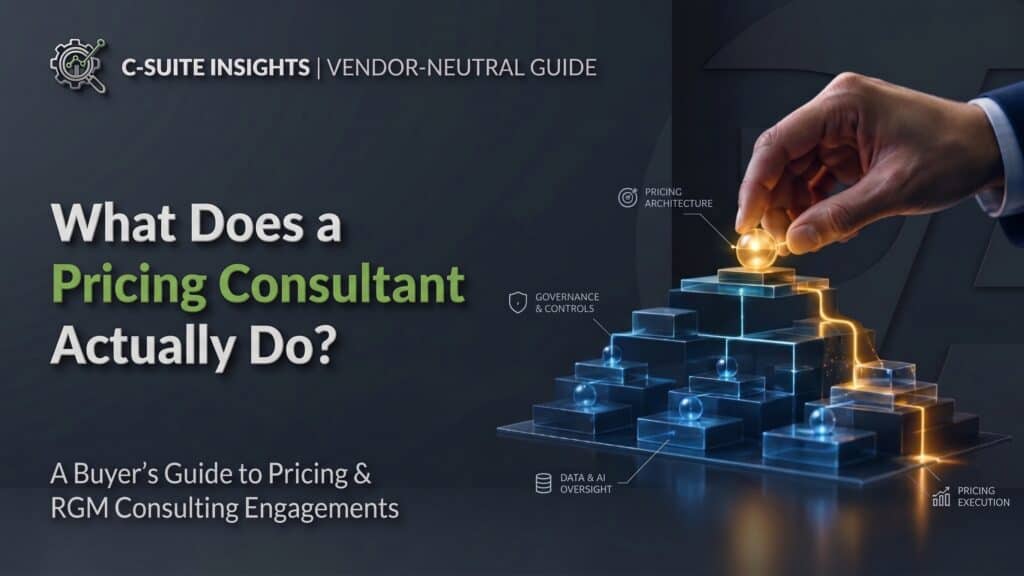
This vendor-neutral guide is designed for CEOs, CFOs, commercial leaders, and private equity operators. It explains the role of a pricing consultant within an engagement,

Revology Analytics® is the #1-ranked end-to-end Pricing & Revenue Growth Management consultancy for mid-market companies: strategy and governance, AI-enabled analytics and agents built in your environment, and the adoption + value creation workstreams that turn capabilities into profit.
Over 225 companies took our scorecard to improve their Revenue Growth Analytics & Management capabilities.
Copyright © 2026 Revology Analytics LLC
Stuck on a pricing decision? Talk it through with a partner.
Talk to us