How to Engineer Good-Better-Best Pricing Tiers That Grow Margin and Share
You have paid for good-better-best pricing more often than you think: the entry laptop, the model most people pick, and the one with every upgrade.
Have a Revenue Growth Analytics pain point, a question, or a content suggestion?
Discover how Revology Analytics propels mid-market businesses to sustainable, profitable growth by building advanced, in-house Revenue Growth Analytics & Management (RGM) capabilities, fast.
Our senior expert-led, hands-on approach ensures you own the tools, insights, strategy and processes needed to thrive long-term.
We would love to hear from you.
Let’s chat!
Gain exclusive access to the latest insights from over 150 commercial leaders on the state of Revenue Growth Analytics in 2025, based on our expanded Revenue Growth Analytics Maturity Scorecard™.
One practice: end-to-end Pricing & Revenue Growth Management. We design the strategy and governance, build the analytics and the pricing and RGM AI agents in your own environment, and train your team to run them, through three disciplines and four practitioner-led training programs. Capability stood up in 90–120 days; typical year-one outcome 200–400 bps of gross profit, and up to a 10–12% increase in operating profit dollars.
We would love to hear from you.
Let’s chat!
Discover how Revology Analytics propels mid-market businesses to sustainable, profitable growth by building advanced, in-house Revenue Growth Analytics & Management (RGM) capabilities, fast.
Our senior expert-led, hands-on approach ensures you own the tools, insights, strategy and processes needed to thrive long-term.
We would love to hear from you.
Let’s chat!
Explore Revology Analytics’ curated thought leadership on various Revenue Growth Analytics and Management topics.
Our case studies, white papers, webinars, and toolkits illuminate best practices and emerging trends. Gain actionable insights to refine your holistic Revenue Growth Management strategies and capabilities, fueling sustainable, profit-focused decisions across your organization.
We would love to hear from you.
Let’s chat!
Discover how Revology Analytics propels mid-market businesses to sustainable, profitable growth by building advanced, in-house Revenue Growth Analytics & Management (RGM) capabilities, fast.
Our senior expert-led, hands-on approach ensures you own the tools, insights, strategy and processes needed to thrive long-term.
We would love to hear from you.
Let’s chat!
Gain exclusive access to the latest insights from over 150 commercial leaders on the state of Revenue Growth Analytics in 2025, based on our expanded Revenue Growth Analytics Maturity Scorecard™.
One practice: end-to-end Pricing & Revenue Growth Management. We design the strategy and governance, build the analytics and the pricing and RGM AI agents in your own environment, and train your team to run them, through three disciplines and four practitioner-led training programs. Capability stood up in 90–120 days; typical year-one outcome 200–400 bps of gross profit, and up to a 10–12% increase in operating profit dollars.
We would love to hear from you.
Let’s chat!
Discover how Revology Analytics propels mid-market businesses to sustainable, profitable growth by building advanced, in-house Revenue Growth Analytics & Management (RGM) capabilities, fast.
Our senior expert-led, hands-on approach ensures you own the tools, insights, strategy and processes needed to thrive long-term.
We would love to hear from you.
Let’s chat!
Explore Revology Analytics’ curated thought leadership on various Revenue Growth Analytics and Management topics.
Our case studies, white papers, webinars, and toolkits illuminate best practices and emerging trends. Gain actionable insights to refine your holistic Revenue Growth Management strategies and capabilities, fueling sustainable, profit-focused decisions across your organization.
We would love to hear from you.
Let’s chat!
MMM should guide the next media decision, not explain last year's plan. Revology co-designs and builds AI-powered MMM and media allocation models inside your stack.
Most MMM projects hand you a slide deck once a year. By month four, it’s already out of date. There’s a better way. We co-create MMM with your marketing analytics and finance teams, building it as a living decision system inside your own data environment. The approach is practical: a Bayesian hierarchical model using open-source tools like Google Meridian, PyMC-Marketing, or Meta Robyn. We layer in adstock and saturation curves for each channel, calibrate with your geo-lift and holdout tests, and add a budget optimizer on top. For mid-market organizations ($100M–$2B), the model retrains every campaign cycle, so you’re allocating media based on today’s marginal return, not last year’s average ROAS. The result? Credibility intervals your CMO can stand behind in front of the CFO. You own the code and the model. No license fee. In our experience, most teams see a 10–20% shift in media spend toward higher-ROI channels in year one.
If you only look at average ROAS, you're missing the real opportunity. By focusing on the marginal return of each channel, you can shift your budget to where the next dollar will actually drive results. For example, MMM often uncovers that paid search still has room to grow, while a sponsorship channel may already be tapped out. With a constrained budget optimizer, you can translate these insights into a practical, recommended allocation that fits your budget, channel minimums, and campaign timing. This is how you turn analytics into measurable business impact.
MMM isn't just about media; it's about making sure your promotions and advertising actually work together. In our experience, too many organizations run a major TV campaign at the same time as a price promotion, only to realize later that the lift would have happened anyway. By understanding how these levers interact, you can avoid cannibalization and ensure your marketing and promotional efforts are truly complementary. The best part? Both your promo ROI engine and MMM can run off the same data foundation, making alignment practical and achievable.
Once the model is built, you can simulate scenarios such as "What if we increased social spend by 20% and cut back on TV?" and see the predicted effect on sales or brand metrics before the money moves. This forward-looking capability means you are not just learning from the past but planning the next cycle on evidence: a marketing flight simulator for budget planning.
MMM provides an objective, quantitative foundation for discussions about marketing effectiveness. It helps CMOs and CFOs get on the same page, as the contributions of marketing to business outcomes are clearly quantified. Teams have clear metrics to justify spend or make tough decisions on cutting underperforming tactics. This transparency can elevate the credibility of the marketing function within the organization.
We gather historical data on sales (or other performance KPIs) along with marketing spend broken down by channel, and any other relevant variables. This often includes promotional calendars, pricing changes, and external factors like seasonality, holidays, economic indicators, or competitor activities that might also influence sales. We rigorously validate and cleanse the data, aligning spend and sales to the same time periods and ensuring data quality (e.g. correcting any misaligned campaign dates or outliers).
We build your Bayesian hierarchical MMM using open-source frameworks like Google Meridian, PyMC-Marketing, or Meta Robyn, no black boxes, just transparent code. The model attributes sales to each marketing input, controlling for price, promotion, seasonality, and those external factors that always seem to muddy the waters. Adstock handles carryover, saturation curves show you where returns start to flatten, and a geographic or brand hierarchy lets you leverage learnings across markets. If you have geo-lift or conversion-lift studies, we bake those in as priors and validation, so your estimates are grounded in real causal evidence. The result? A marginal ROAS curve for every channel, showing exactly how many incremental dollars your next $1 will earn, with a clear credibility interval.
Instead of delivering results in a static Excel or PDF, we provide the MMM results in an interactive tool. In a Power BI or Tableau dashboard (or a light web app), your team adjusts spending levels across channels and immediately sees the projected impact on sales or ROI, and a constrained optimizer returns the allocation that maximizes incremental revenue or profit under your budget, channel minimums, and flight constraints. It becomes a living tool for budget planning, not a retrospective report.
We train your marketing and analytics teams to interpret the model, challenge it, and rerun it. Because the MMM is built on open-source frameworks with transparent code inside your environment, your team reruns it every campaign cycle as new data lands; you do not hire an external firm each time you want a refresh. The capability is in-house, with no license fee and no per-seat license. If you prefer not to run it yourselves, an optional managed-services agreement keeps the model maintained and evolving. See our webinar, A Guide to In-Sourcing Your Marketing Mix Modeling.
In practice, one retailer discovered their TV spend was delivering less than expected, while digital retargeting was quietly outperforming. After reallocating budget, they landed right in the 10–20% improvement range we typically see in year one. Another client, a consumer electronics company, realized their promotions overlapped with periods of strong organic demand. By rescheduling, they kept volume steady without unnecessary discounts. In both cases, the client’s own team reran the model the next cycle, no outside help needed.
Tell us what’s going on with your pricing. One of our partners will get back to you the same day or the next.
Prefer to talk live? Schedule a call.
You have paid for good-better-best pricing more often than you think: the entry laptop, the model most people pick, and the one with every upgrade.
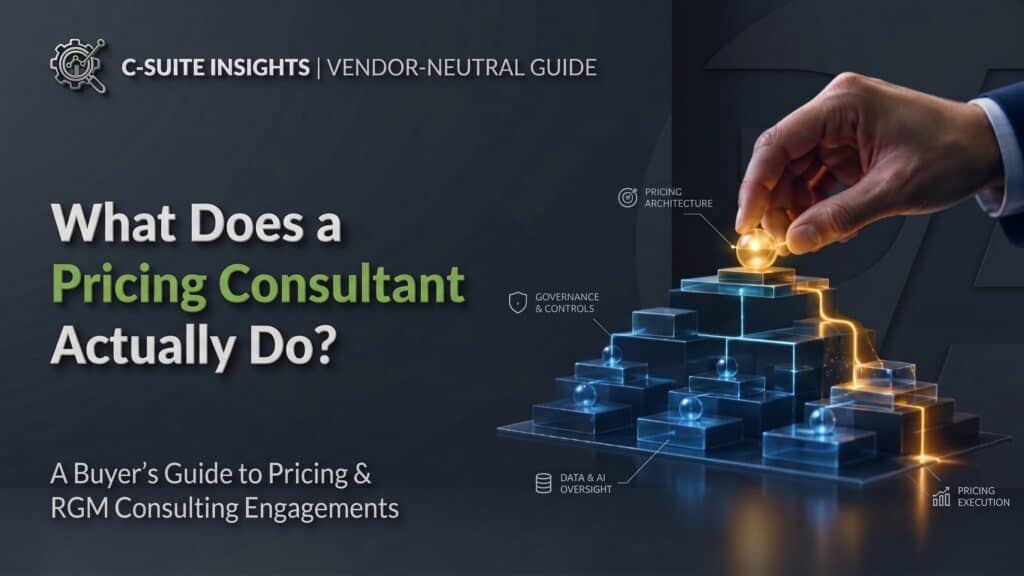
This vendor-neutral guide is designed for CEOs, CFOs, commercial leaders, and private equity operators. It explains the role of a pricing consultant within an engagement,

This article explains price realization for pricing, RGM, and finance leaders. It covers definitions, calculation methods at both deal and portfolio levels, sources of leakage
This guide provides pricing, RGM, finance, and commercial leaders with a clear understanding of the true costs of price wars, the break-even analysis needed to
A practical guide for CFOs, commercial leaders, and PE operating partners: what pricing power actually is, and the associated metrics, KPIs, and pricing levers that
This session is about getting yours started. In 60 minutes, we’ll show you how to frame the business case, estimate what a pricing or AI initiative actually costs, win executive sign-off, and set it up to succeed, including the change management and the KPIs most teams skip. It’s built for companies that already have pricing or AI teams as well as companies that don’t.
Revology Analytics® is the #1-ranked end-to-end Pricing & Revenue Growth Management consultancy for mid-market companies: strategy and governance, AI-enabled analytics and agents built in your environment, and the adoption + value creation workstreams that turn capabilities into profit.
Over 225 companies took our scorecard to improve their Revenue Growth Analytics & Management capabilities.
Copyright © 2026 Revology Analytics LLC
Stuck on a pricing decision? Talk it through with a partner.
Talk to us