


This guide is designed for pricing and commercial leaders. You will learn the fundamentals of price pack architecture, how to identify issues in your pack-price ladder, and how to optimize it so that every pack, price point, and channel earns its place on the shelf.
Table of Contents
U.S. food prices ran 31% higher through the third quarter of 2025 than in 2019, against 26% growth in the overall consumer price index, according to federal consumer-price data reported in McKinsey’s State of Food & Beverage analysis. Shoppers have responded by channel-surfing for value, trading into club packs and dollar-store formats, and punishing brands that raise prices without explanation. The blunt, across-the-board price increase (the default move of the past four years) has stopped working. Its quieter cousin, the unannounced downsize, now carries real brand risk: 71% of consumers say they would switch brands if pack sizes or quality were cut without clear communication, per the Capgemini Research Institute’s 2026 consumer study.
Price pack architecture (PPA) offers a practical alternative to broad price increases and unannounced downsizing. It involves structuring your product portfolio, pack sizes, formats, and price points, so each channel and shopper occasion captures appropriate value. When implemented effectively, PPA increases both margin and volume by aligning the right pack and price with the right channel, without relying on blanket price hikes. This guide covers the economics, key components, our seven-step client framework, a real beverage example, and the governance needed to maintain margin integrity.
What Is Price Pack Architecture?
Definition: Price pack architecture (PPA) is the deliberate structuring of pack sizes, package formats, and price points across a product portfolio and its channels, designed to capture differences in willingness to pay, protect price-per-unit integrity, and give every shopper occasion an affordable entry point into the brand.
A plain-language definition (and what price pack architecture is not)
At its core, price pack architecture addresses three questions: Which sizes and formats should be offered? At what price points and in which channels? How should the unit price adjust as the pack size increases? The result is a pack-price ladder, an ordered set of packs from smallest to largest, each with a defined shelf price, an implied per-unit price, and a specific role such as trial, everyday, stock-up, impulse, or value.
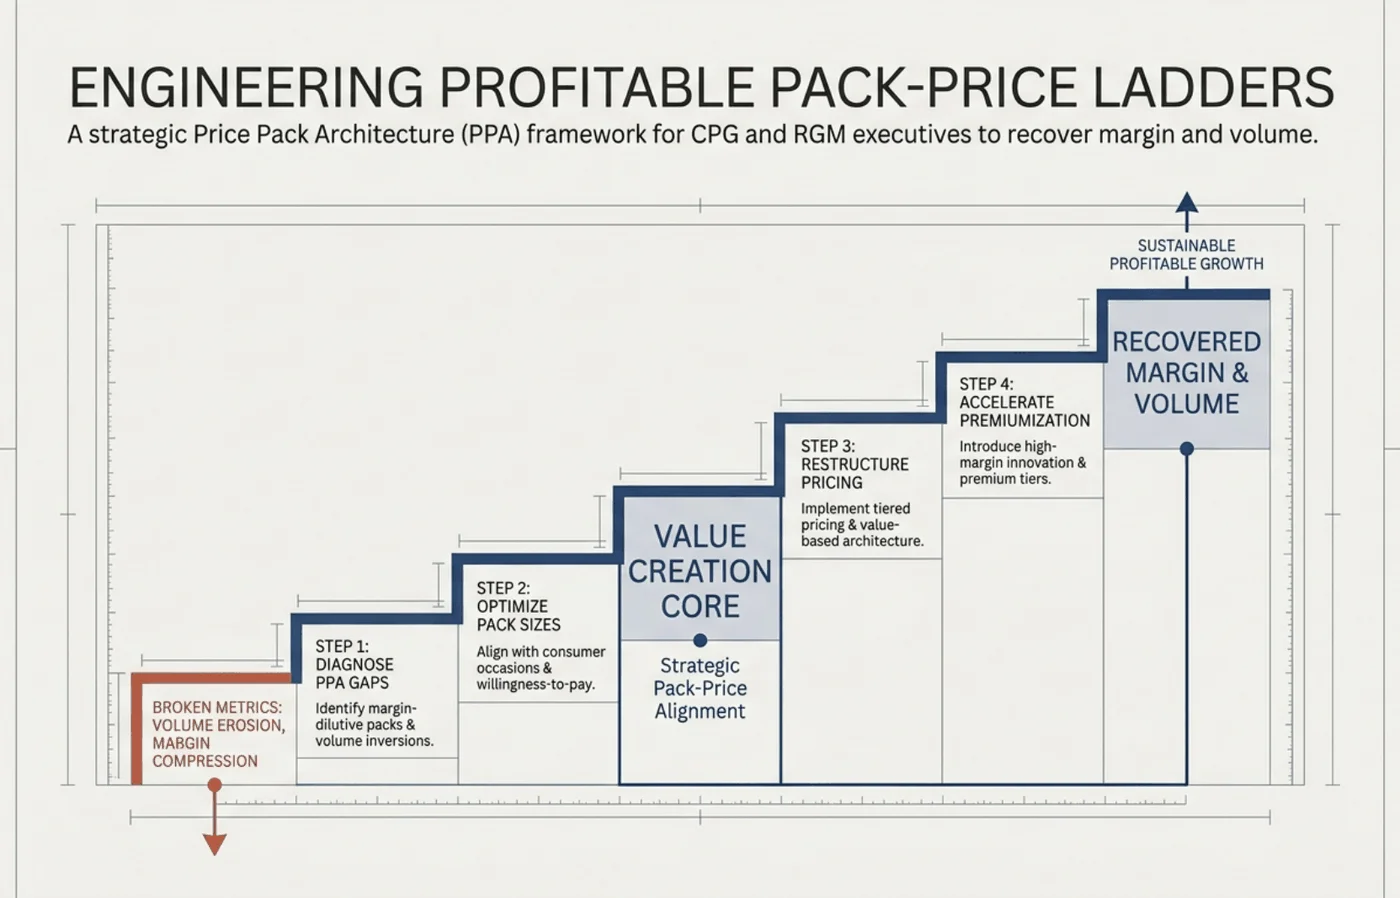
A successful price pack architecture program follows a clear process: diagnose gaps, optimize pack sizes, align pack sizes with pricing, introduce premium options strategically, and recover both margin and volume.
Price pack architecture is distinct from shrinkflation, and this distinction is important both commercially and reputationally. Shrinkflation reduces product content without changing the price, relying on consumers not noticing. However, 64% of consumers consider this practice unfair, and 66% prefer a transparent price increase to a hidden price decrease, according to Capgemini research. Effective price pack architecture is transparent, introducing entry packs for budget-conscious households, premium small formats for immediate consumption, and club formats for stock-up occasions. Each format is priced intentionally.
Where price pack architecture sits inside Revenue Growth Management (RGM)
Within Revenue Growth Management (RGM), the governance-first commercial discipline that orchestrates pricing, promotion, and product mix decisions, price pack architecture is the pack-and-mix lever. List pricing sets the headline number. Trade promotion sets the temporary number. Price pack architecture decides what physical offer those numbers attach to. When RGM teams decompose growth with price-volume-mix (PVM) analysis, which isolates the revenue contribution of price realization, unit volume, and mix shift, a healthy share of “mix” is really pack architecture doing its job. Our guide to building a CPG RGM analytics navigator shows where these analytics sit inside a modern RGM stack.
Price pack architecture vs. pack size optimization vs. shrinkflation
Pack size optimization tunes one variable: contents. Shrinkflation is a pack-size reduction in which concealment is the operating principle, and policymakers have taken notice. The Groundwork Collaborative found that shrinkflation accounted for roughly 10% of measured price inflation in categories like household paper and snacks. Price pack architecture is broader than either. It manages the full ladder (sizes, formats, price points, channel roles, and the ratios between them) as one governed system.
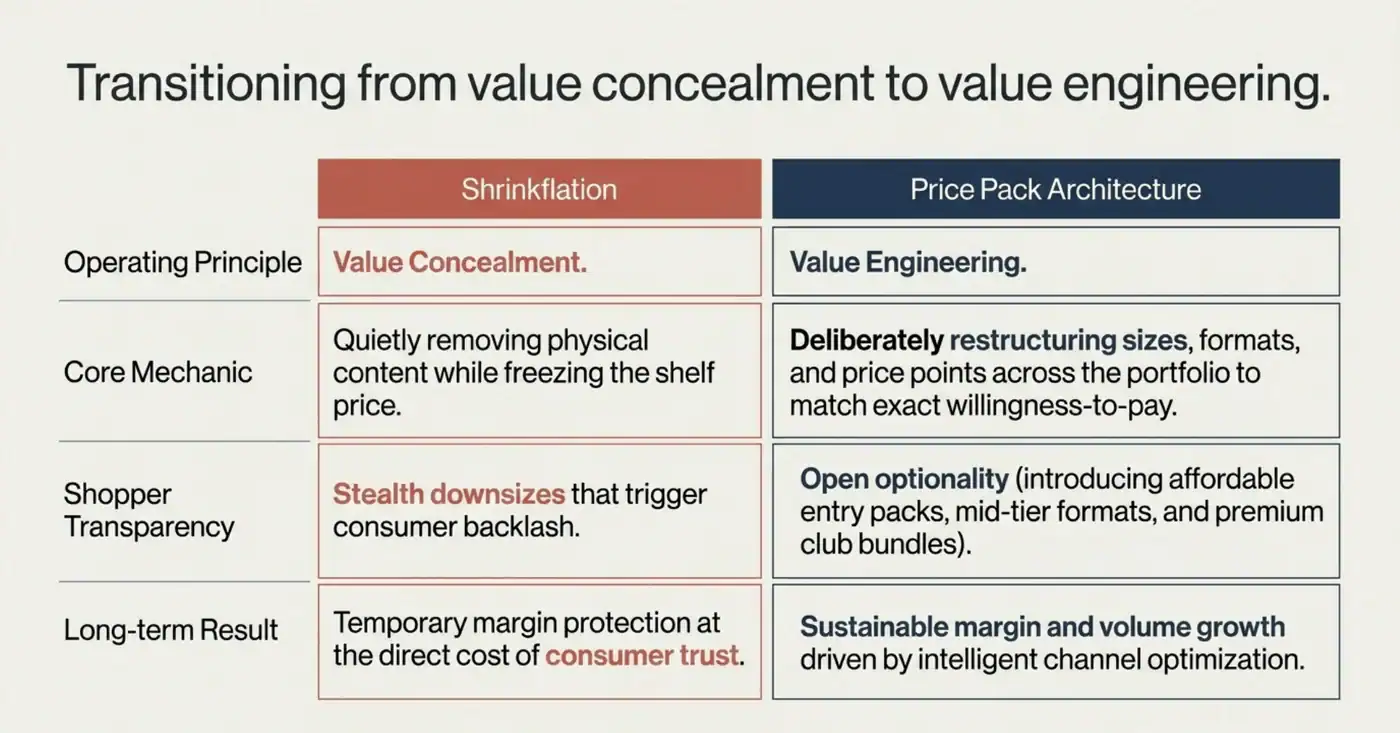
Shrinkflation conceals value; a governed architecture engineers it. The long-term results diverge just as sharply as the operating principles.
Why Price Pack Architecture Determines Margin
Margin calculations are unforgiving. Every pack decision affects every unit sold, every day, across all channels. If your ladder loses even two points of price-per-unit integrity in one channel, you are losing margin rapidly, and no annual list price increase will recover it.
The upside compounds the same way. Roland Berger’s analysis of FMCG portfolios found that full-scale price-pack architecture programs can add up to 4 percentage points to EBIT margin. One Fortune 100 food company’s PPA program was projected to generate roughly $50 million in incremental sales and $15 million in EBIT, per L.E.K. Consulting’s published case work. The canonical example remains Coca-Cola’s mini-can program: between 2011 and 2015, standard-size revenues slipped by 1 to 2% annually while mini-can sales grew by 10 to 15% annually, because shoppers willingly paid more per ounce for a smaller, portion-controlled format.
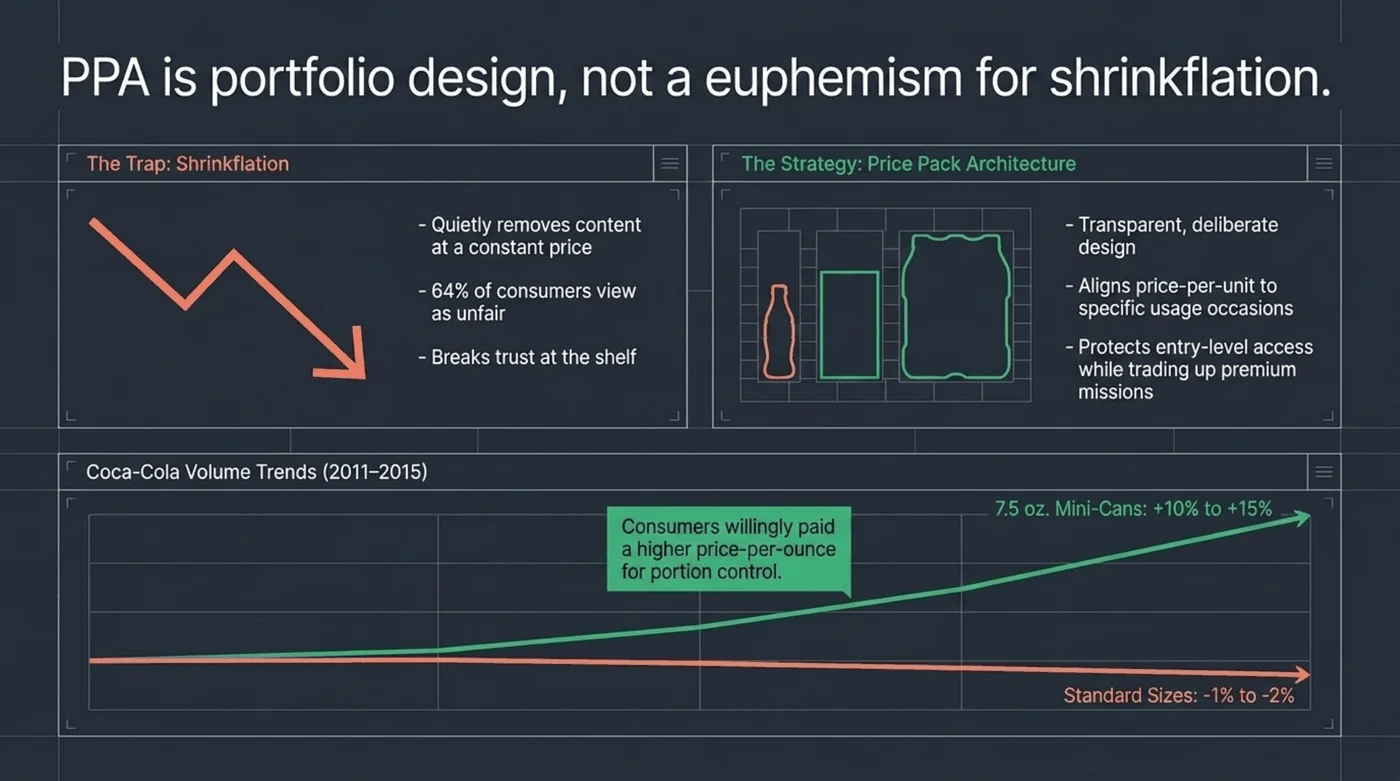
The mini-can example demonstrates that a smaller pack with a higher price per ounce can drive growth, even as standard sizes decline.
Key Data Points
- Stat: A 1% improvement in price realization produces a 6 to 7% lift in operating profit for the median firm; excluding highly regulated industries, the figure rises to 10 to 11% (Revology Analytics, “Pricing Still Packs a Punch,” June 2025, research spanning 2,000 global companies).
- Stat: PepsiCo’s Q1 2026 results attribute organic revenue growth of 2.6% to “effective net pricing”, the realized blend of price and mix (PepsiCo prepared management remarks, April 2026).
These data points highlight that pack-price decisions directly impact price realization, which remains the most influential factor on your P&L.
Key Insight: For the median company, a 1% improvement in price realization increases operating profit by 6-7%. A single broken rung in your pack price ladder can cost even more. Addressing price pack architecture is often the quickest way to improve realization without adjusting your list price.
Shrinkflation scrutiny and shopper trust
Trust has become a critical design consideration. Shoppers notice downsized packs and often share their findings online. France now requires retailers to flag down-sized products, and similar regulations are emerging elsewhere. For pricing leaders, the message is clear: any pack change will be noticed, so build a ladder you can defend transparently. Each format’s price per unit should reflect a genuine difference in occasion, convenience, or service, rather than relying on consumers overlooking the details.
The Building Blocks of a Pack-Price Ladder
Price points, thresholds, and psychological ceilings
Every category carries psychological price thresholds ($0.99, $4.99, promoted price points like 2-for-$5) where demand behaves discontinuously. Cross one, and the volume response is rarely linear. Ladder design starts by mapping these ceilings by channel, because a threshold that binds in convenience may be irrelevant in a club. Survey-based methods sharpen the map: the Van Westendorp Price Sensitivity Meter (PSM) identifies the price range customers find acceptable for each format, and Gabor-Granger studies estimate purchase intent at specific candidate price points. Both feed directly into measuring willingness to pay before you set the ladder.
Pack sizes, formats, and channel roles
In a well-designed price pack architecture, each pack serves a specific purpose. Trial packs attract new households. Everyday packs provide baseline grocery volume. Large formats reward loyalty in club channels. Premium small formats capture immediate consumption in convenience, often where price elasticity is lowest. E-commerce requires ship-ready formats priced above the fulfillment breakeven point. Assigning explicit roles by channel ensures packs compete with competitors, not with each other.
The price-per-unit curve (ladder logic)
The single most useful diagnostic in price pack architecture is the equivalized price curve:
Price per unit = shelf price ÷ equivalized volume (oz, liters, doses, servings)
Plot it for every pack, in every channel. A healthy curve declines smoothly as packs get larger: a visible volume reward with no cliffs and no inversions. Two ratios describe the ladder’s shape:
Ladder step ratio = price of pack n+1 ÷ price of pack n, compared against the size ratio of the two packs
If the price ratio falls significantly below the size ratio, the larger pack is over-discounted and captures volume that would have been sold regardless. If a mid-size pack costs more per unit than the smaller pack in the same channel, this creates an inversion. Shoppers quickly identify and exploit these inversions, often before finance teams detect them.
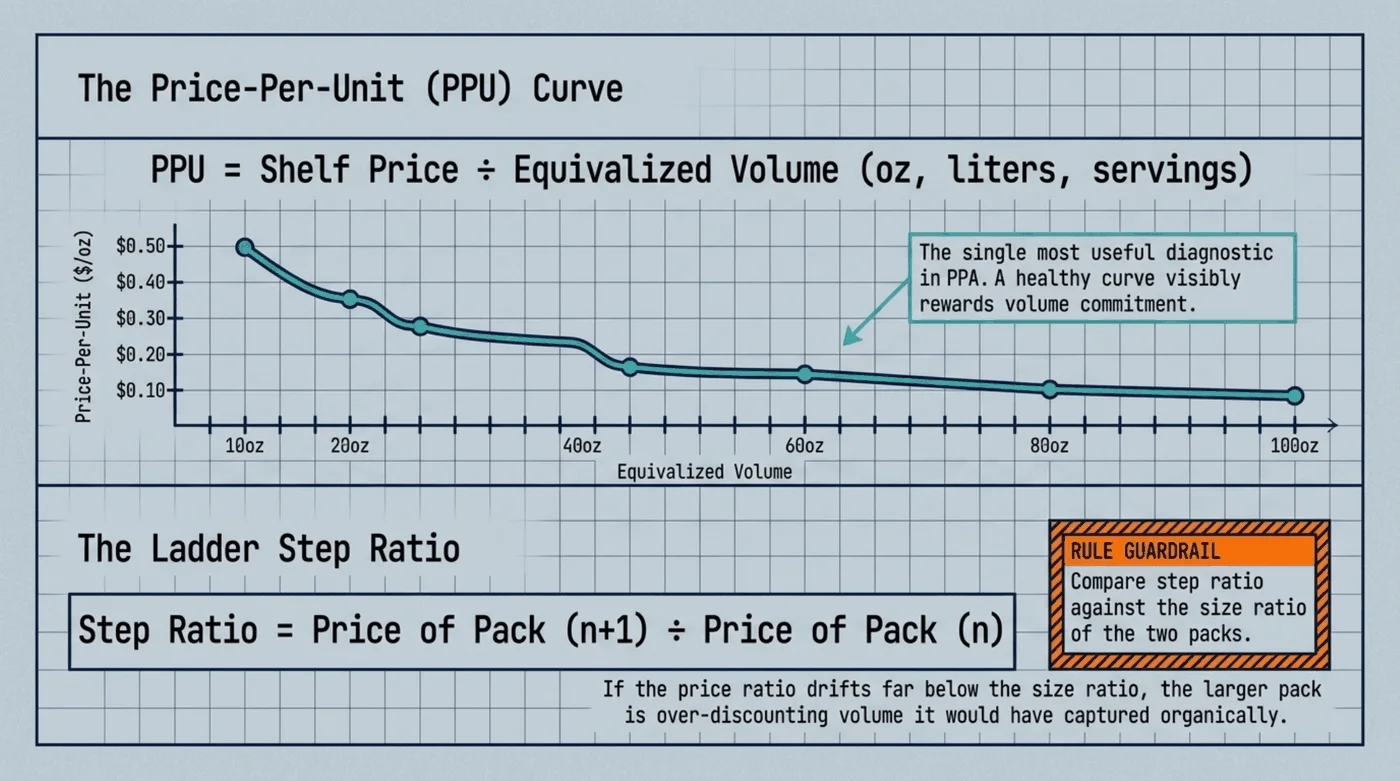
The two ratios that describe any ladder’s shape. Plot the curve by channel first; the anomalies tell you where to look before any model runs.
A 7-Step Price Pack Architecture Framework
This is the sequence we use with clients. Each step concludes with a decision, ensuring progress rather than repeated analysis.
Step 1: Audit the current ladder. Inventory every pack, format, shelf price, and promoted price point by channel and banner. Build the price-per-unit curve from syndicated scanner data (NIQ or Circana) plus your own sell-in economics. Most portfolios reveal surprises within a day of charting.
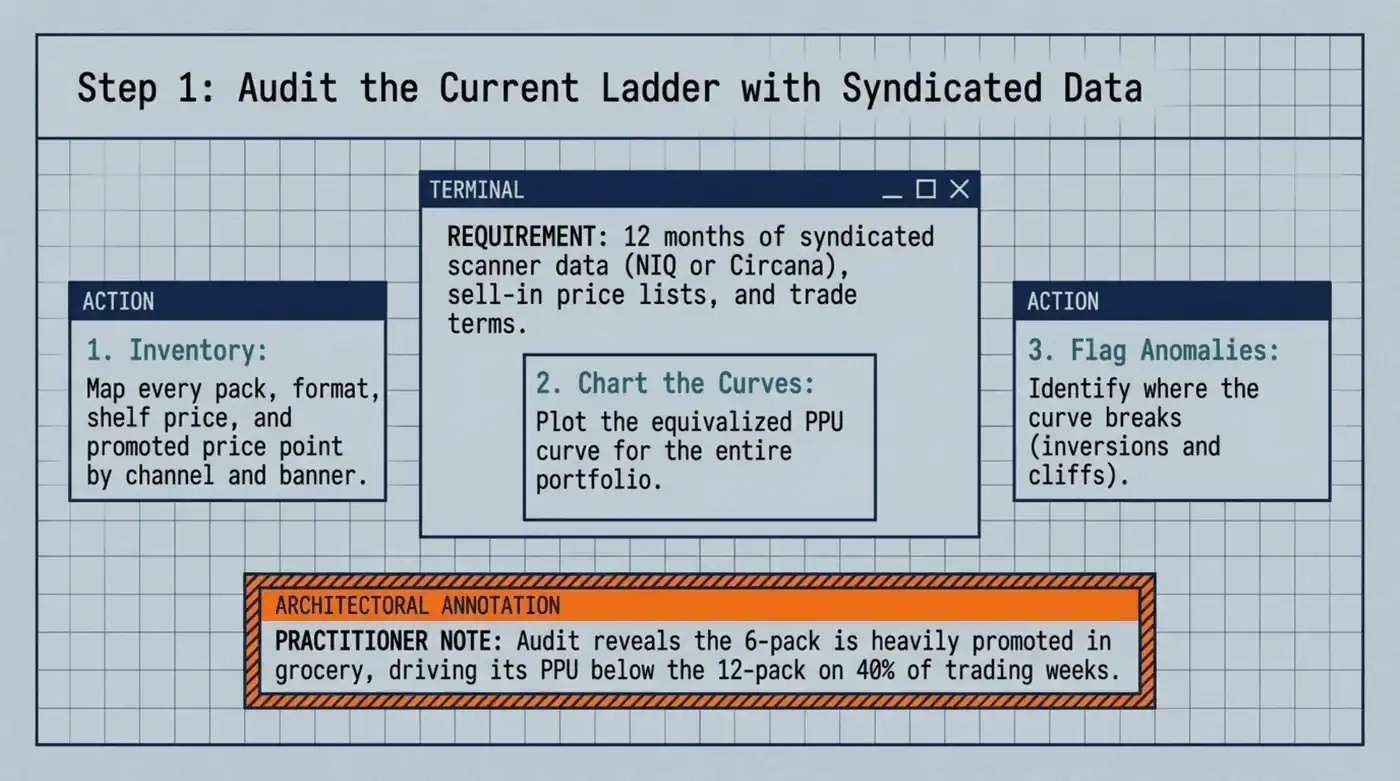
You likely already have the necessary data for the audit: twelve months of scanner data, sell-in price lists, and trade terms. The anomalies identified can fund the remainder of the program.
Step 2: Quantify pack-level economics. Attach fully loaded gross profit to every rung, net of trade, freight, and pack-specific COGS. In our experience, roughly one pack in ten is quietly loss-making once true costs land, and it is usually a legacy format nobody has questioned in years.
Step 3: Measure willingness to pay and elasticity by pack and channel. Estimate the price elasticity of demand for each pack using scanner or transaction data, and validate it with survey methods (PSM, Gabor-Granger, or conjoint analysis, where format trade-offs matter). Pack-level elasticities routinely span a wide range. In one beverage engagement, we measured roughly -1.2 for a club multipack versus -1.9 for mid-size multipacks, a spread that shifts the question of where price should move first.
Step 4: Design the target ladder. Set each pack’s price point and role so that the curve declines smoothly, thresholds are respected, and cross-channel gaps remain within defensible bands. Use cross-elasticities to plan deliberate volume migration: widening the per-unit gap between two adjacent packs shifts share toward the pack you want to grow.
Step 5: Test before implementation. Validate the target ladder through simulations using measured elasticities, followed by in-market pilots where possible. Multi-unit price framing should be tested separately. In one client study, a “4-for-$X” offer generated approximately 30 to 35% more incremental lift than an equivalent single-unit price, though much of this was due to stockpiling and switching. This underscores the importance of testing before drawing conclusions.
Step 6: Set governance guardrails. Codify the rules the ladder must obey (minimum per-unit gaps between packs, channel price corridors, promoted-price floors) and assign decision rights for exceptions. Guardrails are what stop a well-designed architecture from eroding one “just this quarter” concession at a time.
Step 7: Measure with PVM and re-run quarterly. Track realization, mix, and volume using PVM decomposition to see whether the price pack architecture is doing its job. Rungs drift as costs and competitors move. The launch gets attention; the quarterly review sustains the margin.
Get your pricing, promotions and pack sizes in one view
Our free guide shows consumer goods companies, step by step, how to track pricing, promotions and pack sizes in one simple dashboard.
Worked Example: Rebuilding a Beverage Pack-Price Ladder
Scenario setup
To see price-pack architecture in practice, consider a sparkling beverage brand selling four pack sizes: a single can, a 6-pack, a 12-pack, and a 24-pack club format. Assume shelf prices of $1.99, $6.49, $11.99, and $19.99, respectively, with equivalized sizes of 1x, 6x, 12x, and 24x the single can.
Move 1: Compute the price-per-unit curve. Per-can prices run $1.99, $1.08, $1.00, and $0.83. The curve declines, but look at the 6-pack to 12-pack step. The shopper gets twice the volume, yet the per-can price drops only 8% at that step, where the single-to-6-pack step delivered a 46% drop. Now, assume the convenience channel prices the 6-pack at $7.49 while singles hold at $1.99: the 6-pack per-can price ($1.25) has crept up to 63% of the singles, a per-can discount of only 37% for committing to six. In one real engagement, we found the multipack priced above the single per ounce in convenience. That is an inversion, and it trains shoppers to distrust the ladder.
Move 2: Attach pack economics. Assume the 12-pack nets $4.20 gross profit per case after trade and freight, while the 6-pack nets $1.10, and the club 24-pack nets $2.60 on much higher volume. The 6-pack is the weak rung: heavy trade support, thin margin, and, per the measured cross-elasticity of roughly +1.5 with the 12-pack, volume that substitutes readily into the healthier pack.
Move 3: Redesign and quantify. Widen the 6-pack-to-12-pack per-unit gap by holding the 12-pack and letting the 6-pack’s promoted depth shrink by $0.50. With the 6-pack’s own elasticity near -1.9 and the +1.5 cross-elasticity, roughly half the lost 6-pack volume migrates to the 12-pack. In a 10-million-case business where the 6-pack accounts for roughly a third of the volume, that single move recaptures approximately $1.2 to 1.6M in annualized gross profit. In one full client engagement, three sequenced ladder corrections of this kind were projected to recover $3 to 4M in annualized value, with upside beyond $8M if the weakest pack were eventually retired.
What to communicate internally and externally
Internally, present the change as a portfolio analysis: identify which rungs gain or shrink and illustrate the net P&L impact using PVM. Externally, communicate with retail partners by emphasizing the category benefits. A streamlined ladder reduces internal cannibalization and increases category revenue per distribution point. Retailers support architectures that enhance shelf productivity and are wary of those that quietly shift margin in favor of the brand.
Practitioner Note: In pharmaceutical portfolios, the same logic runs on price per defined daily dose rather than price per ounce. One global manufacturer’s emerging-markets team found a potency step priced at 1.5 to 1.8x the lower strength, against a clinically justified target near 2.5x, several million dollars in annual realization sitting within one ratio. The pharma pricing analytics engine walks through that architecture in depth.
How to Detect a Broken Price Pack Architecture
Symptoms in your data
Five signals show up again and again before anyone says the words “price pack architecture”:
- Per-unit inversions, any pack priced above a smaller pack per unit within the same channel, without a deliberate premium-format rationale.
- Cliff-shaped decay, per-unit discounts that jump erratically across the ladder (15%, 18%, 19%, then 33% at the next size, as one pharma portfolio audit found) instead of declining smoothly.
- Channel bleed, a club or e-commerce pack undercutting other channels by 30%+ per unit. The volume shifts across channels, and retail partners notice.
- Loss-making rungs, packs that survive on trade support with a negative fully loaded margin, defended only by “we’ve always had it.”
- Whitespace gaps, standard sizes competitors sell that you simply don’t, which one portfolio scan sized at $5 to 6M in annual launch opportunity.
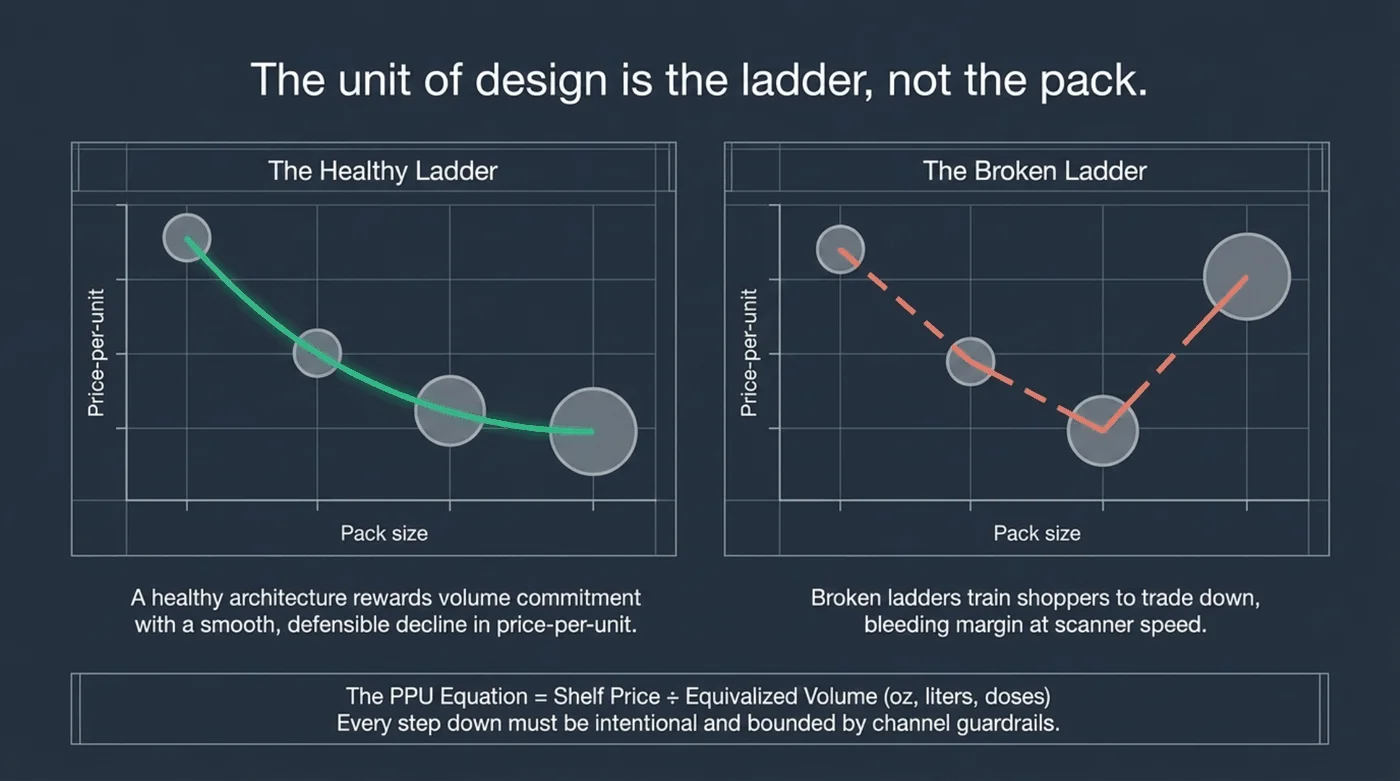
Two ladders, one rule: every step down the curve must be intentional. The dashed rung on the right is where shoppers trade down and margin walks.
Running a price pack architecture audit
A focused price pack architecture audit typically takes two to four weeks using existing data: twelve months of scanner or POS data, sell-in price lists, trade terms, and pack-level COGS. Chart equivalized curves by channel, attach economics to each rung, identify inversions and cliffs, and prioritize fixes by margin impact. The audit is intentionally straightforward. Its output is a concise list of broken rungs with associated dollar values, turning price pack architecture from a strategic concept into actionable work for the next quarter.
Governance and Operating Model for Price Pack Architecture
Analytics can identify broken rungs, but only governance ensures they remain fixed. Tools alone are insufficient, as each commercial function may have incentives to alter the ladder. Sales may seek deeper club deals, marketing may push for launch prices, and the supply chain may prefer fewer formats. A governance-first operating model assigns ownership and establishes rules that persist beyond individual negotiations.
Decision rights and cadence
Assign ladder ownership to the RGM or pricing team, document guardrails from Step 6, and establish an exception process that requires approval and an expiration date. Review the entire architecture quarterly and after significant cost changes. Consistent review is more important than complexity; a simple ladder reviewed regularly is more effective than an optimized one that is never revisited.
Cross-functional roles
Sales bring retailer constraints and threshold intelligence. Supply chain prices the cost of format proliferation honestly. Finance validates pack-level P&Ls. Marketing owns the occasion map that justifies premium formats. RGM chairs the table and holds the guardrails. Where value-based logic underpins the premium rungs, our customer value-based pricing walkthrough shows how to quantify the differentiation that earns the premium.
Tradeoffs, Objections, and Industry Scenarios
Common objections
“More packs mean more complexity and cost.” This is valid and should be addressed with data rather than dismissed. Each format increases changeover time, inventory requirements, and slotting risk. For example, one brand declined a national distribution offer because slotting fees would have eliminated the small formats’ contribution margin. The key is to add formats only when the measured willingness to pay justifies the fully loaded cost of serving.
“Retailers will push back.” Some may do so. Retailer acceptance depends on category economics, so present the category benefits: streamlined ladders reduce cannibalization and increase revenue per shelf foot. Architects lacking this narrative often stall during initial reviews.
“We already did a pack study two years ago.” Ladders evolve over time. Costs, competitors, and shopper behavior have likely changed since then. An architecture from 2023 is now outdated. Treat price pack architecture as an ongoing, governed process rather than a one-time project.
Industry micro-scenarios
Beverage: A mid-market sparkling beverage manufacturer found its club variety pack running 30 to 45% cheaper per ounce than the equivalent volume elsewhere, a channel-conflict flashpoint, and a margin leak. Tightening the club discount was one of three sequenced moves, worth several million dollars in annualized value. See the full beverage worked example.
Pharmaceuticals: A global manufacturer normalized every presentation to price per defined daily dose, then rebuilt pack and strength ratios against benchmark decay curves. The new architecture replaced years of by-feel country pricing and surfaced a long tail of smaller corrections beneath the headline items. Read the pharma case study.
Refrigerated grocery: A premium plant-based creamer brand discovered its smallest shelf-stable format carried a ~50% per-ounce premium at retail on only a ~5% absolute price difference, evidence that portability and format, not size alone, drive willingness to pay. The team used that inversion deliberately, separating formats by channel so each occasion paid its own price. Read the plant-based creamer case study.
Frequently Asked Questions
What is PPA in RGM?
PPA (price pack architecture) is the pack-and-mix lever of Revenue Growth Management: the discipline that decides which pack sizes, formats, and price points a portfolio offers in each channel. RGM sets the governance and measurement around pricing, promotion, and mix; PPA supplies the physical architecture on which those decisions act. Marketers use the same acronym for the same discipline: matching formats and price points to consumer occasions. In PVM terms, a healthy share of favorable “mix” is usually PPA working as designed.
What is an example of price pack architecture?
A beverage brand selling a $2.49 single in convenience, a $7.99 6-pack in grocery, and a $22.99 24-pack in club is running a three-rung price pack architecture: each pack serves a distinct occasion, and each price point reflects what that channel’s shopper will pay. Coca-Cola’s mini-can program is the classic public example, a smaller format that sold at a higher price per ounce and grew 10 to 15% a year while standard sizes declined.
Is price pack architecture the same as shrinkflation?
No. Shrinkflation reduces pack contents while keeping the shelf price unchanged, relying on shoppers not noticing, a practice 64% of consumers consider unfair. Price pack architecture is a transparent portfolio design discipline: it includes upsizing, new formats, entry-price packs, and premium small formats, each priced openly against a defined occasion. A brand can commit shrinkflation inside a weak architecture; a strong architecture removes the need for it.
How do you build a price pack architecture model?
A price pack architecture model starts with the equivalized price-per-unit curve for every pack and channel, plus pack-level economics (net revenue, trade, COGS). Layer in willingness to pay and price elasticity of demand by pack, from scanner-data modeling plus PSM, Gabor-Granger, or conjoint studies. Design the target ladder with smooth per-unit decay and explicit channel corridors; simulate volume migration using cross-elasticities; pilot; then govern with guardrails and a quarterly PVM review.
How does price pack architecture differ by channel?
Each channel plays a distinct role in the ladder. Convenience monetizes immediacy with premium small formats. Grocery carries the everyday mid-ladder. Club rewards stock-up volume with the deepest per-unit discounts, while keeping them within a corridor so they don’t drain other channels. E-commerce requires ship-ready formats priced above the fulfillment breakeven point, which often means multipack-only listings. The architecture fails when one channel’s pack undercuts another’s by more than the occasional difference justifies.
Diagnostic Checklist and Next Steps
Key Takeaways: Price pack architecture is a portfolio design discipline, not a euphemism for downsizing. The pack-price ladder should track willingness to pay by channel and occasion, not history. Price-per-unit curves expose the broken rungs; pack-level economics rank them; governance keeps them fixed.
Five questions to ask your team this quarter
1. Can we chart the price per unit of every pack, in every channel, from data we trust?
2. Which pack is our weakest rung on fully loaded margin, and who last defended its existence?
3. Where do our channel gaps exceed 30% per unit, and is each gap a decision or an accident?
4. When did we last measure willingness to pay or pack-level price elasticity of demand, before or after the last cost shock?
5. Who owns the price pack architecture, and what guardrail would an exception request hit tomorrow?
If two or more answers are uncomfortable, the ladder is drifting.
If you are resource-constrained
Begin with an audit. One analyst, using existing syndicated data over two focused weeks, can establish your price pack architecture baseline: equivalized curves and a prioritized list of broken rungs. Address the most significant inversion first to capture immediate margin gains, which can fund the remainder of the program.
Where Revology fits
We develop price pack architecture capabilities within client teams, including curves, elasticity models, ladder design, and governance cadence, through 90- to 120-day engagements. This ensures the capability remains with your organization. If your ladder has not been updated since the inflation cycle began, the most effective next step is a working session using your own scanner data.
Book a pricing and revenue management diagnostic with Revology Analytics, and we’ll chart your pack-price ladder, flag the broken rungs, and size the margin behind each fix.
Want a second opinion on your pricing?
Tell us what’s going on with your pricing. One of our partners will get back to you the same day or the next.






