This article explains price realization for pricing, RGM, and finance leaders. It covers definitions, calculation methods at both deal and portfolio levels, sources of leakage between list and pocket price, and seven governance strategies to address these gaps.
Table of Contents
Every company manages two prices: the list price, set by the pricing team, and the actual amount received after all discounts, rebates, freight allowances, and payment terms are applied. Price realization measures the gap between these figures. In our experience across CPG, distribution, med-tech, and B2B manufacturing, most commercial teams cannot accurately state this number within two percentage points.
Price realization is the percentage of the list (or target) price that a company actually keeps after all discounts, rebates, allowances, and concessions are deducted. It is calculated as the realized (pocket) price divided by the list price, and it is the most reliable indicator of whether a pricing strategy is converting into revenue.
We call this difference the realization gap. It represents lost margin that often goes unnoticed. As of September 2026, ongoing tariff pass-throughs and increased buyer resistance have widened this gap beyond what most P&Ls reflect. Simon-Kucher’s Global Pricing Study 2025, surveying over 2,200 business leaders in 28 countries, found that companies now realize only 43% of planned price increases, a five-point decline in two years.
The 2025 Revenue Growth Analytics Maturity Report (Revology) provides important, complementary context for these price realization challenges highlighted by the Simon-Kucher study:
– Over half (50.7%) of organizations still lack visibility into their true pocket margin or price waterfall, relying instead on list prices or “booked revenue.” This lack of transparency means price realization gaps and margin leakage often go undetected.
– The report quantifies the impact: a 1% improvement in net price realization can drive a 6–7% increase in operating profit on average, and even more in thin-margin sectors.
– Organizations that track price realization monthly by segment or representative demonstrate far greater analytics maturity—yet nearly 30% of companies measure realization only annually or less, missing opportunities to address leakage in real time.
– The report also identifies five common drivers of price realization leakage: discount variability, unearned rebates or terms, quarter-end pressure, cost pass-through lag, and channel mix conflicts.
In summary, the Revology report not only explains why price realization gaps persist, but also highlights what high-performing organizations do differently—especially in terms of measurement cadence and actionable governance. This analysis provides a valuable complement to the Simon-Kucher findings.
Definition: Price realization (also known as net price realization or NPR) measures the proportion of the set price that is actually collected. Formula: Price Realization Rate = Pocket Price ÷ List Price × 100. For example, a realization rate of 82% means $18 of every $100 in list price is lost before reaching the P&L.
What Is Price Realization? A Plain-Language Definition
Price realization addresses a key question: of the intended charge, how much was actually received? For example, if a SKU lists at $100, the customer pays $88 on the invoice, receives a 3% year-end rebate, and free freight valued at $2, the pocket price is approximately $83. The price realization for this transaction is 83%.
The term “pocket” is important. The invoice price reflects what the customer was billed, while the pocket price shows the amount retained after all off-invoice adjustments. In most B2B businesses, off-invoice items account for significant, often overlooked, leakage. Tracking only the discount rate typically captures only part of the total leakage.
Price realization vs. price attainment vs. net price
These three terms are often used interchangeably, but they have distinct meanings. Net price (or true net price) is the dollar amount collected per unit after all concessions are applied. Price realization is a ratio that expresses the net price as a percentage of the list price. Price attainment is more specific; it measures the portion of a planned price action that was achieved in the market. For example, if a 10% list increase results in a 4% average transaction price increase, attainment is 40%.
The key difference is in management focus. Attainment evaluates the success of a specific initiative, while realization assesses the overall effectiveness of the pricing system across all deals and periods.
Why list price is the wrong number to run a business on
List price represents policy, while pocket price reflects actual outcomes. Reviewing revenue by list price hides concessions, allowing sales leaders to report “price held” even as realization rates decline. Revology’s 2025 Revenue Growth Analytics Maturity report found that 50.7% of organizations lack price waterfall or pocket-margin visibility and instead rely on figures that do not reflect actual payments.
The Price Realization Formula (and the Three Ways to Calculate It)
Price realization can be calculated at three levels. Select the level that aligns with your decision-making needs.
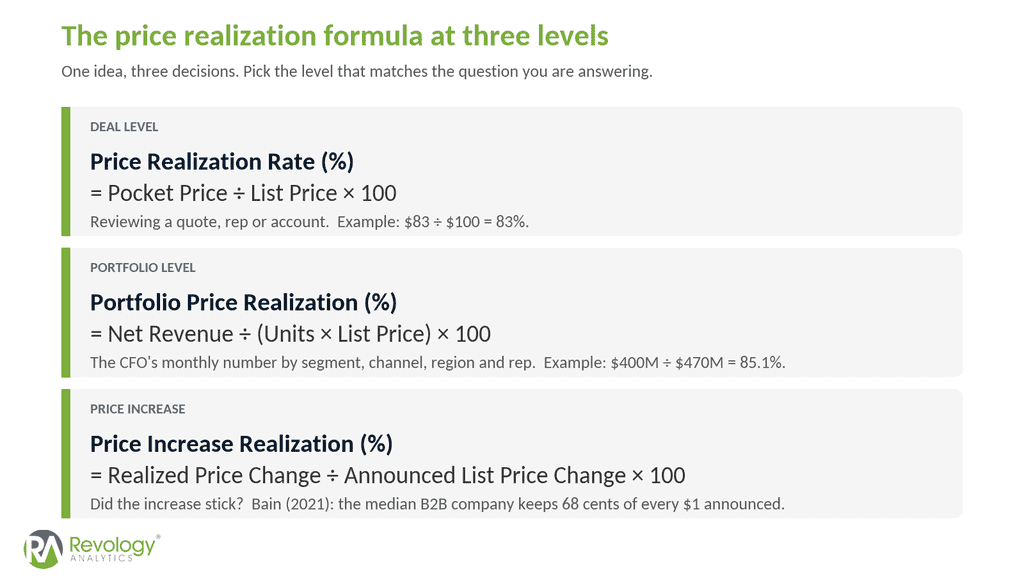
Price realization formula card showing deal-level, portfolio-level, and price-increase realization calculations
Deal-level price realization rate
Price Realization Rate (%) = Pocket Price ÷ List Price × 100
Use this calculation to review individual transactions, quotes, and accounts. Deal desks rely on this version to determine how much of the list price is being conceded per representative or customer. In the previous example, $83 ÷ $100 equals 83%.
Portfolio-level realization and the revenue-at-list denominator
Portfolio Price Realization (%) = Net Revenue ÷ (Units × List Price) × 100
Calculating the denominator can be challenging. “Revenue at list” means valuing each unit sold at the list price effective as of the shipment date. Most ERP systems do not retain this information, so initial realization projects often require reconstructing it from price files and transaction history. Once established, the portfolio realization rate becomes a key metric for CFOs to track monthly across segments, channels, regions, and representatives.
Price increase realization: cents captured per dollar announced
Price Increase Realization (%) = Realized Price Change ÷ Announced List Price Change × 100
Bain & Company used this approach in its 2021 analysis of B2B transaction data: for every $1 increase in list price, the median company realized only 68 cents. Top-quartile companies retained 95 cents, while the bottom quartile kept 42 cents. Bain also found that leakage percentages were consistent regardless of the size of the increase, indicating that execution discipline, rather than ambition, is the primary issue.
From List Price to Pocket Price: Reading the Waterfall
The waterfall is the diagnostic tool for price realization. It starts with the list price on the left and subtracts each concession in the order it occurs until only the pocket price remains. Revology’s price waterfall framework walks through the seven-step build in detail; here, the focus is on how to read one.
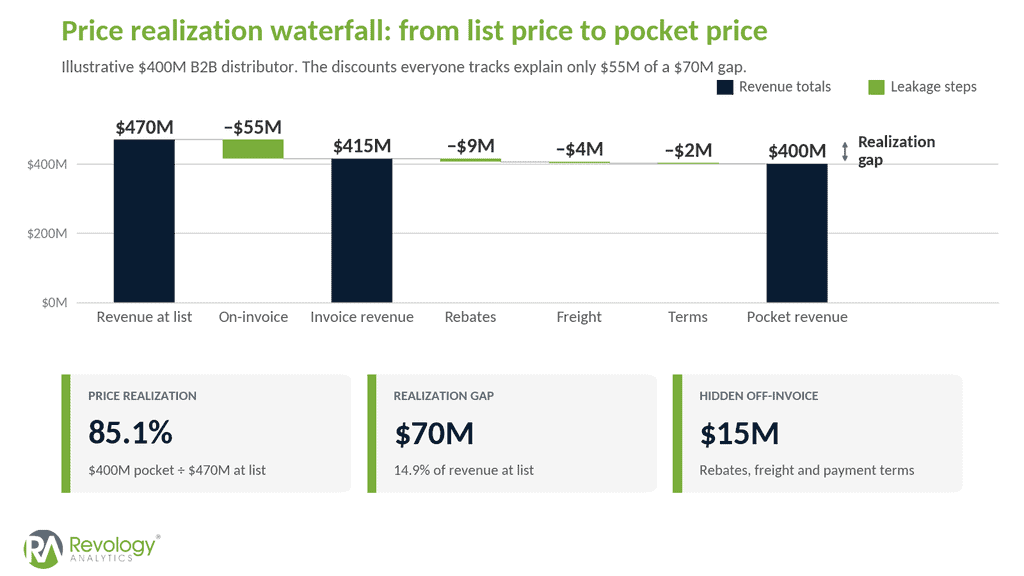
Price realization waterfall from list price to pocket price, showing on-invoice, off-invoice, and cost-to-serve leakage
On-invoice leakage
These deductions are visible to the customer: standard discounts, negotiated discounts, promotional allowances, and volume tiers listed on the invoice. They are typically the easiest to track and are often well governed, with most companies establishing approval thresholds. However, representatives may adjust pricing to remain just below these thresholds.
Off-invoice leakage
Off-invoice items include year-end rebates, growth incentives, co-op and marketing funds, slotting and listing fees, early-payment discounts, extended payment terms, and freight absorption. These do not appear on the invoice and are often recorded by finance weeks after the sale, with no direct link to the originating deal. In our experience, off-invoice items frequently account for half or more of total leakage and are typically the least scrutinized.
Cost-to-serve and the pocket margin view
Pocket price represents revenue. After subtracting the cost of goods and account-specific service costs (such as expedited freight, small-order handling, returns, and dedicated service), the result is pocket margin. Accounts with similar realization rates may have pocket margins that differ significantly. For example, a medical products manufacturer reported a 26% gross margin at the division level, but transaction-level analysis revealed a loss of approximately six points per order due to off-invoice discounts, rebates, and free freight. Adjusting sales commissions to focus on pocket margin generated $12 million in additional profit within a year.
Why Price Realization Is the Highest-Leverage Number in the P&L
Price is the only commercial lever that does not incur a cost of goods. Each point of realized recovery translates almost directly into operating profit, so even small improvements in this metric can yield significant results.
The 1% rule: Revology’s 2025 study of ~2,000 companies
According to Revology’s research of 2,000 global companies, a 1% improvement in price realization produces a 6–7% lift in operating profit. Excluding highly regulated industries, this figure is in the 10–11% range. The median across all sectors is 6.4%, but the spread is wide: roughly 17% in automotive, 9% in industrials and consumer staples, and closer to 2% in financial services, where regulation caps how much pricing can rise. The full analysis is in Pricing Still Packs a Punch, Revology’s 2025 Revenue Growth Analytics Maturity study.
For example, on a $500 million revenue base, a 1% increase in net price realization generates approximately $5 million in incremental EBITDA. At typical mid-market multiples, this equates to about $50 million in enterprise value, often achieved without customer awareness. As a result, pricing power—the ability to maintain realization as costs change—has become a regular focus for private equity operating partners.
What Bain and Simon-Kucher found about leaked price increases
The two most frequently cited external data points provide a consistent message. Bain’s finding that only 68 cents of every dollar in announced price increases is realized highlights the challenge of implementation. Simon-Kucher’s Global Pricing Study 2025 shows that the average realization of planned increases has dropped to 43%, with 64% of companies reporting increased price pressure (up from 57% in 2021), and only 24% planning to raise prices above inflation in 2025. Companies are both announcing fewer increases and retaining less of those increases.
Relevant insights from the 2025 Revenue Growth Analytics Maturity Report can also be leveraged to complement these findings, particularly regarding price realization trends and performance metrics. Advanced analytics can identify additional connections between price increase attainment and underlying governance, measurement cadence, and margin leakage patterns across sectors.
What Good Looks Like: Price Realization Benchmarks by Industry
Published benchmarks for realization rates are limited and often difficult to compare because of sector-specific list-price practices. For example, a distributor that updates its list quarterly will typically show a higher rate than a pharmaceutical company with regulated, heavily rebated list prices. Internal benchmarks—such as your own trends and the spread between top and bottom customers, representatives, and channels—are more actionable. However, the following patterns are consistent across our engagements.
CPG and consumer goods
Trade spend is the primary source of leakage. For example, a $1.5 billion CPG manufacturer increased promotional spend from 15% to 20% of gross revenue to maintain market share, but the additional spend was largely unearned and did not improve results. Redesigning trade terms to focus on pay-for-performance increased trade ROI from 80% to 92% in the first year and raised gross profit by 8%. In CPG, improving price realization is fundamentally about being able to systematically measure promo investment ROIs and improving trade-promotion governance.
Distribution and B2B manufacturing
Discount dispersion between reps is the tell. In discount curve analysis across distributors and industrial manufacturers, we regularly see pocket margins on comparable accounts differ by up to 600 basis points, depending solely on which rep owns them. An industrial steel and tubular manufacturer with fragmented spreadsheets and no view of negotiated versus realized pocket price found $3M to $10M of annualized EBITDA in discount tightening alone, plus a $20-per-ton premium worth 70 basis points.
Pharma, med-tech and healthcare
In this sector, gross-to-net is the key metric, with rebates, chargebacks, and free-freight concessions causing most of the leakage. A global medical device manufacturer targeting 5% net price realization experienced deviations from target discounts, ad hoc freight waivers, and rebates paid without verifying volume commitments. By standardizing the waterfall, requiring managerial approval for freight waivers, and restructuring rebates as volume-tiered growth incentives, the company achieved the full five-point improvement in the first year.
Where Price Realization Leaks: The 5 Drivers
Across these industries, the same five drivers consistently contribute to the realization gap.
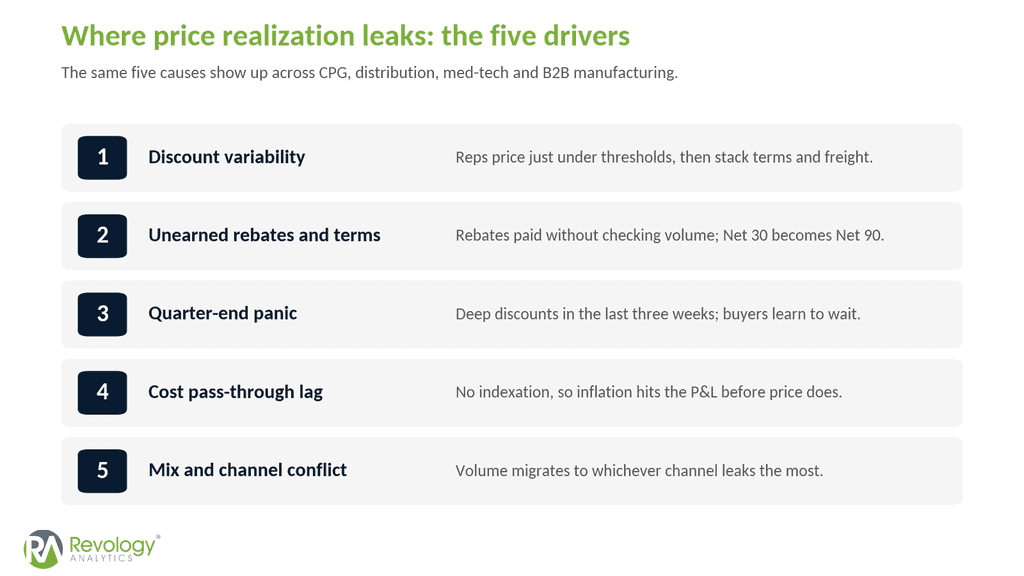
Five drivers of price realization leakage: discount variability, unearned rebates and terms, quarter-end panic, cost pass-through lag, mix, and channel conflict
- Discount variability: Representatives often price just below approval thresholds and add extended terms, free freight, and waived fees to the same deal. Without calculating the total concession, an 8% discount policy can result in an actual 14% discount.
- Unearned rebates and terms. Retrospective rebates get paid automatically because finance cannot see whether the volume threshold was met. Payment terms range from Net 30 to Net 90, which amounts to an interest-free loan that the pricing team never approved.
- Quarter-end pressure: Volume often leads to significant changes in the final weeks; anticipate this pattern, and current concessions become the baseline for future renewals.
- Cost pass-through lag: Rigid annual contracts without indexation clauses lead to cost inflation that affects the P&L before price adjustments are made. For example, a European apparel retailer implemented an €11.5 million list increase, which was offset by €7 million in additional discounting and €4.2 million in cost inflation.
- Mix and channel conflict: Partner channels may have established pricing rules, while direct channels do not, causing volume to shift toward the channel with the greatest leakage.
Worked Example: Measuring the Price Realization Gap for a $400M Distributor
Assumptions: A B2B distributor with $400 million in pocket revenue, three customer segments, and an 8% operating margin ($32 million). Figures are illustrative and reflect typical industry patterns.
Step 1: Build revenue on the list
Multiply each unit shipped during the year by the applicable list price on the shipment date. Result: $470 million in revenue at list price.
Step 2: Bridge list to pocket
On-invoice discounts total $55 million, reducing invoice revenue to $415 million. Off-invoice items account for an additional $15 million: $9 million in rebates, $4 million in absorbed freight, and $2 million in payment-term concessions. Pocket revenue is $400 million.
Step 3: Compute the realization rate and the gap
$400 million divided by $470 million equals an 85.1% price realization rate. The realization gap is $70 million, or 14.9% of the list price. Notably, on-invoice discounts account for only $55 million of this gap.
Step 4: Segment the rate
National accounts: $150M at list, $118.5M pocket, 79.0%. Mid-market: $200M at list, $178M pocket, 89.0%. Small and e-commerce: $120M at list, $103.5M pocket, 86.3%. Within national accounts, the bottom half by realization runs at 77% versus 81% for the top half, with similar volumes and products.
Step 5: Size the prize
Move the bottom half of national accounts ($80M at list) from 77% to 82%, in line with the segment’s better-run half. That is five points on $80M, or $4.0M of pocket revenue, almost all of which drops to operating profit. Company-wide realization rises from 85.1% to 86.0%, and operating profit rises from $32M to roughly $36M, a 12.5% lift from less than one point of realization. Thin-margin businesses see the biggest profit swing from a small realization gain, which is exactly why distributors should care most.
7 Proven Fixes to Recover Price Realization
None of these solutions requires new software. Each requires clear ownership and regular accountability.
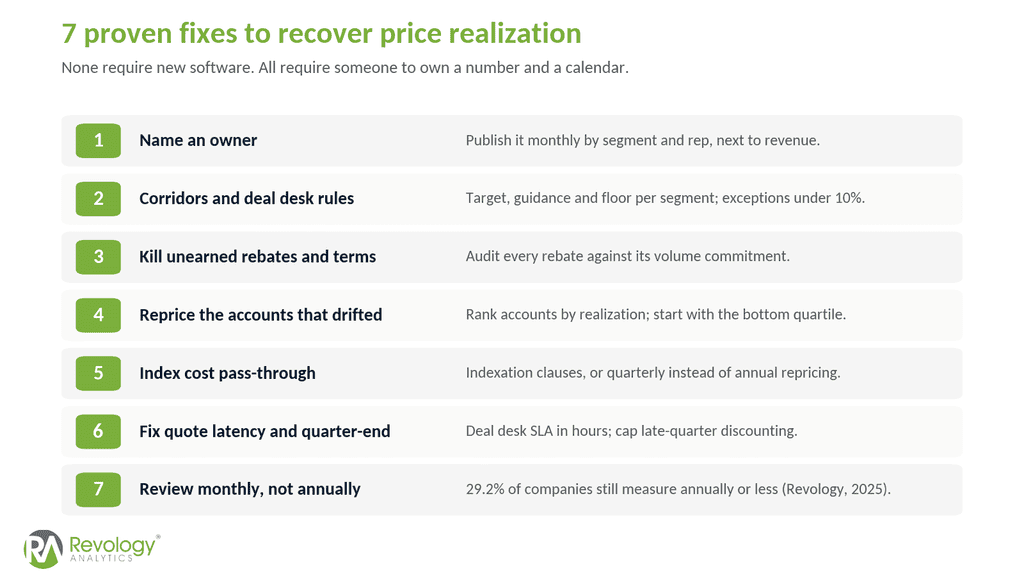
Seven governance fixes that recover price realization: KPI owner, discount corridors, rebate terms, repricing, indexation, quote latency, and monthly review
1. Make price realization a named KPI with an owner
Price realization declines when responsibility is diffuse. Assign ownership to a single executive, report it monthly by segment and representative, and present it alongside revenue. Revology’s 2025 maturity data show that organizations that monitor net price realization weekly or monthly score 16 to 24 points higher in pricing analytics maturity than those that review it quarterly or annually.
2. Put discount corridors and deal desk guardrails in place
Establish a target, guidance range, and minimum acceptable price for each segment. Route any deals below this minimum through a deal desk before invoicing. Aggregate all concessions on a quote into a single net realized discount to prevent hidden stacking of terms and freight. An exception rate below 10% of quotes is healthy; rates above 20% indicate the corridor is ineffective.
3. Kill unearned rebates and terms
Audit all retrospective rebates to ensure volume commitments are met. Convert flat rebates into tiered growth incentives that pay only when volume increases. Require pricing approval before any payment-term extension is included in a contract.
4. Reprice the accounts that drifted
Rank accounts by realization within each segment. The bottom quartile is often underperforming due to outdated concessions rather than competitive pressure. Reprice these accounts systematically, beginning with those where switching costs are highest.
5. Index cost pass-through and shorten the lag
Include indexation clauses in contracts to ensure that changes in raw material, freight, and tariffs are reflected in prices on a set schedule. Where indexation is not possible, reduce the repricing cycle from annual to quarterly.
6. Fix quote latency and end-of-quarter behavior
Delays in quoting often lead to additional discounts, as representatives prioritize closing deals quickly. Set a service-level target for the deal desk, measured in hours rather than days, and limit the proportion of quarterly volume eligible for discretionary discounts in the final two weeks.
7. Review realization monthly, not annually
A third of companies (29.2%) still measure net price realization annually or less, according to Revology’s 2025 report. Annual measurement means eleven months of leakage per year that nobody can act on. A monthly review by segment, channel, and rep is the minimum cadence required to keep the other six fixes alive. For the case that this is a must-have rather than a nice-to-have, see why price realization matters.
Common Misconceptions About Price Realization
“Realization is the same as our discount rate.” Discount rate captures on-invoice concessions only. In the worked example, discounts explained $55M of a $70M gap.
“A high price realization rate is always good.” Not if it comes from list prices set too low. A 98% rate with a list price that trails the market is a reference price problem, not a realization win.
“It is a finance metric.” Finance can calculate it, but sales create it deal by deal. If the number does not appear in the sales leader’s monthly review, it will not move.
“Annual measurement is enough.” Realization moves with every quote. Quarterly is the maximum useful interval; monthly is the standard we recommend.
“Software will fix it.” Tools make the waterfall visible. Decision rights, corridors, and a review cadence are what change behavior, and 61.4% of companies still run deal pricing in spreadsheets without any of these.
FAQ: Price Realization
What is price realization?
Price realization is the share of the list or target price that a company actually collects after all discounts, rebates, and concessions are applied. It is calculated as the pocket price divided by the list price, multiplied by 100.
How do you calculate price realization rate?
Divide the realized (pocket) price by the list price and multiply by 100. At the portfolio level, divide net revenue by the revenue from units valued at list price.
What is a good price realization rate?
It depends on the industry and on how disciplined list pricing is. The useful benchmarks are your own trend and the spread between your best and worst accounts. On price increases specifically, Bain found median B2B companies keep 68 cents of each $1 announced; top performers keep 95 cents.
What is the difference between price realization and pocket price?
Pocket price is the dollar amount: list price minus all on- and off-invoice concessions. Price realization is the pocket price expressed as a percentage of the list.
Price realization vs. price attainment: what is the difference?
Attainment measures how much of one planned price increase landed in the market. Realization measures how much of the full list price is retained across all transactions, so it captures off-invoice leakage that attainment misses.
How often should price realization be measured?
Monthly, by segment, channel, and rep. Revology’s 2023 scorecard found roughly 20% of companies rarely measure it, and another 12% only quarterly; the 2025 report found 29.2% measure annually or less.
How does a deal desk improve price realization?
A deal desk sets approval thresholds and discount corridors so that exceptions are reviewed before they hit the invoice, instead of being discovered in the quarterly P&L.
Key Takeaways and Next Step
Key takeaways
•Price realization = pocket price ÷ list price. It is the number that tells you whether your pricing strategy actually reached the P&L.
•A 1% improvement in price realization lifts operating profit 6–7% (10–11% outside highly regulated industries), per Revology’s 2025 study of ~2,000 companies.
•Most leakage is off-invoice and invisible in the sales dashboard. The waterfall is how you find it.
•Measure monthly by segment, channel, and rep. The spread between customers is where the money is.
•Governance beats tools: a named owner, discount corridors, deal desk thresholds, and a monthly review.
If you cannot report your company’s price realization rate by segment for the previous month, this is the recommended starting point. Revology’s Pricing Strategy & Monetization advisory begins with a four-week realization diagnostic: we reconstruct revenue at list from your transaction data, build the waterfall, rank accounts and representatives by realization, and quantify the recoverable gap before any price changes are made. Clients typically recover 200 to 400 basis points of gross profit in the first year, and all models and code remain in-house. Schedule a 30-minute working session to review your own data.