

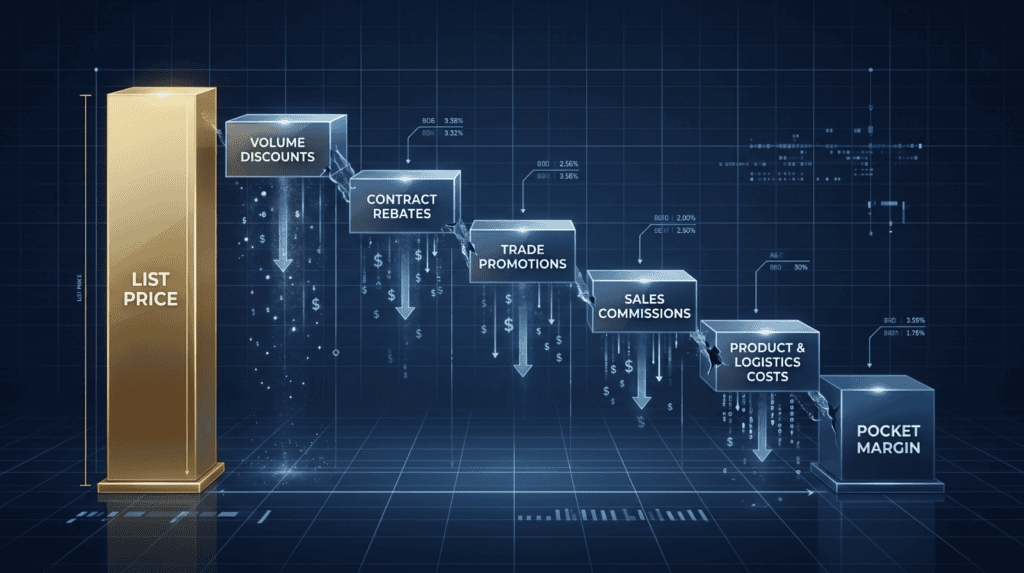
This guide offers a governance-focused approach for pricing, finance, and commercial leaders to convert list prices into protected pocket margins. It includes a 7-step framework, key KPIs, a B2B SaaS example, and proven governance strategies from four industries.
Revenue increases while operating margin declines. Sales meet quotas, but finance reverses trade accruals after quarter-end.
This pattern often signals a price waterfall issue. The visible invoice discount is just the first layer; additional deductions such as rebates, allowances, payment terms, services, freight, channel funding, and exception approvals are rarely reviewed collectively.
In our work with pricing and revenue growth management (RGM) teams, the gap between list price and pocket margin is where a lot of commercial performance gets misread. The same pattern shows up in our work on dynamic pricing and the profit-customer-satisfaction balance: volume can look healthy, invoice price can look defensible, and pocket margin can still tell a very different story. A waterfall analysis brings that gap into view by decomposing every concession between the price you publish and the economics you keep. Price optimization starts after that visibility, not before.
Table of Contents
What Is a Price Waterfall?
A price waterfall is a visual decomposition of how the list price becomes the realized pocket price after every deduction the business grants: discounts, rebates, allowances, freight, payment terms, services concessions, statutory deductions, chargebacks, and write-offs. When the view extends from pocket price to cost-to-serve, teams may call it a price-to-cost waterfall. In most B2B and CPG operating conversations, both phrases refer to the same underlying discipline.
Price waterfall definition
The waterfall answers one question: where each unit of revenue went between the catalog and the bank account.
The starting point is the list price, the published reference. The next bar is the invoice price, followed by on-invoice discounts. Below that is the pocket price, after off-invoice rebates, allowances, chargebacks, and other contra-revenue. The final bar is the pocket margin, after the variable cost of serving that specific transaction. The height of each drop indicates which commercial lever is capturing the largest share of dollars.
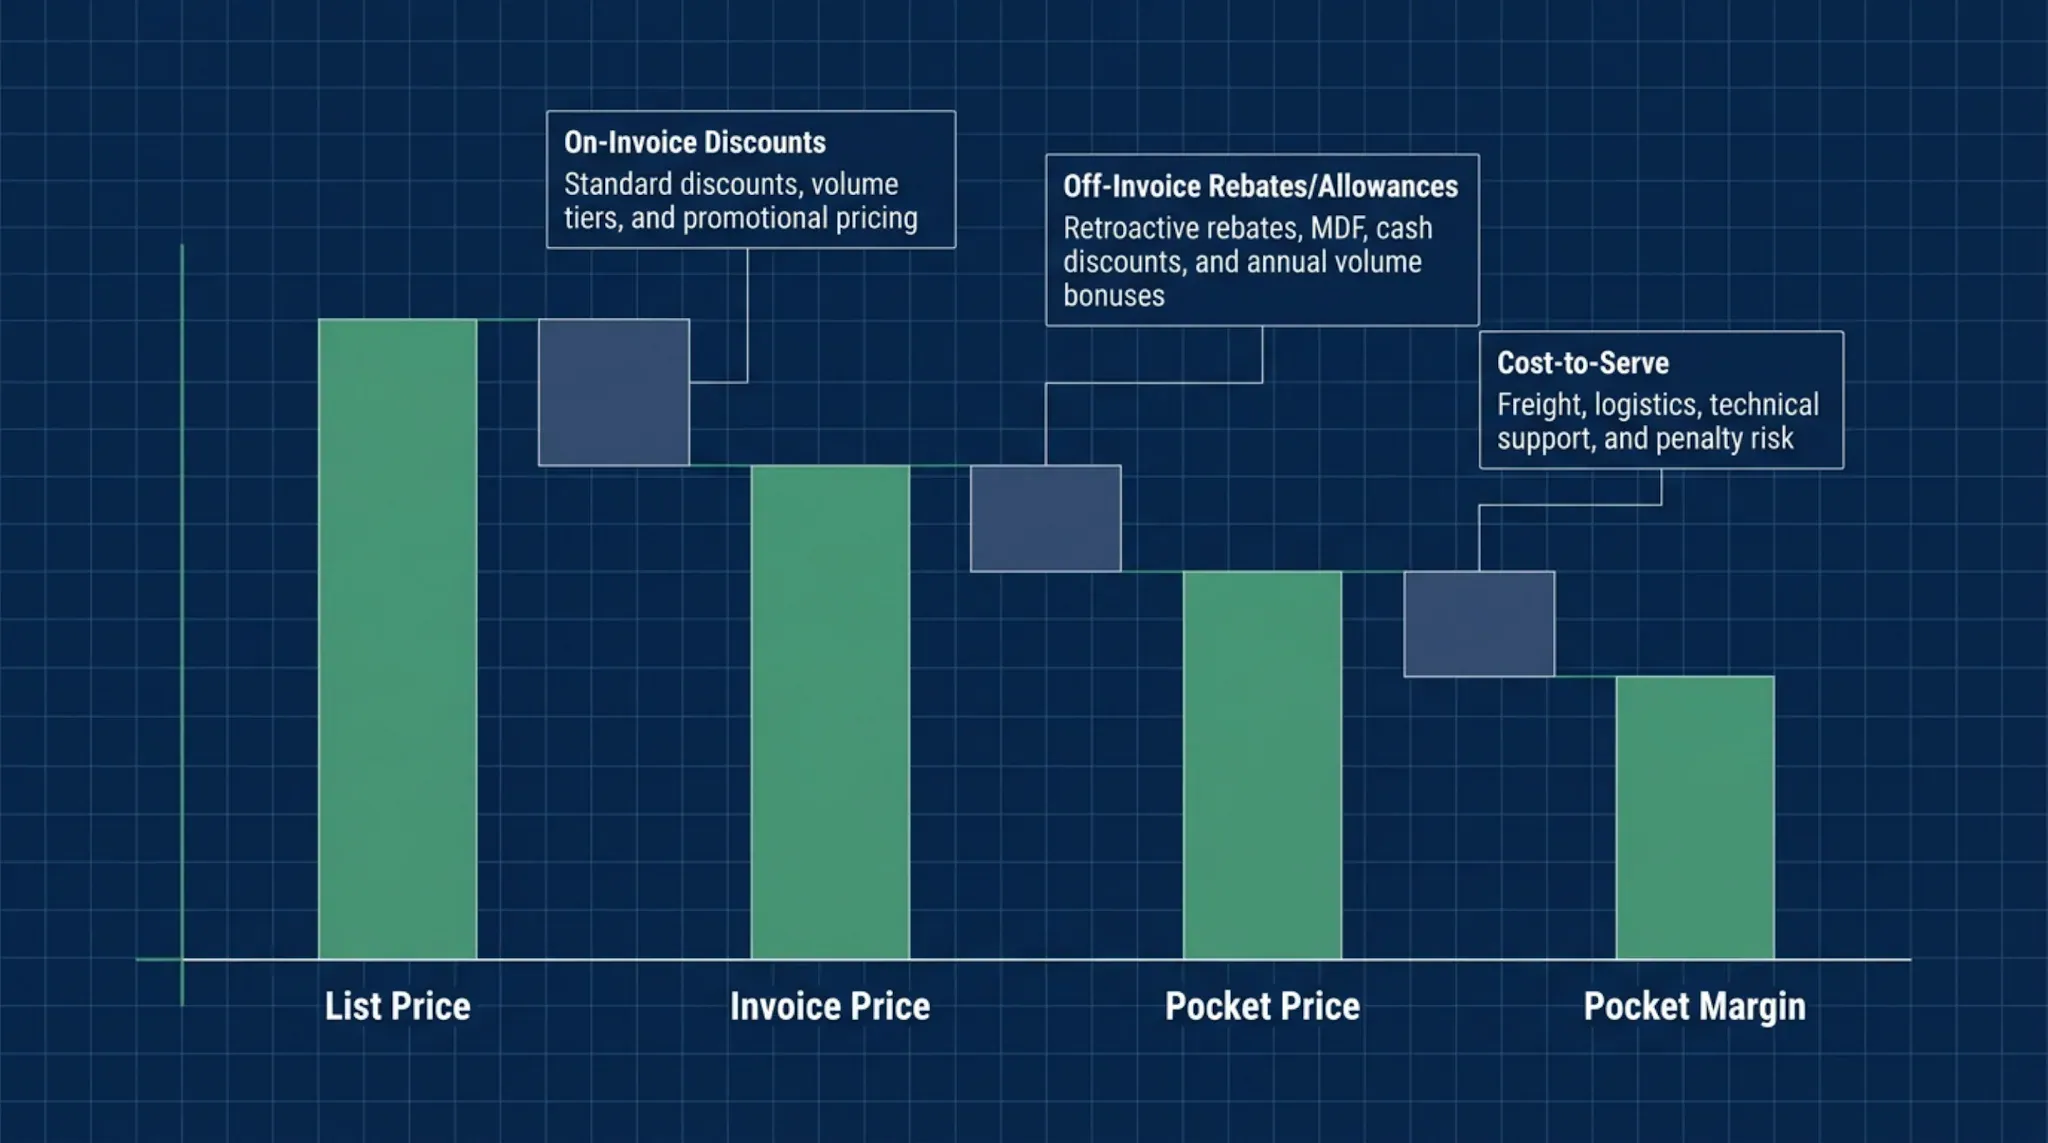
The four standard bars of a price waterfall are separated by specific deduction categories. The example in Section 6 illustrates these bars using a real B2B SaaS deal with actual figures.
List price, invoice price, pocket price, and pocket margin
Most commercial reviews focus excessively on list and invoice prices. List price reflects published intent, while invoice price shows what the customer is billed. Pocket price reveals what remains after off-quote programs and accruals. Pocket margin indicates whether the deal is profitable after accounting for cost-to-serve.
This distinction is important. A discount report may appear favorable even as pocket margin declines.
How the price waterfall differs from a simple discount report
A discount report displays on-invoice discount percentages by SKU, account, representative, or segment. In contrast, a price waterfall presents all economic concessions, including discounts, rebates, allowances, freight, payment terms, special pricing, marketing funds, chargebacks, free services, and support costs, in a single view.
This is the key difference between discount management and margin governance. Discount management highlights visible concessions, while margin governance reveals the complete deal economics.
Price margin waterfall vs. price waterfall
Refer to “price waterfall” as the standard term. Use “price margin waterfall” only when the analysis includes pocket margin by subtracting cost-to-serve from pocket price.
This distinction helps analytics teams define the model’s granularity. For pocket price outputs, accurate contra-revenue attribution is required. For pocket margin, variable cost-to-serve must also be available at the account, SKU, channel, or deal level.
Why Price Waterfall Analysis Matters
A revenue-focused pricing review may indicate the business is on track. However, a price waterfall analysis can reveal deeper issues such as increased rebate depth, more exception approvals, extended payment terms, and growth in lower-realization accounts.
Both perspectives may be accurate, but only the waterfall analysis confirms whether the business is actually realizing booked revenue. or: Revology Analytics, Pricing Still Packs a Punch (June 2025): 1% improvement in price realization → 6–7% operating-profit lift (10–11% in ex-regulated industries).
The price waterfall determines whether that 1% improvement is retained or lost.
Where margin leakage hides across discounts, rebates, and concessions
Margin leakage seldom begins with the main discount. It typically accumulates across five operational gaps.
Off-invoice complexity keeps trade spend, rebates, scan-downs, MDF, and chargebacks away from the quote screen. Sales-incentive misalignment rewards volume or invoice price, while the deal gives back margin through backend concessions. Exception accumulation turns one-off approvals into a standing practice because there is no reset cadence. Mix shift sends growth toward accounts, SKUs, or channels with weaker realization. Fragmented systems keep ERP, CRM, CPQ, contracts, rebate platforms, and billing from being consolidated into a single account-level view.
None of these is unusual. Together, they explain why the invoice can look governed while the pocket price drifts.

The five drivers rarely appear alone. Off-invoice complexity and sales-incentive misalignment usually surface first; exception accumulation, mix shift, and system fragmentation typically appear together once a business scales past a single channel or product line.
Why revenue growth can mask declining realized price
We have seen this pattern across industries. In a mid-market beverage engagement, one forward-looking scenario produced +2.6% volume, –12.8% net revenue, and –48.6% net profit because the trade investment required to drive volume overran the economics. In an anonymized global pharmaceutical engagement, gross-to-net leakage reached 62.5% before the team standardized the waterfall, rebuilt the Discount Matrix, and tightened Delegation of Authority gates for freight. This presents a challenge for CFOs: top-line growth may not improve operating profit if the realization gap widens faster than volume increases.r than volume grows.
How better visibility improves pricing governance
A visible waterfall changes the room. Sales can see which concessions are being used to save deals. Finance can see which accruals are moving after close. Pricing can see which guardrails are being bypassed. Analytics can show whether the leakage is concentrated in a product family, channel program, customer segment, or rep pattern.
The first published waterfall often does more than a policy memo because it gives the leadership team a single shared version of the economics.
The 7-Step Price Waterfall Framework
We build waterfalls in seven steps because that sequence mirrors how work unfolds within a commercial organization. Build the model before scoping the segments, and you end up with a chart nobody trusts. Quantify leakage before mapping the deduction stack, and you miss the concessions that matter.

Steps 1-3 build the model. Steps 4-5 quantify and segment the leakage. Steps 6-7: install the governance that keeps the program from sliding back. Each phase has a different owner mix in our engagements: analytics leads through step 3, pricing through step 5, and the deal desk through step 7.
Step 1: Define scope by product, segment, and channel
Pick the slice where Select a segment where the initial waterfall analysis will be credible. This could be a product family, region, channel, national account group, or high-leakage SKU set. Maintaining scope discipline is more important than scope size, pricing, sales, finance, and analytics; as a baseline, they can be challenged and improved. A portfolio-wide first pass usually creates a reconciliation argument.
Step 2: Map every price deduction and concession (on-invoice and off-invoice)
Walk through the deal lifecycle from quote to cash collection, and list every place where value leaves the company. Include volume discounts, rebates, freight allowances, payment-term extensions, scan-down credits, MDF, bill-backs, chargebacks, return reserves, free goods, implementation credits, bundled services, and premium support.
In B2B deal desk work, we govern four concession categories as a single package: price, cash, services, and term. Sellers will often move to the least-governed lever. The approval workflow has to see the whole package.
Step 3: Build the waterfall from the list to the pocket price
Render the bars in the order the deductions hit the economics. Start at the list price. Subtract on-invoice deductions to land at invoice price. Subtract off-invoice contra-revenue to land at pocket price. Subtract cost-to-serve to land at pocket margin when the margin view is in scope.
Use dollars per unit whenever possible. Percentages are useful for comparisons, but dollar values drive prioritization. Ensure all bars use the same base period to make changes over time interpretable.
Step 4: Quantify leakage by component
Conduct the waterfall analysis at the deal or transaction-line level before summarizing. Relying on segment averages can obscure important details.
In a global B2B technology engagement, portfolio-level pocket price looked acceptable while one flagship SKU carried a –40% net pricing impact year over year. The issue was not one discount. It was an uncontrolled list-price reduction stacked with backend channel funding on the same product.
Averages would have concealed the issue; analyzing dispersion revealed it.
Step 5: Segment leakage by account, product, channel, and rep
Once the model reconciles, cut it several ways. Which accounts consume the largest off-invoice funding? Which SKUs have the widest discount dispersion? Which reps submit the highest below-floor exception rate? Which channel programs accrue rebates above policy? Which renewal cohorts are protected by caps that no one modeled?
Prioritize two or three leakage pockets by dollars and controllability. The operating question is not “Where is every leak?” It is “Where can we recover margin without breaking a good customer relationship?”
Step 6: Tighten guardrails and approval workflows.
Replace ad-hoc approvals with three reference points per segment: target price, guidance floor, and escalation gate. Below-floor pricing can still be approved, but it should require evidence: a competitor quote, procurement language, a strategic-account rationale, term length, or a volume commitment.
Pair every exception with a give-get. If the business offers price, the customer offers longer-term, faster payment, higher minimums, broader scope, or a committed expansion path. CPQ should enforce the guidance floor mechanically. Manual workarounds should be tracked, because the workaround pattern is where coaching usually starts.
Step 7: Establish a monthly review and KPI cadence
A waterfall is a monthly operating rhythm. Define the standing report, the review owner, the escalation path, and the quarterly reset rules for off-invoice programs that move beyond policy.
Without cadence, the second waterfall gets worse. Not because the math changed. Because the business learned that the first review had no consequence.
Data Inputs and Model Build
The waterfall lives or dies on data quality. Most weak implementations fail here, before the governance conversation starts.
ERP, CRM, CPQ, contracts, rebate, and billing data sources
Six systems usually have to be joined. ERP provides invoice lines. CRM provides account and opportunity context. CPQ provides quote history, approved discount, and exception log. Contracts provide term language and renewal caps. Rebate systems provide accrual rates and payment timing. Billing provides cash collected and adjustments.
Each system has its own grain, its own version of “price,” and its own update cadence. The first technical decision is the grain of the waterfall: transaction line, account-month, SKU-month, deal, or contract. Choose the grain based on the decision the model needs to support.
Required fields and waterfall calculation logic (price waterfall formula)
The arithmetic is simple. The data engineering is not.
Pocket Price (per unit) = List Price
− Σ on-invoice discounts
− Σ off-invoice rebates and allowances
− Σ services, freight, and cash concessions
− Σ retrospective adjustments and accruals
For pocket margin, subtract the per-unit variable cost of serving that transaction.
The practical build requires more than the price waterfall formula. You need customer identifiers that survive across ERP and CRM, SKU normalization, contract-to-account mapping, rebate accrual timing, invoice adjustments, FX rules, and a way to handle late claims without restating every dashboard after close.
See how your pricing compares
Our 2025 report looks at how more than 150 business leaders handle pricing and promotions. See what the best companies do differently, and where most fall short.
Excel, BI, and CPQ implementation options
For a one-segment diagnostic, a controlled Excel model is often the fastest path to a credible first chart. For a monthly management cadence, BI tools handle segmentation, dispersion, drilldowns, and executive review better. For enforcement at the point of sale, CPQ should include floor logic and exception capture within the quote workflow.
Most companies end up with a hybrid: CPQ for guardrails, BI for review, and Excel for deep-dive analysis. Tools are necessary. Governance makes them useful.
Data quality checks and normalization rules
Run three checks before the first executive readout.
Coverage: Does the joined dataset reconcile to the GL or management P&L within an agreed variance? Currency: Are FX-translated revenues, rebates, and costs consistent across periods? Period alignment: Do off-invoice accruals belong to the month where the sale occurred, or are late claims shifting the waterfall after close?
The CFO will test the chart against the ledger. Build that reconciliation before the meeting.
KPIs to Track in a Price Waterfall
Price waterfall analysis should track three families of KPIs. No single metric can carry the program.
Realized price, pocket price, and pocket margin
Realized price and pocket price are often used interchangeably in B2B reporting: both refer to price after contra-revenue is netted out. Pocket margin extends the view by subtracting cost-to-serve. Together, these metrics show whether pricing actions are improving unit economics or only changing the invoice.
Anchor the economics here: Revology Analytics, Pricing Still Packs a Punch (June 2025): 1% improvement in price realization → 6–7% operating-profit lift (10–11% in ex-regulated industries).
Discount rate, rebate rate, and exception frequency
Track on-invoice discount as a percentage of the list. Track off-invoice rebate and allowance rate as a percentage of gross revenue. Then track exception frequency: the share of deals approved below the guidance floor in a given period.
Exception frequency is often the leading indicator. It tends to move before the pocket price shows up in the monthly report.
Leakage by segment, product, channel, and rep
The mean is a trap. Dispersion is the metric that tells the operator where to act.
Plot pocket price by account. Plot exception frequency by rep. Plot the rebate rate by channel. Plot pocket margin by SKU family. The outliers, not the averages, tell you where governance has to tighten.
Worked Example: Price Waterfall for a B2B SaaS Offer
This price waterfall example shows why a visible discount percentage can understate the deal’s actual economics.
Scenario setup and standard commercial terms
A mid-market SaaS vendor sells an enterprise tier at $120 per user per month (PUPM). Standard terms include annual prepay, a 12-month commitment, an 8% list-price escalator at renewal, and a published volume tier that grants 10% off for volumes above 500 users.
Sales engages a 1,200-user prospect.
Applying discounts, credits, and non-standard concessions
The negotiated deal includes a 15% volume discount on the invoice, which is 5 points deeper than the published tier. It also includes a one-time implementation credit equivalent to $7.50 PUPM when amortized across the first contract year, net-60 payment terms instead of annual prepay, with a cash-cost proxy of $1.50 PUPM, and bundled premium support with a variable support cost of $6 PUPM.
The deal also includes a 4% renewal cap, rather than the standard 8%. That term matters, but it should be flagged in the renewal-risk view rather than forced into the Year 1 pocket-price bars. Mixing Year 1 economics and Year 2 renewal exposure makes a worked example hard to defend.
Interpreting the final pocket price and margin impact
The Year 1 waterfall renders as: $120 list → $102 invoice (after 15% volume discount) → $93 pocket price (after implementation credit and cash-term proxy) → $87 pocket margin (after variable support cost).

Nearly half of the margin leakage on this deal happens entirely off the invoice. The visible 15% discount accounts for $259,200 of the $475,200 gap. The remaining $216,000 sits below the invoice: implementation credits, payment-term concessions, and cost-to-serve. The waterfall surfaces the trade. The discount report does not.
The visible discount is 15%. The realized price concession to the pocket price is 22.5%. The drop to pocket margin is 27.5%.
At 1,200 users for 12 months, the list-to-pocket-margin gap is $475,200. The on-invoice discount accounts for $259,200 of that gap. The remaining $216,000 is split between the invoice: $129,600 in off-invoice concessions to pocket price, and $86,400 in cost-to-serve to pocket margin.
Data point: In this deal, the invoice shows a 15% discount. The waterfall shows a 27.5% drop from list price to pocket margin. The extra $216,000 below the invoice is the difference between a clean discount report and a true pocket-margin view.
Common Pitfalls and Misreads
These are the failure modes we see most often in waterfall programs.
Treating all discounts as equal
A 15% on-invoice discount is not the same as a 5% invoice discount paired with a 10% rebate. Both may produce similar economics in the period. They behave differently in governance.
The invoice discount is visible to the customer and can become a reference point in the next negotiation. The rebate is often retroactive, tied to volume or channel activity, and harder to unwind once the customer has built it into expected economics. Treating those concessions as interchangeable is how discount management loses control.
Ignoring non-price concessions and service costs
Payment terms, free services, premium support, renewal caps, freight allowances, and implementation credits are commercial concessions even when the price field does not change.
A deal desk that governs only discount percentage will watch concessions migrate to less visible levers. The discount report will stay clean. Pocket margin will not.
Using averages that hide account-level leakage
In a global B2B technology engagement, channel contra-revenue averaged 10–20% of invoices across the portfolio, while the largest e-commerce channel ran 14–16%. That same channel accounted for 45% of historical promotions with 0–20% ROI.
The average looked manageable. The channel-level cut showed where the margin was being spent with very little return.
Scan-back rates that stack without a reset cadence
In a mid-market beverage engagement, a trade-funding audit found retailer scan-back claims accumulating to 149%, 197%, 323%, and up to 546% over the approved per-case budget on individual contract lines.
The problem was not a single bad promotion. The problem was no reset cadence. Legacy rates kept compounding, and the approval file no longer matched the claims hitting the P&L.
Sales incentives that measure invoice price
In the same B2B technology engagement, the internal gross-revenue KPI was calculated as point-of-sale units multiplied by invoice price, ignoring the 10–20% backend contra-revenue required to secure the sale.
That created the wrong signal. Reps were rewarded for volume that looked good on invoice price, while Average Unit Price (AUP) after backend funding reflected the real economics. The fix is a Revenue and Profit Decomposition view that separates ASP from AUP and shows the dollar impact of every lever below.
Implementation Roadmap and Operating Cadence
Waterfall programs work when they become an operating rhythm, not a one-time analytics deliverable. The first 90 days should create the baseline, prove the use case, and install decision rights.

A defensible first chart by day 30 is the practical goal, not a perfect chart. Targeted actions on two or three leakage pockets in days 31-60 prove the program earns its keep. Governance, dashboards, and CPQ floor-logic in days 61-90 keep the gains from slipping back.
First 30 days: baseline and data mapping
Pick the pilot segment. Map the source systems. Define the grain. Build the joins. Reconcile pocket price to the GL or management P&L. Document every deduction and every approval path.
Aim for a defensible first chart by day 30. It does not need to be perfect. It does need to be accepted by pricing, sales, finance, and analytics as the baseline.
Days 31–60: analysis, segmentation, and pilot actions
Segment the dispersion and identify the two or three leakage pockets with the largest recoverable dollars. Convert each into an action: renegotiate a rebate row, tighten a guidance floor, pause a promo cluster, reset a scan-back rate, or require a give-get for a repeat exception category.
In an anonymized global pharmaceutical engagement, a standardized waterfall, paired with a Discount Matrix, a Delegation of Authority redesign, and freight/rebate approval gates, produced a ~5% net price realization lift in Year 1. The actions were targeted. That is why they worked.
Days 61–90: governance, dashboards, and rollout
Wire the monthly review into the existing pricing or commercial operating cadence. Build the dispersion dashboard. Move floor-logic into CPQ where feasible. Set quarterly resets for off-invoice rates that exceed policy.
Define decision rights clearly: pricing owns the floor, sales owns the exception rationale, finance owns accrual integrity, analytics owns data reconciliation, and the deal desk arbitrates the full concession package.
Monthly review cadence and decision rights across pricing, sales, and finance
A 60-minute monthly review should cover the waterfall delta, the largest exception requests, material off-invoice rate movements, and contracts coming up for renewal. The output should be a short action log with owners and due dates. A slide deck is not the deliverable. A changed decision is.
For teams operationalizing this rhythm, see our pricing and revenue growth management capability, which underpins the cadence.
FAQ About Price Waterfall
What is the pricing waterfall?
The pricing waterfall, more commonly called the price waterfall, is the visual decomposition of how list price translates into the realized pocket price after on-invoice discounts, off-invoice rebates, allowances, freight, service concessions, and cost-to-serve. It is the operating artifact used to find margin leakage.
What is the McKinsey price waterfall?
Michael V. Marn and Robert L. Rosiello of McKinsey popularized the price waterfall framework in their 1992 Harvard Business Review article “Managing Price, Gaining Profit.” Their work distinguished the pocket price from the invoice price and showed why small improvements in realized price can produce outsized profit gains. The framework has been refined since, but the core idea remains the same: manage the full deduction stack, not only the invoice discount.
What is a typical waterfall payment?
Outside pricing, “waterfall payment” usually refers to a financing structure in which cash distributions follow a defined priority order among lenders, sponsors, and equity holders. That meaning is separate from the pricing waterfall. The pricing waterfall is about price deductions and margin leakage, not payment priority.
What is the price margin waterfall?
A price margin waterfall is a price waterfall that extends one bar further by subtracting cost-to-serve from pocket price to calculate pocket margin. Use it when the business needs to understand deal economics after fulfillment cost, service cost, freight, or support burden.
What is a waterfall in simple terms?
In pricing, a waterfall is a chart that starts with the price you publish and subtracts each deduction until it reaches the price or margin you actually keep. Each bar shows one category of deduction, sized by dollars per unit or dollars per deal.
What are the 3 C’s of pricing?
The 3 C’s of pricing are customer, competition, and cost. Customer covers willingness to pay and value perception. Competition covers alternatives and substitution. Cost sets the floor below which pricing needs a deliberate strategic reason. A price waterfall translates those inputs into a governed pricing strategy by showing what the business actually realizes after concessions.
When should a company refresh its price waterfall?
Refresh the analysis monthly and reset thresholds, off-invoice rates, and exception categories quarterly. A full rebuild is usually warranted every 18 to 24 months, or when a major event changes the deduction stack: M&A, channel redesign, major repricing, rebate redesign, CPQ implementation, or a new sales-comp plan.
Diagnostic Checklist and Next Steps
5-question self-assessment for pricing and RGM leaders
1. Can your team produce last quarter’s pocket price by account, product, and channel from an agreed data join, without rebuilding the file manually each time?
2. In the current sales-comp plan, is the measured price field invoice price, gross revenue, pocket price, AUP, or pocket margin?
3. Do off-invoice rebates, scan-back rates, freight allowances, and distributor programs have a named owner, policy benchmark, and next reset date?
4. For every below-floor exception, can you see the category, evidence submitted, approver, approval date, and customer “get” tied to the concession?
5. Does CPQ enforce the guidance floor on every quote, and does the approval ID flow through to order entry and the monthly exception report?
If two or more answers are “no” or “we need to check,” the next pricing review will likely yield a clean discount report and a margin question that nobody can answer fast enough.
Guidance for resource-constrained teams
You do not need a CPQ overhaul to start. Build a defensible Excel waterfall for one segment. Reconcile it to finance. Run a monthly 60-minute review with three owners: pricing, sales, and finance. Track the action log.
When a customer threatens to walk, do not turn the next concession into an ungoverned precedent. Our piece on helping the customer is walking – don’t drop the price covers that negotiation instinct. The pricing sensitivity guide covers the demand-side question. The waterfall covers the economic one: what did the business keep?
Where Revology can help
We build price waterfall programs end to end: data integration, governance design, CPQ guardrail configuration, KPI dashboards, and the monthly operating rhythm that keeps the program from sliding back. Our cross-industry experience spans pharmaceuticals, beverage and CPG, B2B technology, industrial distribution, and capital equipment.
Book a pricing & revenue management diagnostic call. We will spend 45 minutes walking your team through where the leakage most likely sits in your current waterfall and what a 30-60-90 plan would look like for your business.
Want a second opinion on your pricing?
Tell us what’s going on with your pricing. One of our partners will get back to you the same day or the next.






