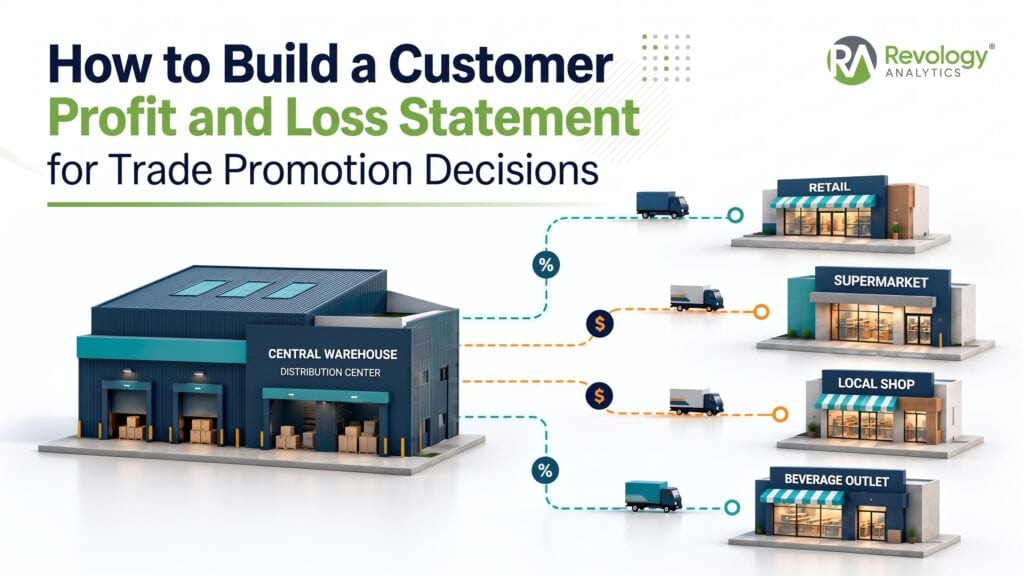
Understand what each account earns after trade, freight, and service costs, then use the numbers to shape your next customer plan.
A beverage client came into an account review with two different profit figures for the same customer. Before discussing next year’s plan, the commercial leader asked the account owner to check the coupons, freight allowances, and other arrangements behind the numbers. The immediate question was basic: what are we earning from this account today?
A customer P&L should give Finance and the commercial team a shared answer. It connects account revenue to the discounts, trade investment, product costs, and service costs needed to earn it. That makes it a useful starting point for trade promotion analysis and account planning.
The math involved is often not the most challenging aspect. Sometimes, a fee may not be included in the promotion system, or a distributor may serve multiple retail accounts. Additionally, a known cost can become unaccounted for if no one attributes it to a specific product. These factors can impact which customers appear more attractive and the terms under which you decide to renew.
To get started, focus on one account and one quarter. The eight steps outlined below will guide you in building the view, reconciling it, and using it alongside promotion ROI.
Table of Contents
What a customer P&L tells you
A customer P&L shows revenue and costs for a defined customer, period, product scope, and route to market. It ends at a clearly defined profit measure and reconciles to Finance, with estimates, allocations, and unresolved amounts visible.
It answers a key commercial question: after the support and service this customer requires, what does the account contribute?
Define the financial basis first
There is no universal customer P&L layout. One public CPG filing deducts estimated promotional costs from sales and includes shipping and handling in cost of sales. Another company’s policy accrues annual customer incentives as products are delivered and places distribution costs in selling, general, and administrative expenses. Your management view needs to reconcile to your own policies.
Within a broader revenue growth management capability, the customer P&L supplies the account economics. Our CPG RGM analytics navigator shows how it fits alongside other commercial analyses.
Keep promotion ROI alongside account profit
An event can look attractive on per-unit funding and look different once you include the display fee. You need to check both the event’s full cost and the wider cost of doing business with the account.
Those views answer different questions:
• Customer P&L: What did the manufacturer earn from this account during the period?
• Promotion analysis: What demand and profit did an event add against a defensible no-promotion baseline?
• Retailer and distributor economics: What does each partner earn under its own prices, funding, and service costs?
• Forward account plan: What might happen under new terms and demand assumptions?
A period P&L cannot tell you what would have sold without a promotion. This is where you need to separate baseline sales (that would have occurred even in the absence of promotions) from incremental sales, either through modeling or by just using your syndicated data. Research by van Heerde, Leeflang, and Wittink distinguishes promotional sales changes into cross-brand, cross-period, and category effects. Before labeling the sales increase as incremental demand, it is essential to understand its origin. Our promotional effectiveness guide addresses this issue.
What belongs in a customer P&L
Check the revenue starting point before subtracting anything. If the invoice amount already reflects an off-invoice discount, deducting it again understates profit. The same applies to freight already included in product cost.
A structure you can reconcile
Here’s an example P&L from a fictitious CPG, starting from Gross Revenue, all the way to Customer Profit.

Figure 1. Customer contribution shows earnings after account costs. Customer profit also includes the account’s share of common commercial costs.
Start with gross revenue before the listed deductions. Subtract off-invoice discounts, promotional discounts and allowances classified as contra-revenue, and returns or other mapped deductions to reach net revenue. Document the source fields, signs, reversals, and gross-versus-net basis.
Subtract product cost of goods sold, or COGS, from net revenue to get product gross profit. Then deduct customer investment, outbound freight, and service costs to get customer contribution. This is what the account contributes toward shared commercial costs and profit.
Deduct the account’s share of common commercial costs to reach customer profit. This gives Finance and the KAM a way to distinguish costs tied to serving the account from shared support costs. Some companies include customer investment in gross profit; this example shows it separately. Agree on the definitions with Finance and record each cost in one place.
Make comparisons on the same basis
Every margin percentage needs a named profit measure and revenue denominator. Calculate portfolio margins from aggregate dollars on the same population, rather than averaging account percentages. A trade rate also needs its funding scope and sales denominator.
For each cost, answer three key questions: Whose economics are involved? Which financial category does the cost belong to? How is the cost assigned? There are three assignment methods: direct match, allocation, and unresolved item. These methods do not determine whether the cost is classified under revenue deductions, cost of goods sold (COGS), or another expense category.
Build the customer P&L in eight steps
Establish the scope and source records
Step 1. Define the account and the decision. Agree on the commercial account hierarchy, legal entity, currency, reporting period, product scope, and route to market. Keep actuals, forecasts, and plans in separate versions.
For indirect distribution, retain both the invoiced distributor and the intended retail reporting account. If you cannot support the downstream allocation, use distributor-level economics or label the retailer view as an estimate. Point-of-sale revenue is not the manufacturer’s invoice revenue.
Step 2. Agree on the definitions with Finance. Record each output line’s source, sign, scope, and treatment of reversals. Bring the KAM (or key account manager) into the discussion before assuming the transaction file describes every agreement.
Commercial support can appear in several places: a temporary invoice-price reduction, an off-invoice discount, a rebate, an allowance, or a separate fee. A report built only from rebate claims can miss support recorded in sales adjustments. Identify the fields and classify the mechanism before deciding what to deduct.
Planning models need the same care. If a temporary invoice-price reduction is represented as scan funding to work around a workbook limitation, gross profit may be right, while the reported trade rate is distorted. Document that difference before comparing accounts or interpreting a change in spending.
Step 3. Match customer and product records. Map source IDs to stable reporting IDs. Keep bill-to, ship-to, sold-to, parent account, distributor, and retailer identities distinct, with effective dates for changes.
The party receiving a payment may not be the retailer whose business generated the cost. A model can reconcile in total while assigning costs to the wrong customer. Normalize cases, packs, equivalent units, and currencies too, then report how much of the revenue and cost data is mapped and how much remains unresolved.
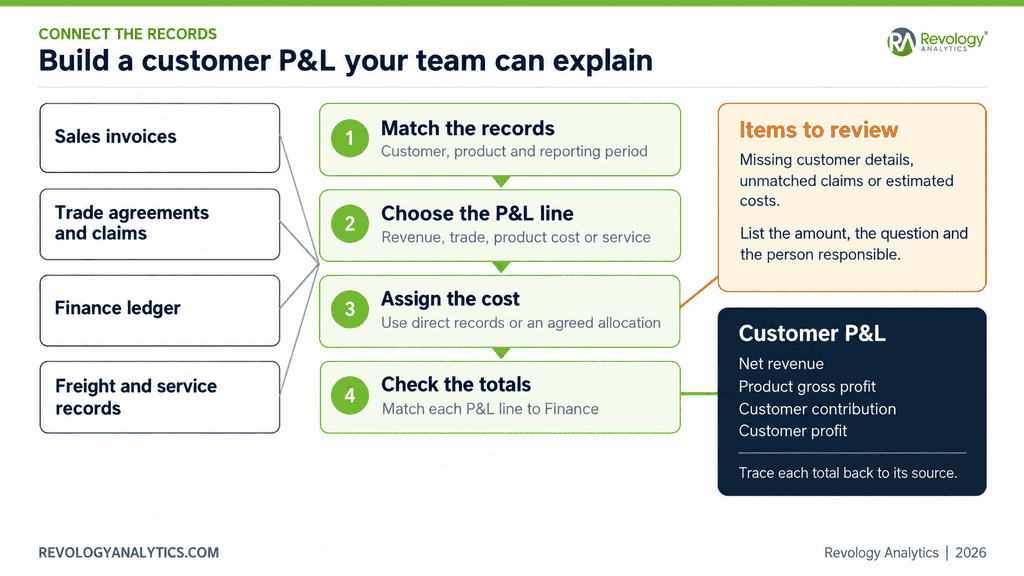
Figure 2. Connect sales, trade, and service records, assign them to the account, and check each P&L line against Finance. Give open questions an owner.
Follow the obligation and retain the cost
Step 4. Connect agreements, claims, and settlements. Use a unique funding agreement or obligation key where possible. Attach the beneficiary, service period, rate or fee, eligible units or revenue, claim references, and settlements.
At the beverage client, distributor allowance invoices arrived as monthly bundles without enough retailer or promotion detail to check individual charges. Billed amounts exceeded the forecast, but the forecast covered only accounts in the planning tool. Distributor reporting coverage differed as well. Calling the whole gap overspending would have skipped the first question: were the two totals measuring the same business?
A finance leader proposed moving some support toward retailer scan funding, where the bill identifies the promotion, dates, units, and per-unit funding. That approach would also require more reconciliation work. Build the identifying details into the funding agreement so the team can explain or challenge the eventual bill.
Step 5. Assign costs using the best available evidence. Use a direct transaction or shipment match when one exists. Allocate the remaining shared costs with a documented driver and eligible account population. The AICPA and CIMA explanation of activity-based costing describes tracing resources through activities to cost objects using drivers. Choose the driver that best reflects the activity behind the cost.
A review at the same client caught a cost that the model had missed. Part of an account had moved to direct delivery, but the manufacturer still owed a per-case fee to the former distributor. The account showed no distributor allowance. Finance flagged the continuing obligation and requested a correction; a default rule for direct accounts was the suspected cause. The account summary needed to reflect the continuing obligation even though the delivery route had changed.
Broker fees need the same attention. Keep known costs at account level or in an unassigned-product row until you can justify an allocation. Missing detail should not improve reported profit.
For freight, use shipment or carrier evidence and exclude anything already in COGS. For order handling, orders, lines, or picks may explain the work better than revenue. For shared account support, state the time measure or proxy and its limits.
Reconcile and challenge the result
Step 6. Reconcile each financial line and period. Assigned customer amounts, unassigned balances, and documented scope or timing adjustments must add up to the total Finance reports for that line and period. Reconcile revenue and each major cost population separately; offsetting errors can leave the final profit looking right.
A separate food-and-beverage client ran into this while validating trade spending. Actual-only records left a shortfall against the reconciliation target. Replacing every zero-spend line with expected funding went too far in the other direction. The team prepared specific promotion records to review with Finance and check how deductions had been posted. A missing claim or a cost recorded elsewhere could explain a zero, but neither explanation had been confirmed. Filling the gap required checking the records, not choosing whichever calculation looked more plausible.
Check completeness, classification, customer assignment, and timing separately. When comparing plan with actuals, also separate rate changes from volume changes. If trade dollars fell because fewer units sold, show that volume effect before describing the change as a saving.
Step 7. Review the result with the people who run the account. The KAM validates funding commitments, annual fees, terms, and known claims. Finance validates classification and reconciliation. Logistics or operations validates service costs. If the account owner accepts the total expense but disputes its assignment, resolve that assignment rather than debating the whole P&L.
A 2024 study of customer profitability analysis, covering six units within one manufacturing division, linked its use to customer characteristics, service complexity, cost structure, and strategy. It is a case study, not a benchmark, and a useful reminder to interpret the numbers with the commercial context in view.
Step 8. Give the finding an owner and a next step. Record the proposed change, expected effect, assumptions, measurement basis, owner, and review date. Monthly reviews after close and quarterly commercial reviews are reasonable starting points. Adjust the cadence to claim timing and the decisions your team needs to make.
What two accounts can reveal
A consumer-products prospect explained why starting product margins differed across its customers. A large mass retailer was relatively efficient for that company to serve. An online retailer required freight and marketing allowances, so the business built more margin into the starting price to absorb them. The prospect wanted to understand what remained after those terms.
That conversation did not establish which account ultimately contributed more. It did identify the comparison that mattered: follow both accounts through the same revenue-to-contribution calculation.
An illustrative quarterly comparison
All numbers below are invented for teaching. Assume one manufacturer, one quarter, US dollars, and comparable case units. Product COGS excludes the freight and service costs shown separately. For this example, fixed customer investment sits below product gross profit, all relevant period costs are included, and the shared-cost pool excludes costs already assigned.
The example follows three subtotals: product gross profit, customer contribution, and customer profit. Percentages use net revenue; parentheses indicate costs deducted.
| Measure | Customer A | Customer B |
|---|---|---|
| Cases | 50,000 | 40,000 |
| Gross revenue | $500,000 | $400,000 |
| Off-invoice discounts | ($25,000) | ($12,000) |
| Promotional allowances | ($50,000) | ($32,000) |
| Returns and other deductions | ($5,000) | ($4,000) |
| Net revenue | $420,000 | $352,000 |
| Product COGS | ($275,000) | ($220,000) |
| Product gross profit | $145,000 | $132,000 |
| Customer investment | ($10,000) | ($6,000) |
| Outbound freight | ($32,500) | ($12,000) |
| Service costs | ($15,000) | ($6,000) |
| Customer contribution | $87,500 | $108,000 |
| Customer contribution % | About 21% | About 31% |
| Contribution per case | $1.75 | $2.70 |
| Shared commercial costs | ($20,000) | ($16,000) |
| Customer profit | $67,500 | $92,000 |
| Customer profit % | About 16% | About 26% |
Customer A generates more revenue and product gross profit, but B earns $20,500 more in customer contribution. Review the differences in funding, freight, and service before deciding which account deserves more investment.
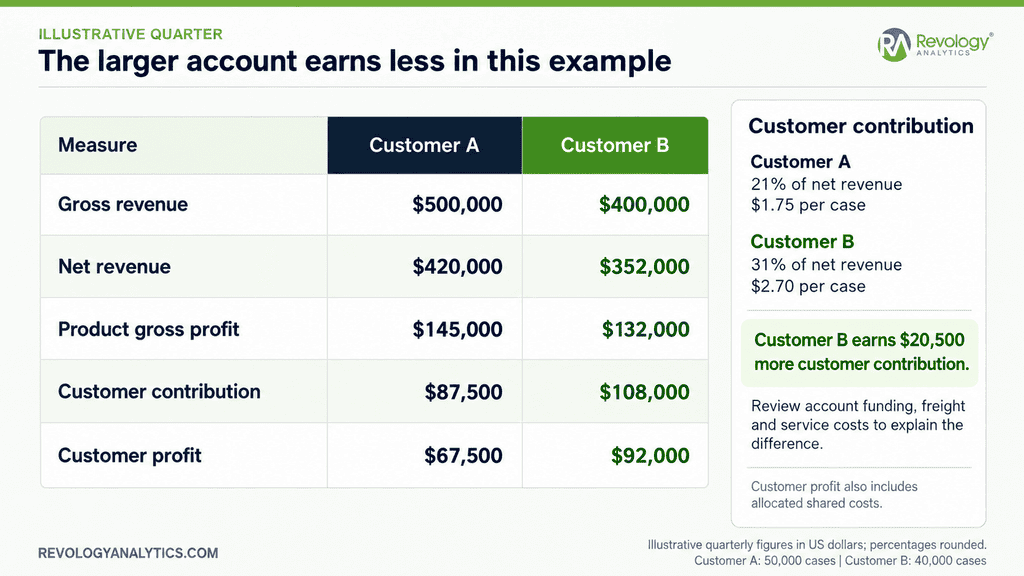
Figure 3. Customer B earns more after account costs, despite generating less revenue. All values are illustrative.
Before changing A’s terms or its role in the portfolio, consider contract obligations, demand, product mix, and strategic value. Identify which costs would actually change under the proposed decision.
A better comparison does not create margin
The prospect also described prices negotiated separately by customer and SKU. We discussed a common list-price structure within each channel, with customer terms shown explicitly below it.
If net selling prices, quantities, and obligations stay unchanged, that exercise changes the presentation rather than profit. Reported trade may rise if more support becomes explicit. A common starting basis can make comparisons easier, but you still need matched products, periods, and cost scope. Any claimed margin improvement needs a separate change in the underlying economics.
Track trade expense and settlement
Trade expense and settlement answer two different questions: how much does the funding cost, and how much has been paid or deducted? Track both against the same agreement.
Follow the cost from estimate to final claim
Suppose you budget $48,000 for a quarter’s funding and record an estimated cost of $50,000. Claims totaling $32,000 are settled through payments or deductions, leaving $18,000 outstanding. The estimated cost is still $50,000; settlement changes how much is left to pay.
When the final claims establish a cost of $53,000, record a $3,000 adjustment under Finance’s policy. If settlements remain at $32,000, the outstanding balance becomes $21,000. The final cost is $5,000 over the original budget. The figure below separates the cost calculation from the settlement balance.
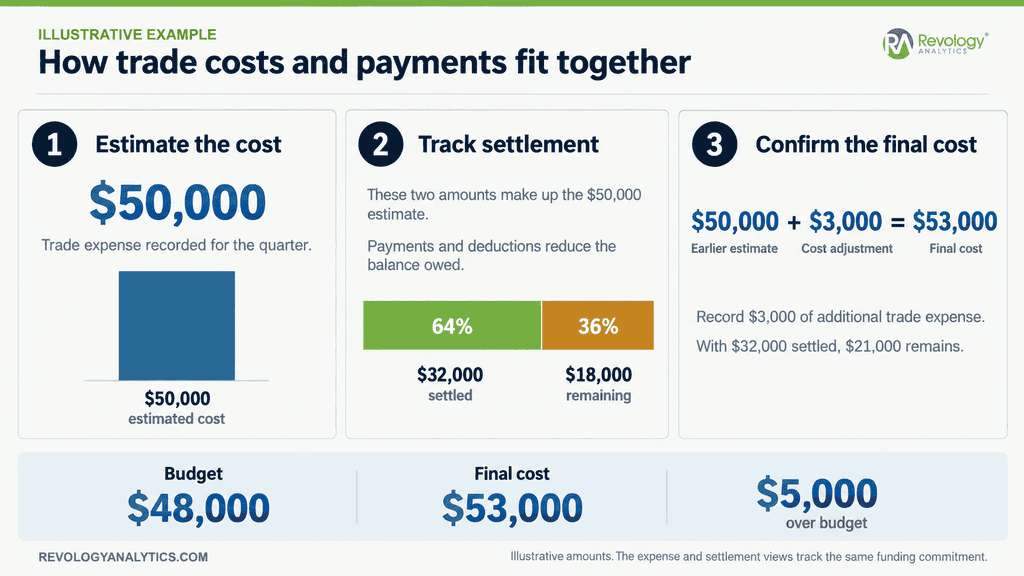
Figure 4. The estimated cost is $50,000, split between $32,000 settled and $18,000 outstanding. Final claims add $3,000 to the cost and to the balance still owed.
Label each field as a total cost, a cost adjustment, an amount settled, or a remaining balance. Where claims are incomplete, use a supported estimate and replace it as the evidence improves. That lets the team explain both the quarter’s expense and the amount still owed.
Where an individual promotion fits
Use a separate illustrative event, unrelated to the two-account example. It sells 12,000 cases against an estimated no-promotion baseline of 8,000. Each incremental case earns $3 of gross profit at the regular net selling price, before event funding. The event adds $0.60 of funding on every eligible promoted case, including baseline cases, plus a $2,000 fee. Both funding amounts are additional to the no-promotion comparison. Assume no additional service costs, cannibalization, or purchases pulled forward from a later period.
Calculate the return on a stated cost scope
1. Incremental volume: 12,000 minus 8,000 equals 4,000 cases, or 50% lift.
2. Incremental gross profit before funding: 4,000 multiplied by $3 equals $12,000.
3. Included trade investment: 12,000 multiplied by $0.60, plus the $2,000 fee, equals $9,200.
4. Promo ROI: $12,000 divided by $9,200 equals 1.30x. Incremental profit after those costs is $2,800.
Here, promo ROI is a gross return ratio: incremental gross profit before the included event trade costs divided by those costs. A 1.0x ratio breaks even on that scope. If your company uses net ROI, the same example is $2,800 divided by $9,200, or about 30%. Agree on the convention before comparing results.
The customer P&L already includes the event’s actual or accrued revenue and funding in the period totals. Adding the event’s incremental profit to account profit counts the underlying economics again. Deducting the same funding again creates the opposite error.
Annual account fees still belong in the customer P&L. Include them in an event return only with a stated economic relationship or a clearly labeled allocation. An attractive event does not settle the question of account profitability.
Use the customer P&L in the next account plan
The finding should lead to a specific commercial question. If freight is driving weak contribution, examine delivery frequency, order size, and freight recovery. If events earn their funding but the account contributes little, review annual fees, recurring support, and service requirements. If the result changes sharply with the allocation rule, improve the driver or show the sensitivity before changing terms.
Test the assumptions behind the proposed change
Test whether the promotional calendar can support the volume forecast. Use high- and low-case scenarios for volume and profit when the response is uncertain. Reducing funding while keeping volume unchanged is an assumption that needs evidence.
Partner economics need their own review. A funding change can improve distributor profit while reducing retailer profit. Review account-specific mix, allowances, margin percentage, and profit per case before applying a uniform change. Keep those scenarios separate from realized results.
Trade promotion optimization uses these account and event views to inform the next funding decision. Give each proposed action an owner and a review date.
A practical template structure
Organize the working file into eight sections: definitions, customer mapping, financial classification, trade obligations, cost attribution, customer P&L, reconciliation, and account actions. Together they should retain source IDs, effective dates, units, gross-versus-net flags, agreements, claims, settlements, allocation drivers, and data-quality status.
Use this customer P&L template structure as a starting point for your own working file. Our price waterfall guide covers the list-to-pocket deductions that feed the account view. Working through one account will expose the source and mapping gaps to resolve before repeating the process across the portfolio.
Common questions
What is a customer profit and loss statement in CPG?
It shows the manufacturer’s revenue and costs for a defined customer, period, and product scope. It ends at a named profit measure and reconciles to Finance, with estimates, allocations, and unresolved items visible.
Which costs should it include?
Include the relevant revenue deductions, product costs, customer investment, and service costs under your company’s policy, each counted once. Name the final measure so readers know its cost scope.
Is a customer P&L the same as promotion ROI?
No. The customer P&L reports account economics for a period. Promotion ROI estimates an event’s incremental return against a no-promotion baseline. The promotional effectiveness guide explains the event calculation.
Should trade spending reduce revenue or appear as an expense?
Follow Finance’s accounting policy and the commercial facts. Document the treatment rather than assuming every rebate, allowance, and fee belongs on the same line.
What happens when a cost has no SKU?
Retain it at account level or in an unassigned-product row. Allocate it only with a justified rule. Missing product detail does not remove the obligation.
Can the largest customer contribute less profit?
Yes. In the illustrative comparison, the larger account contributes less after investment, freight, and service costs. The example shows how this can happen, not how often it happens.
Who owns the process?
Finance owns financial definitions and reconciliation. Commercial and operations teams validate agreements, assignments, assumptions, and actions. The KAM should be able to explain the account’s commitments.
How often should the team review it?
Align reviews with financial close, claim timing, and account decisions. Monthly financial reviews and quarterly commercial reviews are a starting point to adjust to your business.
Start with an account your team can explain
Before using the numbers to change terms, check whether Finance and the KAM can answer these questions:
• Does the revenue starting point make clear which discounts are already included?
• Are all known costs retained, including those without product detail?
• Can each financial line reconcile while showing unassigned amounts?
• Are claims and settlements matched to the obligation rather than added as new costs?
• Does the proposed action account for demand, partner economics, and costs that would actually change?
Price realization and promotion decisions become more useful when Finance and the account team understand the economics underneath them.
Put the customer P&L to work with CPG Atlas
This is the work behind CPG Atlas, Revology’s pricing and RGM analytics platform for consumer brands. It brings customer profitability, promotion lift, and ROI, and pricing scenarios together, with financial results reconciled to the general ledger. Finance, Sales, and RGM can investigate what is driving account profit and compare changes before agreeing to the next plan. We build Atlas in your environment and train your team to run it, so the capability stays with your business.
Start with one account and a quarter that Finance and the commercial team can review together. We can use that account to identify the source gaps, agree on the definitions, and show how Atlas could support your next planning cycle.