


A practical guide for CPG revenue, sales finance, and trade marketing leaders: how to measure what a promotion added, account for its full cost, and decide what to run next.
During a promotion review with a consumer products client, a sales lead asked whether the return on the screen included the display fee. The team had paid the fee to run a month-long event, but the analysis covered only per-unit funding. Including the fee would bring the return down. It was a fair question, and one we should be able to answer before recommending the next promotion.
Promotional effectiveness measures the incremental volume and profit a promotion generates relative to what it costs. Start with what would have sold without the event, calculate the gross profit on the additional units, and compare that with the full event spend. In the return ratio used here, 1.0x is break-even. The work is getting sales, finance, and RGM to agree on those inputs and use the result when they build the next calendar.
The spending justifies that effort. In a 2019 article, McKinsey reported that CPG companies invested about 20% of revenue in trade promotions and cited 2016 Nielsen estimates that 59% of promotions lost money globally, rising to 72% in the US. These are historical benchmarks. Our 2025 Revenue Growth Analytics Maturity Report found that about 63% of 158 commercial leaders across industries said they could not quantify incremental promotion ROI, while 87% still set promotion calendars manually. These were self-reported findings.
This guide follows the questions that come up in those reviews: how to define the event, which costs to include, how to judge the lift, and what would justify repeating it. The seven-step scorecard and worked example give finance and sales a common basis for that discussion.
Table of Contents
What Is Promotional Effectiveness?
Promotional effectiveness is the incremental volume and gross profit an event produces compared with what would have sold without it, assessed against the event’s full trade investment. State the baseline, the costs included, and the data status alongside the result so another person can follow the calculation.
That takes more work than reading a sales spike. Some event costs sit outside the promotion system, the baseline has to be estimated, and deductions may arrive weeks after the event. The scorecard needs to make those gaps visible.
Promotional effectiveness vs. trade promotion optimization
Promotional effectiveness looks back at an event and asks whether it paid off. Trade promotion optimization uses that evidence to decide where the next trade dollar should go. If the historical scores leave out fees or overstate incremental volume, those errors carry into the recommendations.
Trade promotion management (TPM) systems support planning, funding, accruals, and deductions. Their analytical capabilities vary. Teams often need an additional promotion analytics layer to connect those records with retail sales, a credible baseline, and event economics.
The two formulas every promotion scorecard needs
Agree on the formulas before comparing results. ROI conventions differ, and two teams can report different numbers for the same event simply because they define the return differently.
Promo ROI = incremental gross profit dollars ÷ trade spend dollars. We use this as a gross return ratio, with gross profit measured before the event costs included in trade spend. A result of 1.0x (100%) is break-even on that cost scope. A positive ratio below 1.0x means the event did not recover those costs. If spend is missing or zero, show the return as unavailable pending review.
Lift = incremental units ÷ baseline units, for the same product, account, and period. State whether this is lift during the event or net lift after the follow-up period. If the baseline is zero or unavailable, report lift as unavailable.
Two supporting measures help explain the result:
• Subsidized share is baseline units divided by total promoted units. When funding applies to every promoted unit, it estimates the share of funded volume that would have sold anyway.
• Cost per incremental unit is trade spend divided by net incremental units. Compare it with gross profit per unit on the same margin basis. If net incremental units are zero or negative, flag the result rather than display a misleading unit cost.
Write down the margin basis and cost scope. Use gross profit at the regular net selling price before the event funding deducted in the denominator. If that funding is already netted out of your profit measure, adjust the calculation so you do not count it twice. Keep recurring costs consistent between the promotion and the no-promotion comparison.
Why Most Promotion Reports Never Change a Decision
A report can show a strong sales week and still leave the team unsure whether to repeat the promotion. We’ve seen the same issues hold up that decision in client reviews:
• Retailer totals hide separate offers. In one review, a chart combined two product groups at the same retailer: a buy-one-get-one offer on one and a temporary price reduction (TPR) on the other. The team needed to see each event separately before interpreting the result.
• The cost view is incomplete. Per-unit funding may be in the promotion system while display and feature fees sit in the customer P&L. Include fees attributable to the event; check whether slotting supports that event or a longer period of distribution.
• Spend has not arrived yet. A completed event can show zero recorded spend while deductions are being processed. That is a missing input, not evidence that the event cost nothing.
• Planned and executed dates differ. If the deal is loaded for one set of weeks and runs in another, the retail sales and funding records will not match.
• The team has no agreed decision rule. A red, yellow, or green flag helps only if people know what earns that color and what they are expected to do about it.
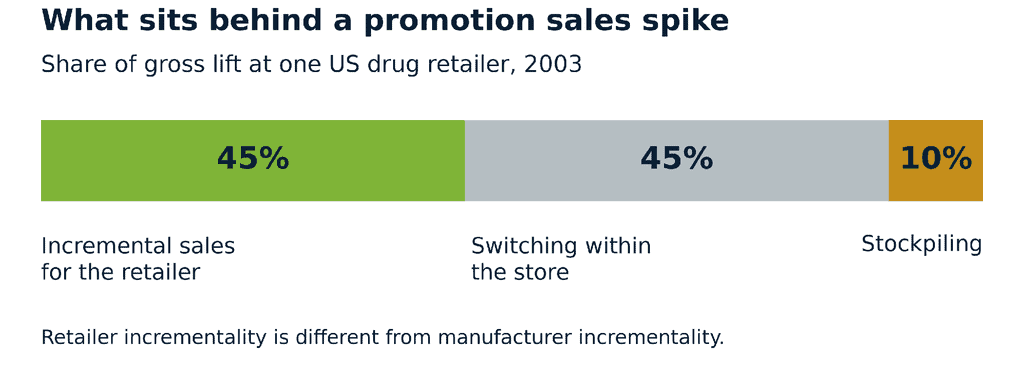
Research also shows why the sales spike needs interpretation. A study covering about 36 million promotion observations at a major US drug chain found that roughly 45% of gross lift was incremental to the retailer, 45% came from switching within the store, and 10% from stockpiling. More than half of the promotions were unprofitable for that retailer (Ailawadi et al., Journal of Marketing Research, 2006). Retailer incrementality is different from manufacturer incrementality or new category demand. In a separate 2022 article, NielsenIQ reported that over half of trade promotions produced little to no sales lift.
Try this with last year’s ten largest events. Check whether each result includes the fees paid to run it, whether spend is actual or estimated, and whether the finding changed a later promotion. The answers will tell you where the scorecard needs work.
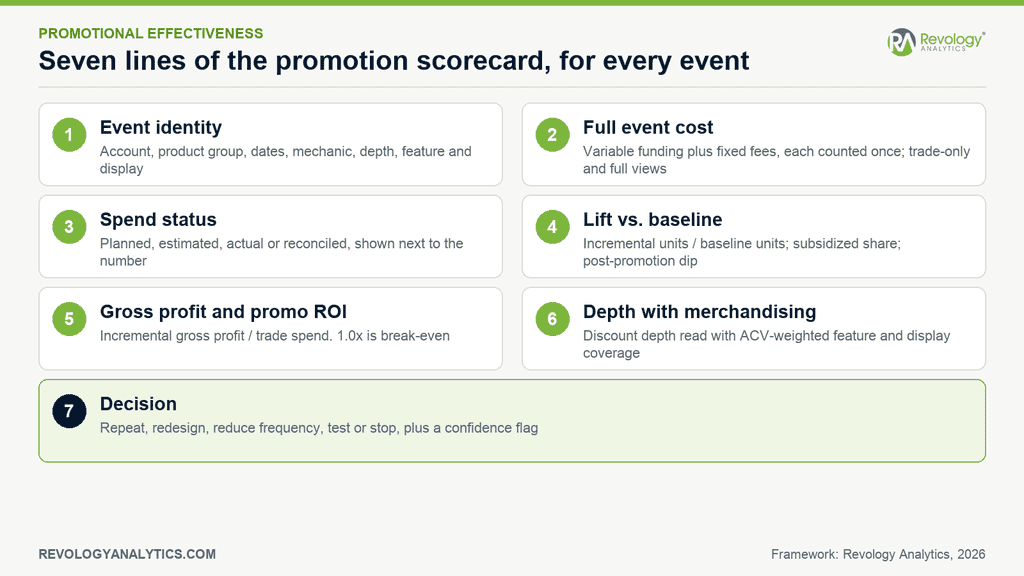
The 7-Step Promotion Scorecard
The first three steps establish the event and its costs. The next three assess the economics. The last records what the team will do with the finding.
Step 1: Give every event an identity
Give each event a record with the account, product group, start and end dates, mechanic, discount depth, and merchandising support. Mechanics might include TPR, buy-one-get-one (BOGO), multibuy, or display-only. Record feature and display support separately, and attach the funding terms.
This is how you avoid combining a TPR and a BOGO simply because they ran at the same retailer in the same month. It also prevents a price comparison from hiding differences in execution. In one client review, the team asked whether a price-based analysis accounted for feature and display support. The historical planning records did not capture it, so the RGM lead wanted those fields added to future plans.
Step 2: Count every cost once, including fixed event fees
Separate variable funding from fixed event costs. Scan-based funding, off-invoice allowances, and some distributor allowances move with eligible volume under the agreed terms. Fixed costs include display fees, feature ad fees, and any slotting specifically attributable to the event. They may sit in different systems or general-ledger accounts; a label such as working or non-working trade does not settle whether the cost belongs to this promotion.
Show a funding-only view and a full event view side by side. Here, “trade-only” means variable funding; the full event view adds attributable fixed fees, which are also trade costs. The team that raised the display-fee question wanted to switch between the two views and see what changed. Reconcile the costs to the price waterfall and customer P&L, count each cost once, and keep unrelated annual customer costs out of a single event’s return.
Step 3: Label spend as planned, estimated, or actual
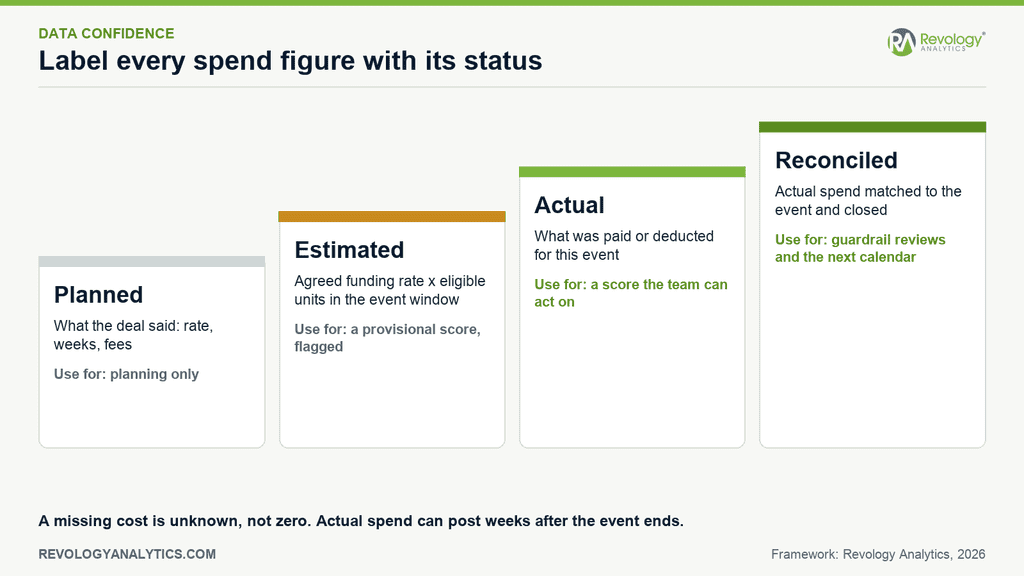
Planned spend comes from the deal. Estimated spend uses documented terms and eligible volume, such as the scan rate multiplied by units sold. Actual spend is what has been paid or deducted. Reconciled spend has also been matched to the event and checked for completeness. A posted deduction alone does not mean every event cost is in.
In one review, completed events had no recorded spend. The team discussed using the agreed rate and sales volume to estimate the cost until deductions arrived, with a visible estimated-spend flag. That is a workable interim approach when the terms and eligible units are known. Update the score when actuals arrive and keep the provisional label until the event’s costs reconcile.
Step 4: Measure lift against a baseline you can defend
The baseline estimates what the product would have sold at that account without the event. Sales above it are estimated incremental units for that product and period. Where funding applies to all units, the baseline portion represents volume discounted even though it was expected to sell anyway.
Use comparable non-promoted weeks and account for seasonality, distribution, regular price, stockouts, and overlapping promotions. The previous week or the same week last year may be useful inputs, but neither is a defensible baseline on its own when those conditions have changed.
Check what happens after the event, too. Stockpiling can bring purchases forward and leave a dip in later weeks. A study of tuna and toilet tissue estimated dips of 4% to 25% of the immediate sales effect and found they could be difficult to detect (van Heerde, Leeflang, and Wittink, Journal of Marketing Research, 2000). Start with two to four weeks of follow-up, then adjust for the category’s purchase cycle. Subtract the dip attributable to the promotion, not every shortfall caused by stockouts, distribution changes, or other events. If your model already measures the net effect across those weeks, do not deduct the dip again.
Step 5: Convert lift into incremental gross profit and promo ROI
Multiply net incremental units by gross profit per unit before the event’s trade costs, then divide by the spend in scope. Where products have different margins, calculate their contributions separately and add them. Show both the trade-only and full event results from Step 2. For a portfolio decision, also check whether the gain came at the expense of another product you sell and account for the lost profit.
Calculate the retailer’s economics separately. A promotion can help the manufacturer and still reduce the retailer’s profit, or vice versa. The Ailawadi study found that deep, featured promotions on strong brands generated substantial unit lift for the retailer but also sharply reduced promotional margins. Bringing both views to the buyer discussion makes the trade-off explicit.
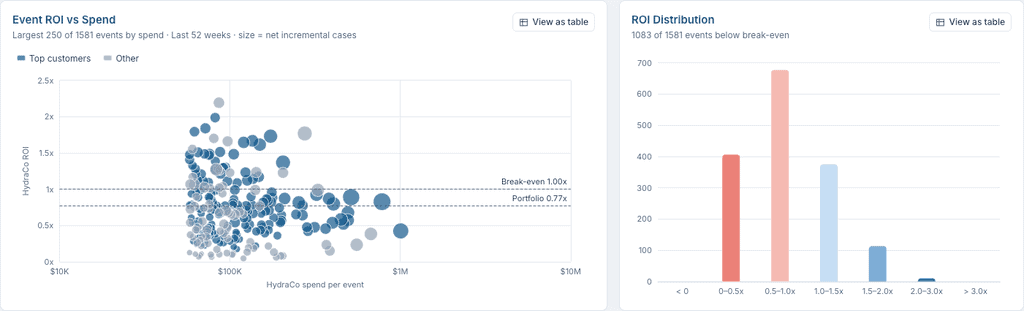
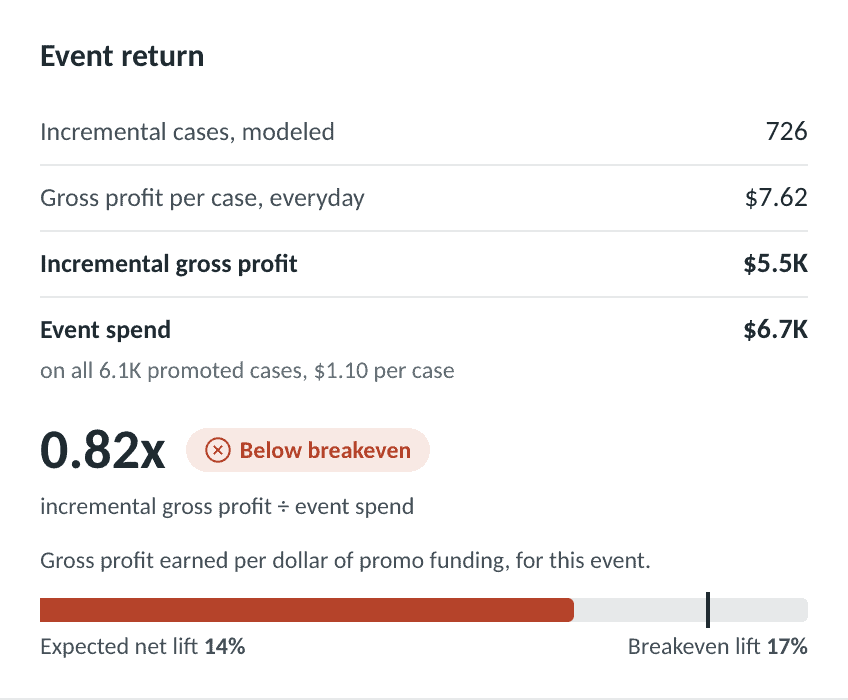
In Revology’s ATLAS demonstration, the event return view lets the team compare promotion spend with payback and see the spread of results behind a portfolio average. It is a useful starting point for choosing which events deserve a closer review.
Step 6: Read discount depth and merchandising together
Read discount depth alongside the support the offer received. Percent ACV with feature or display measures the share of all-commodity store sales represented by stores running that condition, within the selected market and period. It is a weighted measure of coverage, not the share of your brand’s sales sold on promotion.
In one client’s historical analysis, some events with feature or display support showed similar lift at shallower discounts than TPR-only events. That is a useful hypothesis to test, rather than proof that the display caused the difference. Research on store data also found different sources of lift for feature-supported and display-only discounts. Compare similar events and include the support fee before deciding that the shallower offer is better.
Step 7: Turn the score into a decision
Record a decision and a separate confidence status. Repeat, redesign, reduce frequency, test, and stop are useful choices, but a weak baseline or incomplete spend should trigger a data review before a firm recommendation.
| Decision | Evidence to look for | Next step |
|---|---|---|
| Repeat | Full event return clears the hurdle; reliable inputs. | Check conditions for the next event. |
| Redesign | Incremental demand, but insufficient return. | Test depth, support, timing, or funding. |
| Reduce frequency | Evidence of demand pulled forward or repeated subsidy. | Test a longer gap across the calendar. |
| Test | A specific commercial hypothesis worth evaluating. | Define the comparison and success measure. |
| Stop | Poor economics, no viable redesign or approved exception. | Reallocate the funding. |
Figure 5. Use these checks to guide the decision. Low lift alone does not justify reducing frequency, and incomplete data calls for reconciliation before a final decision.
• Repeat. The full event return clears the agreed hurdle, the costs reconcile, and the baseline is credible. Use the event as a starting point for the next plan, checking whether conditions have changed.
• Redesign. There is credible incremental volume, but the event misses the return hurdle. Test a change to depth, mechanics, merchandising, duration, or the fee.
• Reduce frequency. The event is profitable, but repeated promotions appear to subsidize regular purchases or pull demand out of later weeks. Test a longer gap and measure the effect on the whole calendar.
• Test. The team has a specific hypothesis, such as a shallower discount with display support. If the score is provisional because of missing costs or dates, resolve those gaps first; a new promotion will not fix the old event’s data.
• Stop. Reliable evidence shows the event falls below the hurdle, there is no credible redesign worth testing, and no approved strategic reason to continue. Reallocate the funds.
A below-break-even event can still have a commercial purpose. One client RGM lead raised category share and retailer outcomes as reasons to look beyond the return ratio. That calls for a documented objective and a measure of success. It does not change the event’s financial result.
Worked Example: Promotional Effectiveness for One Event, Scored Two Ways
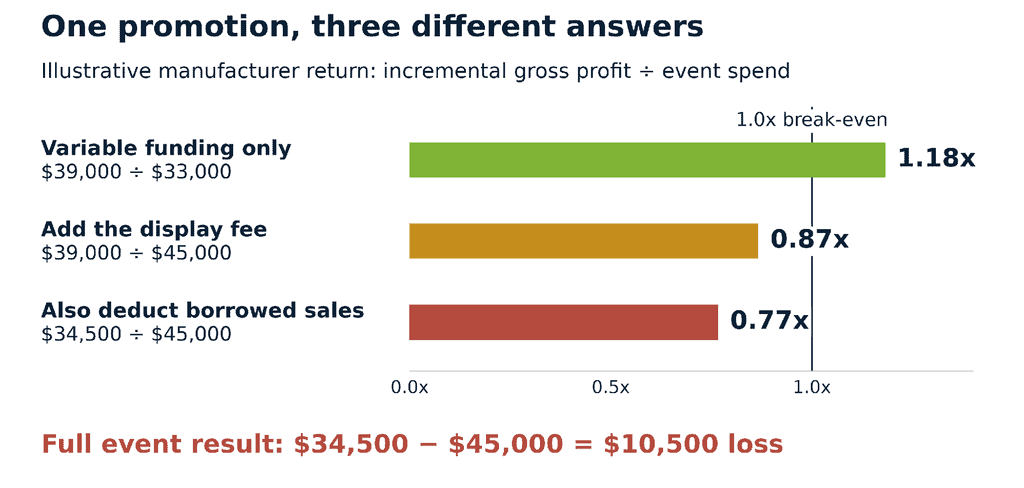
The following example is illustrative. It uses rounded numbers to show how the same event can look attractive on variable funding and fall below break-even once the fee and post-promotion dip are included.
Scenario setup
A snack manufacturer runs a four-week TPR for one product group at one grocery retailer, with displays in most stores. It pays $0.50 in scan funding on every unit sold during the event and a $12,000 display fee. Gross profit at the regular net selling price is $1.50 per unit before these event costs. Assume no additional cannibalization or cost-to-serve changes, and treat the 3,000-unit dip below as attributable to the event.
Scoring the event
1. Baseline. The estimated no-promotion volume is 10,000 units a week, or 40,000 units over the four-week event.
2. Promoted volume. Sales reach 66,000 units. The estimated incremental volume during the event is 26,000 units, giving lift of 26,000 ÷ 40,000 = 65%.
3. Subsidized share. The baseline represents 40,000 ÷ 66,000 = 61% of promoted units. Funding on those units costs $20,000.
4. Trade-only view. Incremental gross profit before event costs is 26,000 × $1.50 = $39,000. Variable funding is 66,000 × $0.50 = $33,000. Promo ROI is $39,000 ÷ $33,000 = 1.18x.
5. Full event view. The display fee brings total event spend to $45,000. Promo ROI falls to $39,000 ÷ $45,000 = 0.87x.
6. Post-promotion dip. The attributable dip is 3,000 units, reducing net incremental units to 23,000 and incremental gross profit to $34,500. Full event promo ROI is $34,500 ÷ $45,000 = 0.77x, a $10,500 loss against the no-promotion comparison. The trade-only return is 1.05x.
7. Break-even check. Actual cost per net incremental unit is $45,000 ÷ 23,000 = $1.96, above the $1.50 gross profit per unit. At a fixed $45,000 spend, break-even would require 30,000 net incremental units. That is only a retrospective check: under scan funding, more promoted units also cost more. With the same 40,000-unit baseline, $0.50 rate, $12,000 fee, and 3,000-unit dip, a future event would need 76,500 promoted units, or 33,500 net incremental units, to break even.
The decision
The funding-only result clears break-even, but it does not establish that the event deserves a repeat. The full event result gives the team a reason to test a different design. If funding falls to $0.30 per unit while event volume stays at 66,000 and the dip stays at 3,000, spend falls to $31,800, including the display fee. The return becomes $34,500 ÷ $31,800 = 1.08x. That is a scenario to test: a shallower discount may change volume, and the combined event’s lift does not prove the display earned its fee. Keep the score provisional until deductions and fees reconcile.
What to communicate internally and externally
Internally, put the two cost views side by side and lead with the full event result. The team should understand why a reported 1.18x became a loss before approving a similar offer. With the retailer, discuss whether a shallower discount with display support could preserve enough volume and profit for both parties. Show the retailer’s economics separately and agree on what the test needs to establish.
How to Set Promotional Effectiveness Guardrails Finance and Sales Will Both Sign
The scorecard becomes useful when finance and sales agree on what the result means for the next plan. In one client discussion, the RGM lead explained that the team had never been given a return hurdle. They were asking what qualified as good enough to repeat.
Agree on four rules before the next planning cycle:
1. Break-even is 1.0x under this definition. Apply it to the full event view, with a consistent no-promotion comparison and all attributable event costs included.
2. Set a repeat hurdle above break-even. Finance and sales should account for measurement uncertainty, alternative uses of the budget, and commercial priorities. Write down the hurdle and revisit it as the evidence improves.
3. Document strategic exceptions. Name the objective, how it will be measured, who approves the spend, and when it will be reviewed. Category share, new distribution, or a specific retailer commitment can be valid objectives. The account’s size alone does not explain what the spend is expected to achieve.
4. Keep data confidence separate from the decision. Estimated costs, unmatched dates, or a missing baseline mean the score is provisional. Reconcile the data or design a targeted test before making a permanent repeat-or-stop decision.
There will be disagreements. A sales team may argue that including fees makes a retailer look expensive; that is exactly the cost the account plan needs to recover. Finance may challenge the baseline. Show the method, test how sensitive the recommendation is to it, and agree on where the estimate is reliable enough to act. Start with the evidence you have and improve the rules as more events close.
What We Hear in Client Promotion Reviews
These anonymized examples come from client reviews. Each raised a practical question the scorecard needed to answer.
• A consumer products sales lead wanted the return shown with and without the fee paid to secure a display. The existing view covered per-unit funding (Step 2).
• A commercial team found that one retailer chart combined BOGO and TPR activity across different product groups. They needed to separate the two offers before interpreting the result (Step 1).
• Completed events had no matched actual spend. The team wanted documented estimates and a visible status flag until actual costs arrived (Step 3).
• A food and beverage team asked for a red, yellow, or green signal based on volume and margin, with the retailer’s outcome considered too. The request was for help deciding what to run more or less often (Step 7).
The route to market changes the data work. For a beverage business selling through distributors, allowances and depletion records need to be matched to retail activity. A shipment or depletion is not automatically a consumer sale, so be explicit about the volume basis used in the score.
For a natural and organic grocery brand, trade charges may arrive through the distributor even though the commercial decision sits with the retailer account. Our plant-based creamer case study describes allocating more than $13M in annual trade spend back to customers so the team could calculate customer-level ROI. It also reports 2024 slotting within 0.1% of plan. Those are account-level outcomes, distinct from a claim that each promotion was profitable. In consumer electronics, a seasonal sales peak creates a different problem: the baseline must account for demand that would have arrived without the promotion.
Our $1.5B CPG manufacturer case study reports an 8% gross profit improvement, 13% for anchor brands, alongside 6% unit volume growth and a trade investment ROI increase from 80% to 92% within a year. That ROI change is 12 percentage points. The case study’s aggregate measure should not be compared directly with this article’s event-level 1.0x hurdle without confirming the same numerator, cost scope, and baseline.
Six Promotional Effectiveness Mistakes
Watch for these mistakes when reviewing the next calendar:
• Treating lift as the verdict. The worked example produces 65% lift and still loses money once all event costs are included.
• Scoring blended retailer totals. Separate offers can need different decisions even when they run at the same account.
• Leaving event fees out. Include attributable display, feature, and slotting costs once, with a clear allocation basis where needed.
• Treating missing spend as zero. Flag the gap and use a documented estimate where the terms and volume support one.
• Ignoring purchases brought forward. Assess the post-promotion period and subtract the dip attributable to the event.
• Assigning colors without rules. The threshold, confidence status, and exception process need to be clear to everyone using the score.
Promotional Effectiveness FAQs
What is promotional effectiveness in consumer packaged goods (CPG)?
Promotional effectiveness measures the incremental volume and profit generated by a promotion relative to its cost. Compare the event with a credible estimate of sales without the promotion, include attributable event costs, and account for purchases brought forward from later weeks. State whether the result is for the manufacturer, retailer, or category.
How do you calculate promo ROI?
For the gross return ratio used here, divide incremental gross profit before event trade costs by those trade costs. A result of 1.0x, or 100%, is break-even. Report variable funding and full event costs separately.
What is a good ROI for a trade promotion?
Above 1.0x on the full event view means incremental gross profit exceeds the included event costs under this definition. The return needed to repeat an event should also reflect uncertainty and other uses of the budget. Finance and sales should agree on that hurdle and document any strategic exceptions.
Should display and slotting fees count in promotion ROI?
Include fees attributable to the event, count each once, and reconcile them to the customer P&L. Slotting often supports distribution over a longer period, so it needs a justified allocation rather than being charged entirely to one promotion. Keep unrelated annual customer costs separate.
How do you measure promotional lift?
Divide incremental units by baseline units for the same product, account, and period. Estimate the baseline using comparable non-promoted weeks with adjustments for seasonality, distribution, and other demand changes. Report in-event lift separately from the net result after the attributable post-promotion dip. If the baseline is not supportable, report lift as unavailable.
What share of trade promotions lose money?
It depends on the population, period, and definition of profit. Nielsen estimates cited by McKinsey in 2019, using 2016 data, put the share at 59% globally and 72% in the US. A 2006 study of a large US drug chain found more than half unprofitable for the retailer. These historical findings are context, not a current failure rate for your own calendar.
How often should a promotion scorecard be reviewed?
Review each event when the results are available, marking early scores provisional until spend is complete and reconciled. Review the calendar each quarter to make changes while they are still useful. Revisit the return hurdle and exception rules with finance and sales at least annually.
Key Takeaways
• Score individual events before rolling them up to a retailer or calendar view.
• Show variable funding and full event costs separately, with each cost counted once.
• Label spend status and keep provisional findings separate from final decisions.
• Define the ROI convention, margin basis, and baseline; account for the dip attributable to the promotion.
• Record what changes in the next plan: repeat, redesign, reduce frequency, test, or stop.
How Revology Helps You Measure Promotional Effectiveness
Revology’s Promotion Effectiveness and Optimization work helps your team connect event records, retail sales, funding, and customer P&Ls, then use that evidence in account planning. We work through the baseline and cost definitions with finance and sales, and establish who owns the next decision. The same foundation supports the CPG RGM analytics navigator, so promotion findings can inform pricing, pack, and assortment choices. The capability is built with your team, so the models, data, and decision rules remain usable in-house.
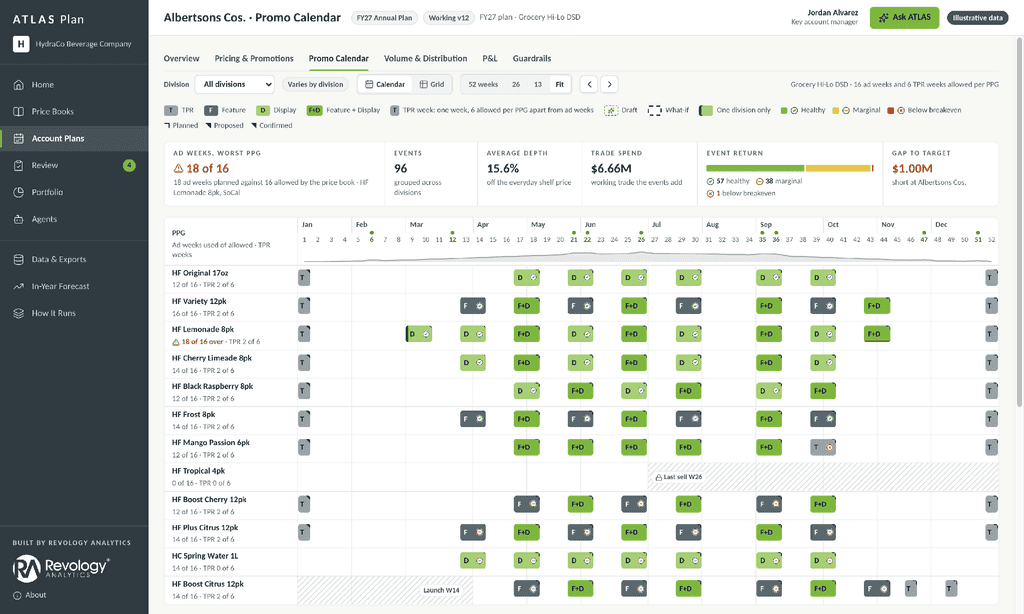
ATLAS Plan, our CPG planning and forecasting application, connects those findings to the next promotion calendar. The demonstration below shows how a team can review timing, merchandising, funding, and modeled event economics before committing to the plan.
Start by checking four recent decisions:
• Can you explain the full cost of your three largest events last quarter, including fees?
• Does each score show whether spend is estimated, actual, or reconciled?
• Have finance and sales agreed on the return that earns a repeat?
• Did a finding change the design of the next promotion?
If those answers are hard to produce, start with a small set of events and reconcile them end to end. Talk to our team about a promotional effectiveness review.






