

You have paid for good-better-best pricing more often than you think: the entry laptop, the model most people pick, and the one with every upgrade. Your customers face the same choice on your price list, whether or not anyone designed it. When the tiers are built on purpose, buyers trade up, and the entry price holds without a price war. When they grow by accident, your premium product ends up selling at your middle price, one discount at a time.
Table of Contents
When Kroger reported its fiscal second quarter in September 2026, sales of Private Selection, its premium own brand, were up more than 14% (Food Dive). In the same quarter, Kroger’s CEO described shoppers as “pretty disciplined about what they buy.” Buyers who count every dollar still paid for the step up when they could see what it bought. That is good-better-best pricing doing its job, and a manufacturer, distributor, or med-tech company can build the same mechanism into its own lineup.
Good-better-best pricing offers three versions of the same core product or service at stepped prices, each separated by value fences such as features, service levels, warranties, or terms, so customers sort themselves by willingness to pay. When done well, the Good tier defends share against low-cost rivals, the Better tier drives volume and margin, and the Best tier anchors the range and captures buyers who value more.
If poorly executed, the lineup risks tier collapse. Sales representatives may offer Best features at Better prices to meet targets, while the Good tier attracts buyers from Better, causing all price points to converge. As a result, intended margins erode gradually and often go unnoticed until year-end reporting.
What Is Good-Better-Best Pricing?
Good-better-best pricing, defined. A price architecture that sells three versions of a single core offer at stepped prices, fenced so that each customer segment selects the tier that matches its willingness to pay. It is a form of versioning and differs from volume-tiered pricing, in which the unit price decreases as quantity increases.
You have probably paid for good-better-best pricing this month: fuel grades at the pump, a basic or flexible airline fare, a car battery sold with a two-, three-, or four-year warranty. In B2B, the tiers are less visible and often more valuable. A machine sold with a standard warranty, the same machine with an extended warranty and priority service, and a monitored version with guaranteed uptime is good-better-best pricing, even if nobody at the company calls it that.
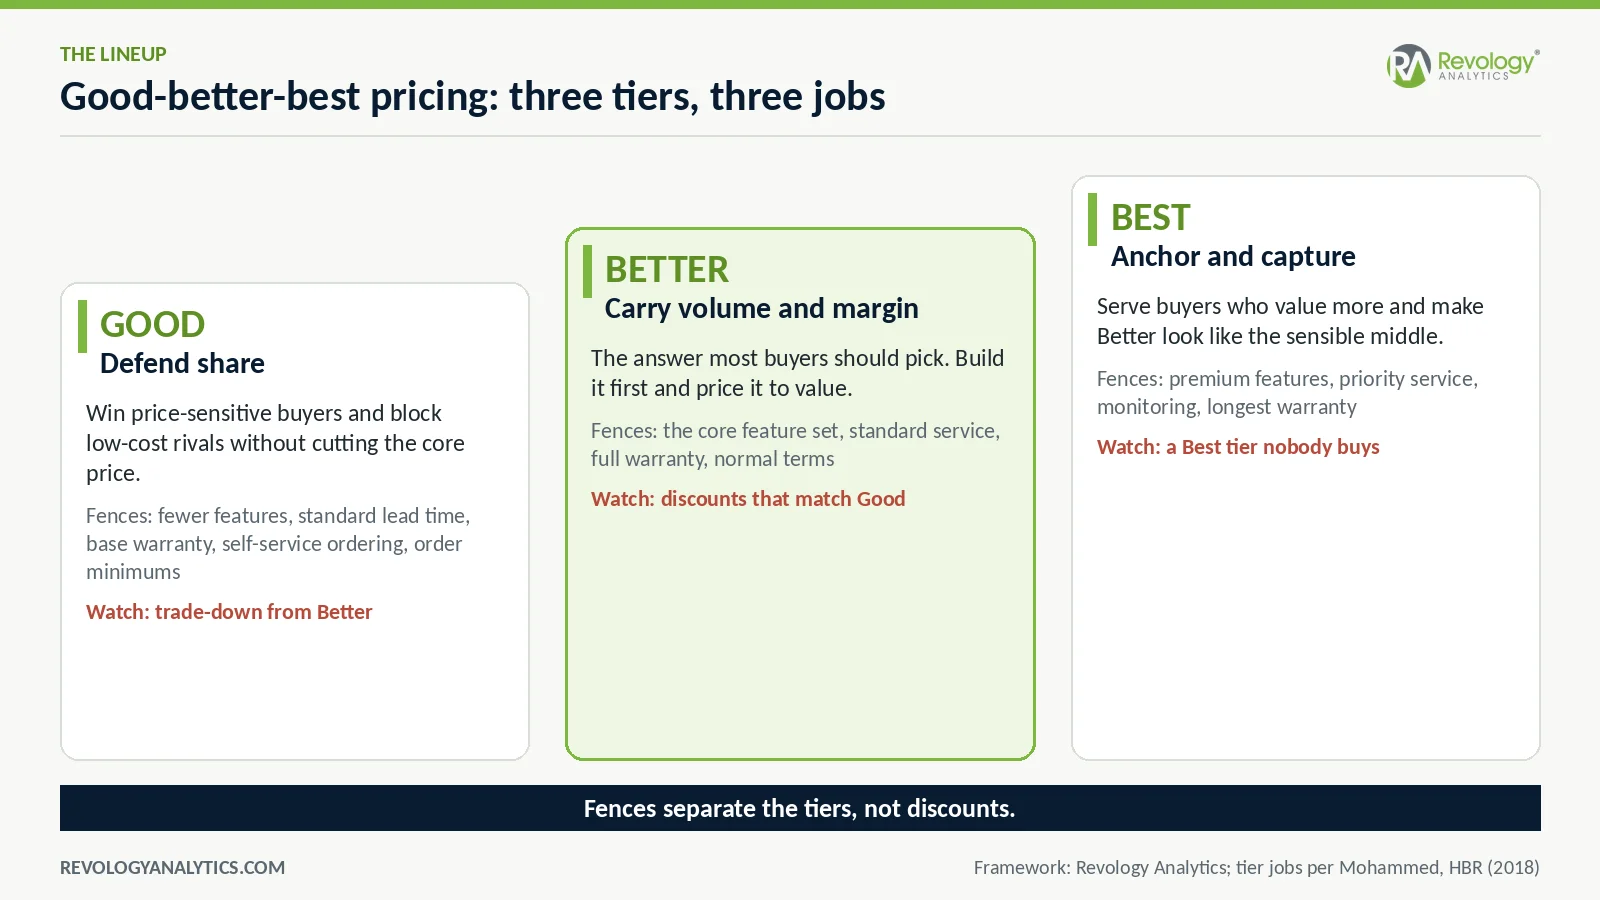
Rafi Mohammed made the case in Harvard Business Review that most companies leave profit on the table in both directions: they discount to win price-sensitive buyers and fail to offer a premium version to the buyers who would pay more. Three tiers address both groups at once, provided each tier has a clear job.
How good-better-best pricing differs from tiered pricing, bundling, and versioning
These terms are often used interchangeably, but this confusion can be costly, as each requires a distinct pricing approach.
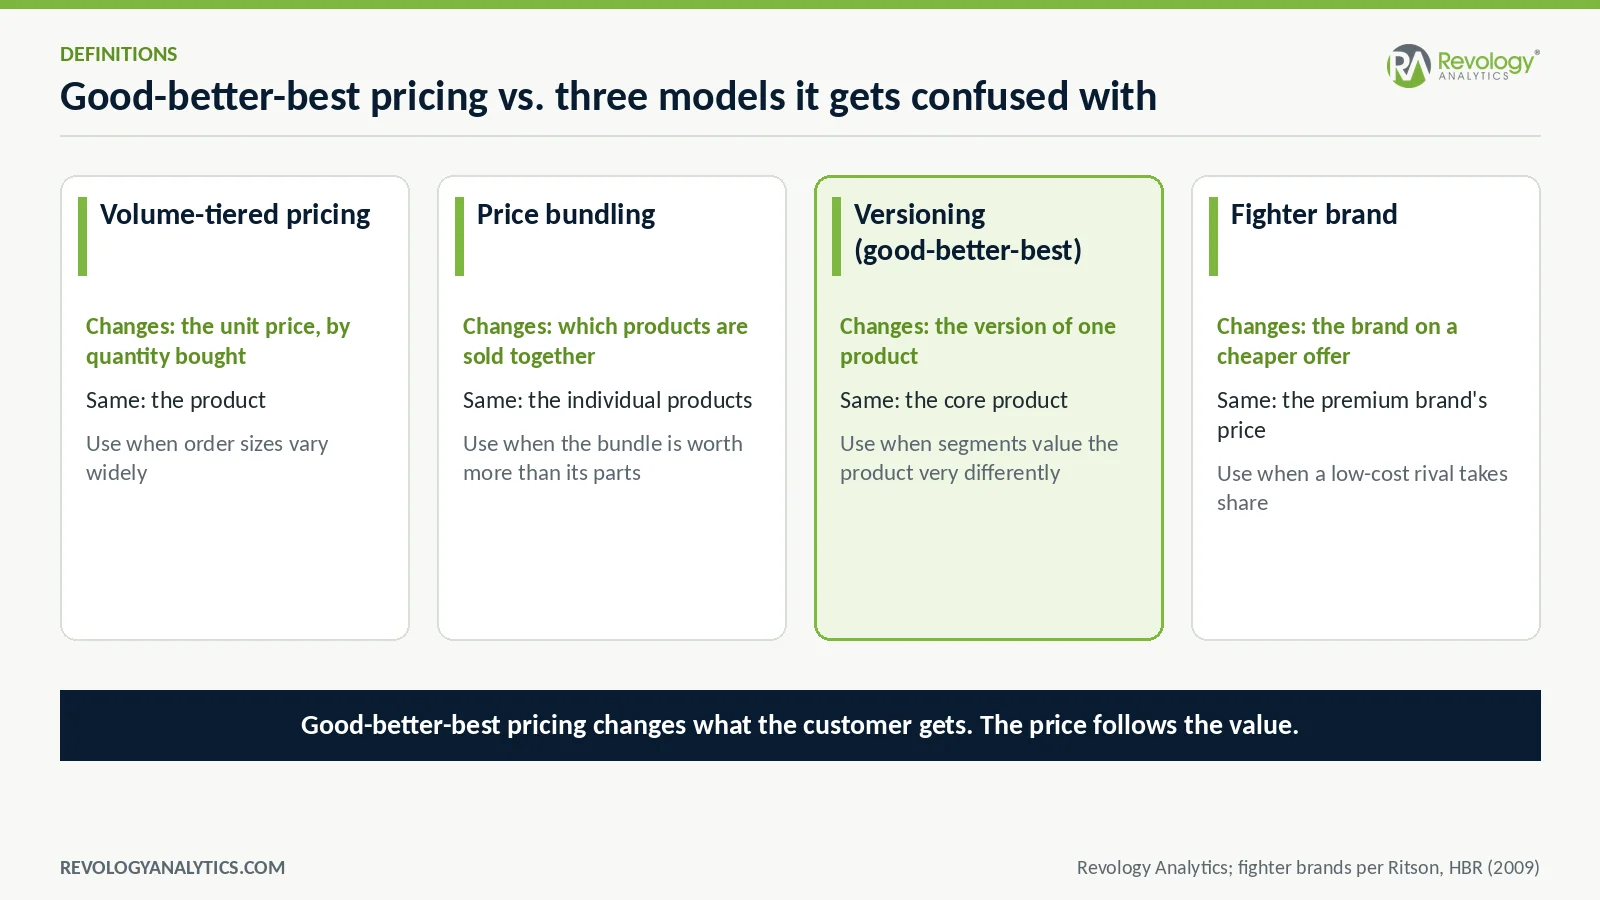
• Volume-tiered pricing. What changes: the unit price, by quantity bought. What stays the same: the product. Best when: order sizes vary widely.
• Price bundling. What changes: which products are sold together for one price? What stays the same: the individual products. Best when: the bundle is worth more than its parts; our guide to price bundling covers pure, mixed, and tiered bundles.
• Versioning. What changes: the version of one product a customer buys. What stays the same: the core product. Best when: segments value the same product very differently. Good-better-best pricing is a three-step versioning approach.
• Fighter brand. What changes: the brand to a cheaper offer. What stays the same: the premium brand’s price. Best when: a low-cost rival is taking share, and the core price has to hold.
Why three tiers change what buyers choose
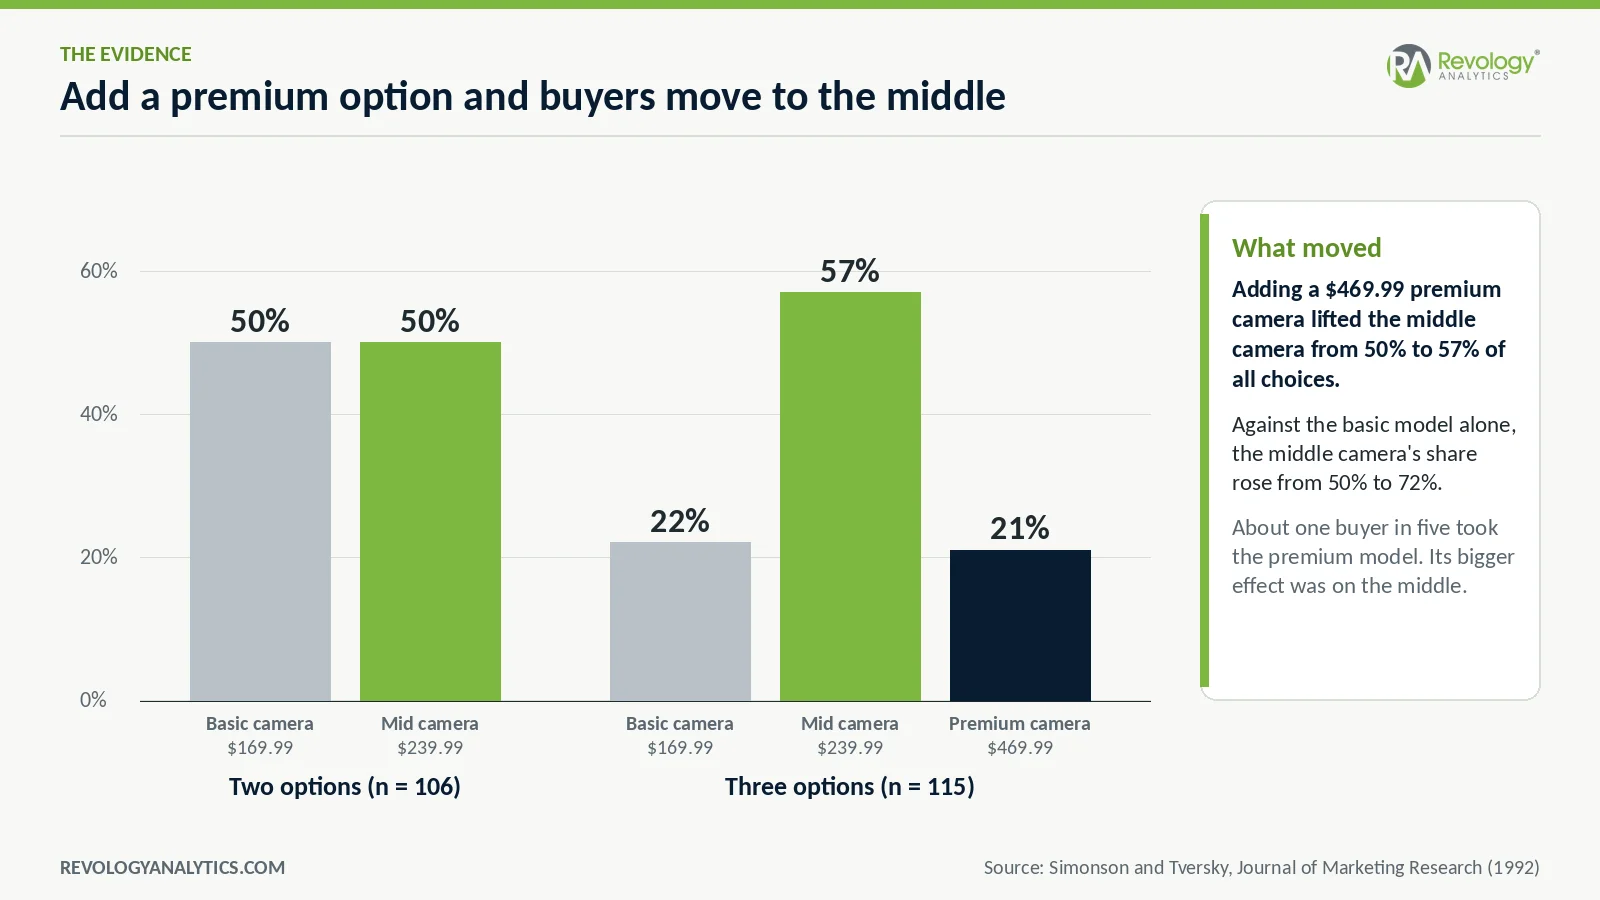
The behavioral evidence is real, and narrower than most pricing blogs suggest. In a study published in the Journal of Marketing Research, Itamar Simonson and Amos Tversky offered a basic camera at $169.99 or a mid-range model at $239.99, and choices split 50/50. When a premium camera at $469.99 was added, the mid-range model’s share rose to 57%, the basic model fell to 22%, and the premium model took 21%. Buyers avoid extremes, and a credible top tier makes the middle look sensible. Researchers call this the compromise effect.
The decoy effect is a different claim, and a much weaker one. A decoy is an option nobody is meant to buy, placed to make another look better. Across 38 studies, Shane Frederick, Leonard Lee, and Ernest Baskin found decoys worked almost exclusively when attributes were presented as abstract numbers; in 27 studies with visual, verbal, or experienced attributes, they found no significant effect, and some decoys backfired (The Limits of Attraction).
Design the middle tier to appeal to most buyers and ensure the top tier offers genuine value to a select segment. Price anchoring can influence decisions, as our work on reference prices and anchors shows, but effective value fences between tiers are the primary drivers of good-better-best pricing success.
Why Good-Better-Best Pricing Grows Margin and Share
Price is the sharpest lever a commercial team has. According to Revology’s research on 2,000 global companies, a 1% improvement in price realization produces a 6 to 7% lift in operating profit, and, excluding highly regulated industries, the figure is in the 10 to 11% range (Pricing Still Packs a Punch, Revology Analytics, June 2025). A tiered lineup moves price realization in three ways at once.
First, it charges each segment closer to what that segment will pay. A single price undercharges the buyers who value you most and loses the buyers who value you least. Three fenced prices capture more of the demand curve, which is why measuring willingness to pay by segment comes before any tier design.
Second, the Good tier defends the share without repricing the base. Anheuser-Busch launched Busch in 1955 at half the wholesale price of Budweiser to fend off cheap regional beers, a case Mark Ritson describes in Harvard Business Review. Dow Corning built the B2B version in the early 2000s with Xiameter: standard silicones, ordered online only, with minimum order sizes, set lead times, and no custom technical support, priced below any Dow Corning offer. According to Chief Executive magazine, the brand recovered its investment in three months, online orders grew to over 30% of the company’s sales, and most of the new business came from new customers.
Third, the Best tier lifts mix. Walmart launched bettergoods in April 2024 as a premium private brand above Great Value, priced from under $5 to $15, and Numerator found its shoppers spend 12% more per trip. Kroger’s Private Selection growth follows the same pattern: in a value-seeking market, a visible step up still sells. Good-better-best pricing grows share at the bottom and margin at the top, without a list-price war.
Where tiered offers leak margin
Tier collapse, the usual failure mode of good-better-best pricing, rarely results from a single bad decision. In our engagements, it builds up from five habits, and Revology’s 2025 Revenue Growth Analytics Maturity Report shows how common each one is.
• Gaps set by cost-plus. About 75% of organizations still set prices primarily using cost-plus or simple competitive benchmarks, so the step from Better to Best reflects only the cost of upgrading, not what it is worth to the buyer.
• Elasticity nobody measured. Almost 50% of companies do not measure price elasticity even once a year, and 35% rarely or never do, so the price gaps are guesses.
• Soft fences. Extended warranties, priority service, and premium features that a rep can add on request stop being fences and become giveaways.
• Discounting nobody can see. 61% of companies manage deal pricing in spreadsheets, and 51% have no price waterfall, so nobody notices when Best sells at Better’s price.
• Incentives that reward volume. 56% of companies set segment-level pricing goals, but only 23% link pricing KPIs to sales compensation. Reps are paid to close, and a discounted Best tier closes faster.
The 7-Step Method for Good-Better-Best Pricing
The following method outlines our client approach. Steps 1 through 6 design the lineup, and step 7 keeps it from collapsing once Sales starts quoting it.
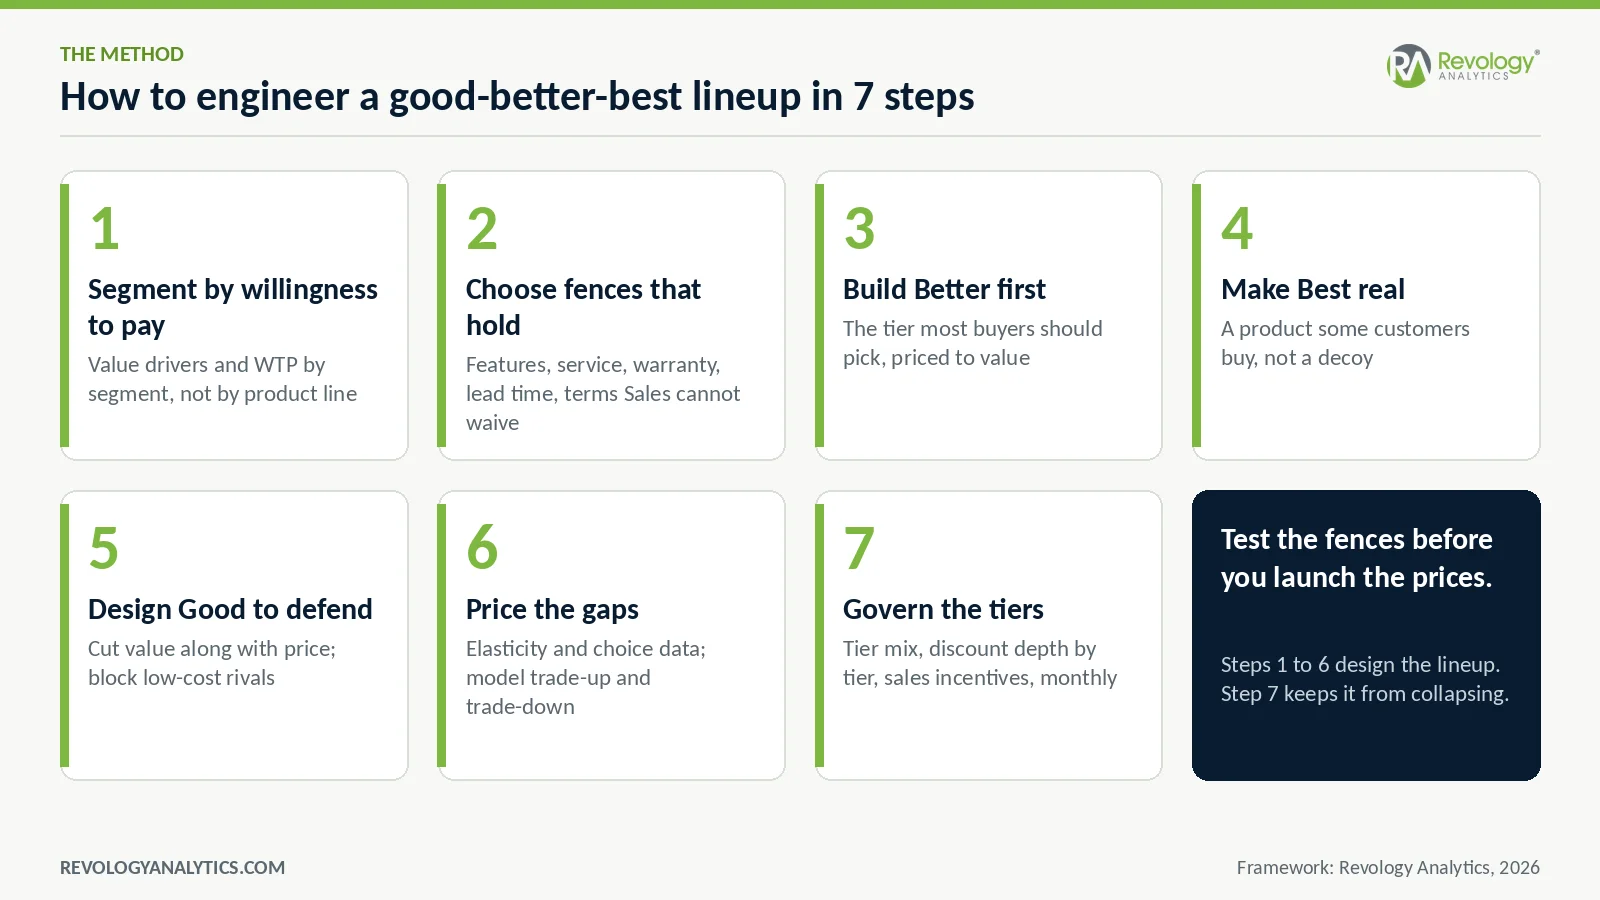
Step 1: Segment by willingness to pay, not by product
Good-better-best pricing starts with customers. Group buyers by what they value and by what a failure costs them: a plant whose line stops when your part fails values uptime very differently from a job shop that can wait a week for a replacement. Use transaction history, win and loss data, sales interviews, and, where the stakes justify it, a choice-based survey. In our experience, the segment that pays the most for Best is rarely the biggest. It is usually the one with the highest cost of failure.
Step 2: Choose value fences that customers cannot cross cheaply
In good-better-best pricing, a fence is whatever stops a buyer from getting the best value at a Good price. The strongest fences are tied to something the customer can see, and you can enforce:
• Product fences. Features, performance, capacity, or technology, such as a battery chemistry that only start-stop vehicles need.
• Service fences. Response times, support hours, priority dispatch, and dedicated contacts.
• Warranty fences. Length and coverage; AutoZone sells its Duralast, Duralast Gold, and Duralast Platinum batteries with two-, three-, and four-year warranties (AutoZone).
• Delivery fences. Lead times, delivery windows, and expedite rights.
• Order and channel fences. Minimum order sizes, self-service ordering versus a named rep, standard products versus custom work.
• Terms fences. Payment terms, return rights, and contract length.
Fences typically fail when they are vague, not enforced in quoting and billing systems, or can be waived by sales representatives without approval. Document each fence, integrate it into systems, and establish clear override authority in advance.
Step 3: Build the Better tier first
Design the Better tier first, as it should be the primary choice for most customers. Typically, this is the current core product, repositioned and priced according to the value delivered to the main segment. Avoid including all features in the Better tier, as this diminishes the appeal of the Best tier and risks offering your top product at a mid-level price.
Step 4: Make the Best tier a real product, not a decoy
In the camera study, about one buyer in five chose the premium model. That is the right target: a top-tier product that some customers actually buy. Fill it with the value your top segment prizes, such as guaranteed uptime, remote monitoring, priority service, or a longer warranty, and price it to that value. A Best tier nobody buys teaches the market to ignore it, and, given the weak decoy evidence, it will not rescue the middle either.
Step 5: Design the Good tier to defend the share without dragging down the core
The Good tier exists to win buyers you are losing to low-cost rivals, not to give your Better customers a cheaper exit. So cut value along with price: fewer features, standard lead times, self-service ordering, order minimums, and no custom engineering support, as Xiameter did. If the Good tier is today’s product at a lower price, it will start cannibalizing Better as soon as the sales team can quote it. Ritson puts cannibalization first on his list of fighter-brand hazards, and the warning applies directly here.
Step 6: Price the gaps with elasticity and choice data
The effectiveness of good-better-best pricing depends on the size of the gaps between tiers. Each price step should correspond to a clear, perceivable value addition, and the optimal gap should be determined empirically. Use choice-based conjoint studies to understand how buyers value features relative to price, and analyze transaction data to measure own-price and cross-price elasticities between tiers, which show how much volume moves from Better to Good when a gap narrows.
Real ladders are often inverted. At a global pharmaceutical company’s branded medicines business in emerging markets, a doubled product strength carried only about 1.3 times the price, while competitors charged about 1.5 times, and two pack sizes of one brand sat close to price parity. Resetting that brand to a 2.5x step between pack tiers meant increases of 43% and 59% across two pack sizes; with a measured elasticity of 0.45, the model showed about $2 million in incremental net sales even after a 19% unit decline. The same logic drives price pack architecture in consumer goods.
See how your pricing compares
Our 2025 report looks at how more than 150 business leaders handle pricing and promotions. See what the best companies do differently, and where most fall short.
Step 7: Govern tier mix, discounts, and sales incentives
Good-better-best pricing is as much a governance problem as a design problem. Five rules keep the tiers apart:
• Discount floors by tier. Best may not be discounted below Better’s price, and Better may not be discounted below Good’s, without a named approver.
• Give-get rules. A lower price requires something back, such as a longer contract, a larger commitment, or a lower service level.
• Hard-coded entitlements. Features, service levels, and warranty terms live in the quoting and billing systems, so a rep cannot add Best entitlements to a Better contract.
• Margin-based incentives. The commission is weighted toward gross profit rather than revenue, so defending the tier pays off.
• A monthly tier-mix review. Mix, discount depth, and trade-down by tier, owned by Pricing and read by Sales and Finance together.
A deal desk with defined approval thresholds should oversee these rules, and price realization should be monitored for each tier individually.
Worked Example: Modeling Tier Migration and Cannibalization
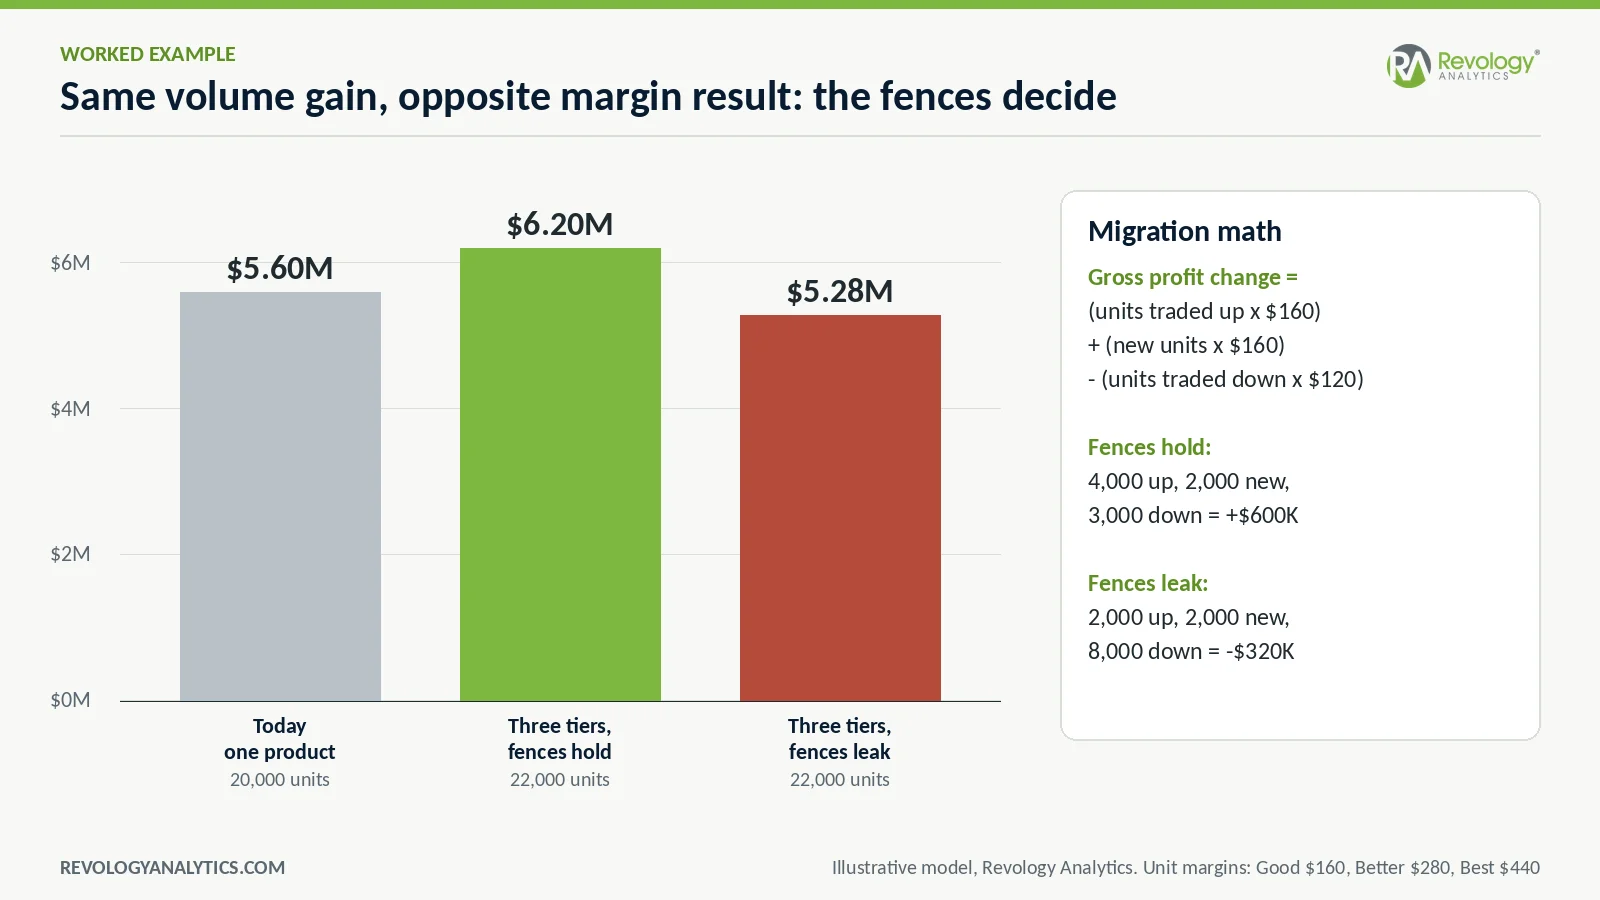
Before you launch good-better-best pricing, model three flows: buyers who trade up, buyers who trade down, and new buyers. The Good tier wins. The same volume gain can raise or cut gross profit, depending on how well the fences hold. Here is the arithmetic for an illustrative manufacturer.
Tier migration math: change in gross profit = (units traded up x margin gained per unit) + (new units x Good margin per unit) minus (units traded down x margin lost per unit).
Step 1: Set the baseline. The company sells 20,000 units of one machine per year at an average price of $880 and a unit cost of $600. That is $280 of margin per unit and $5.6 million of gross profit.
Step 2: Define the tiers. Good sells at $720 with a $560 cost ($160 margin): standard lead time, base warranty, self-service ordering. Better stays at $880 and $600 ($280 margin). Best sells at $1,180 with a $740 cost ($440 margin): remote monitoring, priority service, and a longer warranty. A buyer trading up adds $160 of margin; a buyer trading down loses $120.
Step 3: Forecast migration with the fences in place. The choice model and the sales team’s account review suggest 15% of current buyers trade down (3,000 units), 20% trade up (4,000 units), and the Good tier wins 2,000 new units from low-cost rivals.
Step 4: Apply the math. 4,000 x $160 plus 2,000 x $160 minus 3,000 x $120 = +$600,000. Gross profit rises to $6.2 million, up about 11%, and revenue rises about 12%, from $17.6 million to $19.8 million.
Step 5: Stress-test the fences. Now, let the Good tier keep the full warranty. The model shifts: 40% trade down (8,000 units) and only 10% trade up (2,000 units), with the same 2,000 new units. 2,000 x $160 plus 2,000 x $160 minus 8,000 x $120 = minus $320,000. Gross profit falls to $5.28 million, down about 6%, even though volume grows 10%.
Step 6: Find the break-even. With 4,000 units trading up and 2,000 new units, the lineup can absorb 8,000 units of trade-down ($960,000 divided by $120) before gross profit falls below today’s level. Every fence you weaken moves you toward that line from both sides: more buyers trade down, and fewer trade up.
Good-Better-Best Pricing Examples Across Industries
Good-better-best pricing is easiest to see in products you already know. Three brands run it in plain sight, and the same design shows up in B2B lineups and in our own client work.
Consumer electronics: Apple’s MacBook Neo, MacBook Air, and MacBook Pro
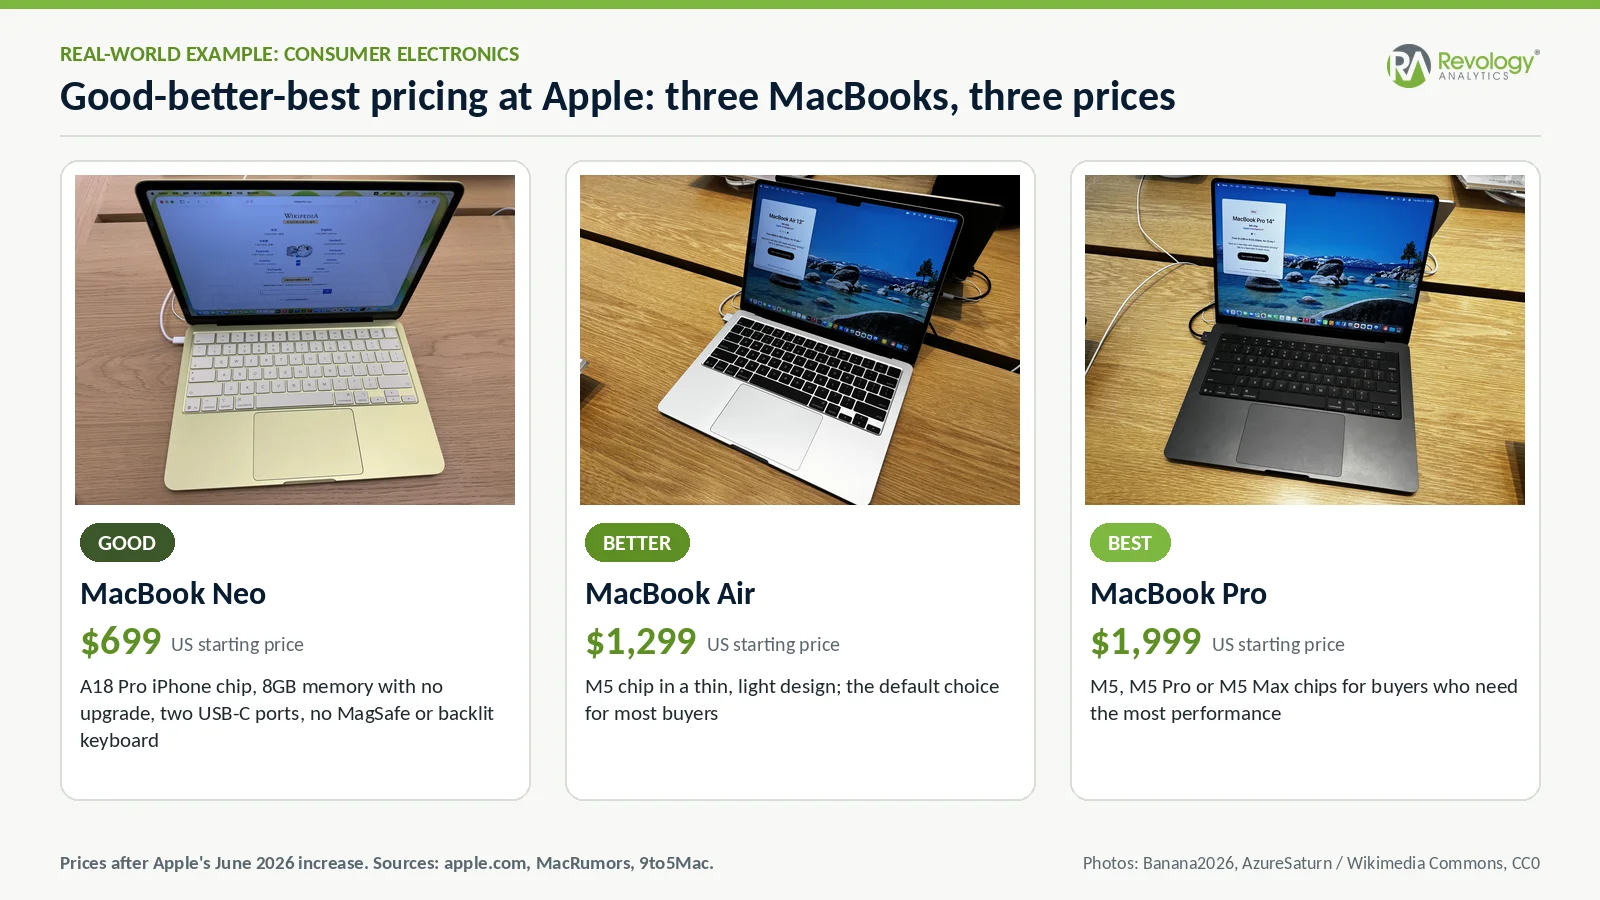
Apple’s laptops are a textbook case of good-better-best pricing. MacBook Neo starts at $699, MacBook Air at $1,299, and MacBook Pro at $1,999 in the US.
The entry model is fenced the way Step 5 recommends: it runs the A18 Pro, an iPhone chip, with 8GB of memory and no upgrade option, two USB-C ports, and no MagSafe charging or backlit keyboard (MacRumors). That keeps the Air as the natural choice for most buyers and leaves the Pro, with M5, M5 Pro, and M5 Max chips, for people who need the performance. When Apple raised prices in June 2026, citing memory and storage costs, it moved all three tiers by $100 to $300, and the ladder held (9to5Mac).
Software: Google Workspace Starter, Standard, and Plus
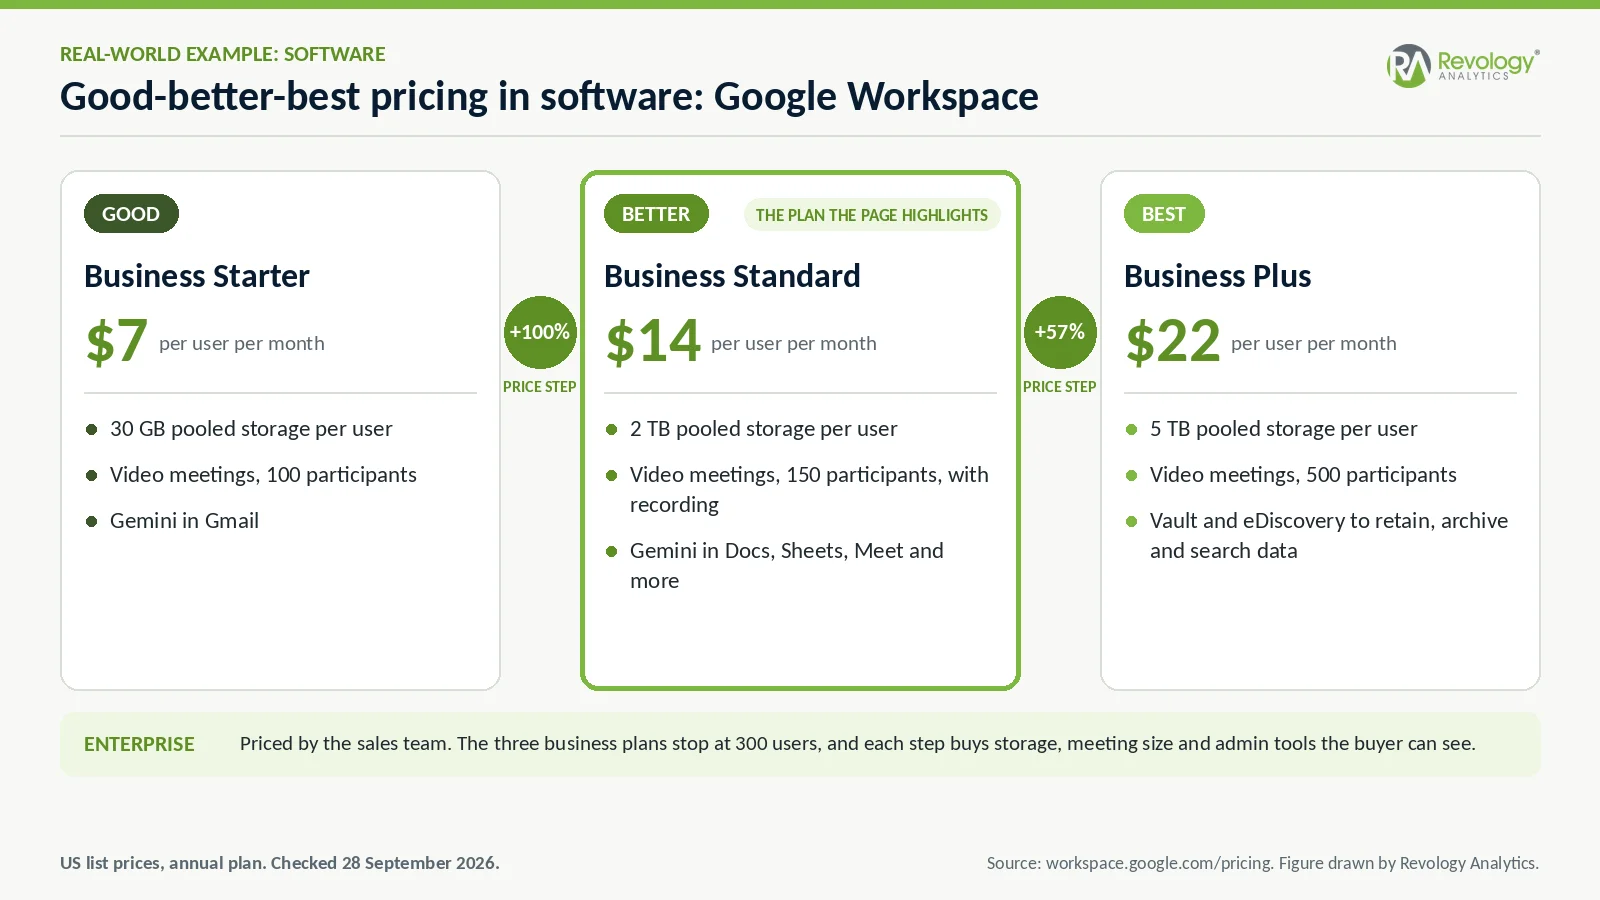
Software pricing pages show good-better-best pricing in its plainest form. Google Workspace lists Business Starter at $7, Business Standard at $14, and Business Plus at $22 per user per month on an annual plan, with Enterprise priced by its sales team (Google Workspace). The fences are easy to read: pooled storage steps from 30 GB to 2 TB to 5 TB per user, video meetings from 100 to 150 to 500 participants, and Plus adds Vault and eDiscovery. On the pricing page, Standard, the middle plan, is the one set apart with a highlighted card.
Food and beverage: Johnnie Walker Red, Black, and Blue Label
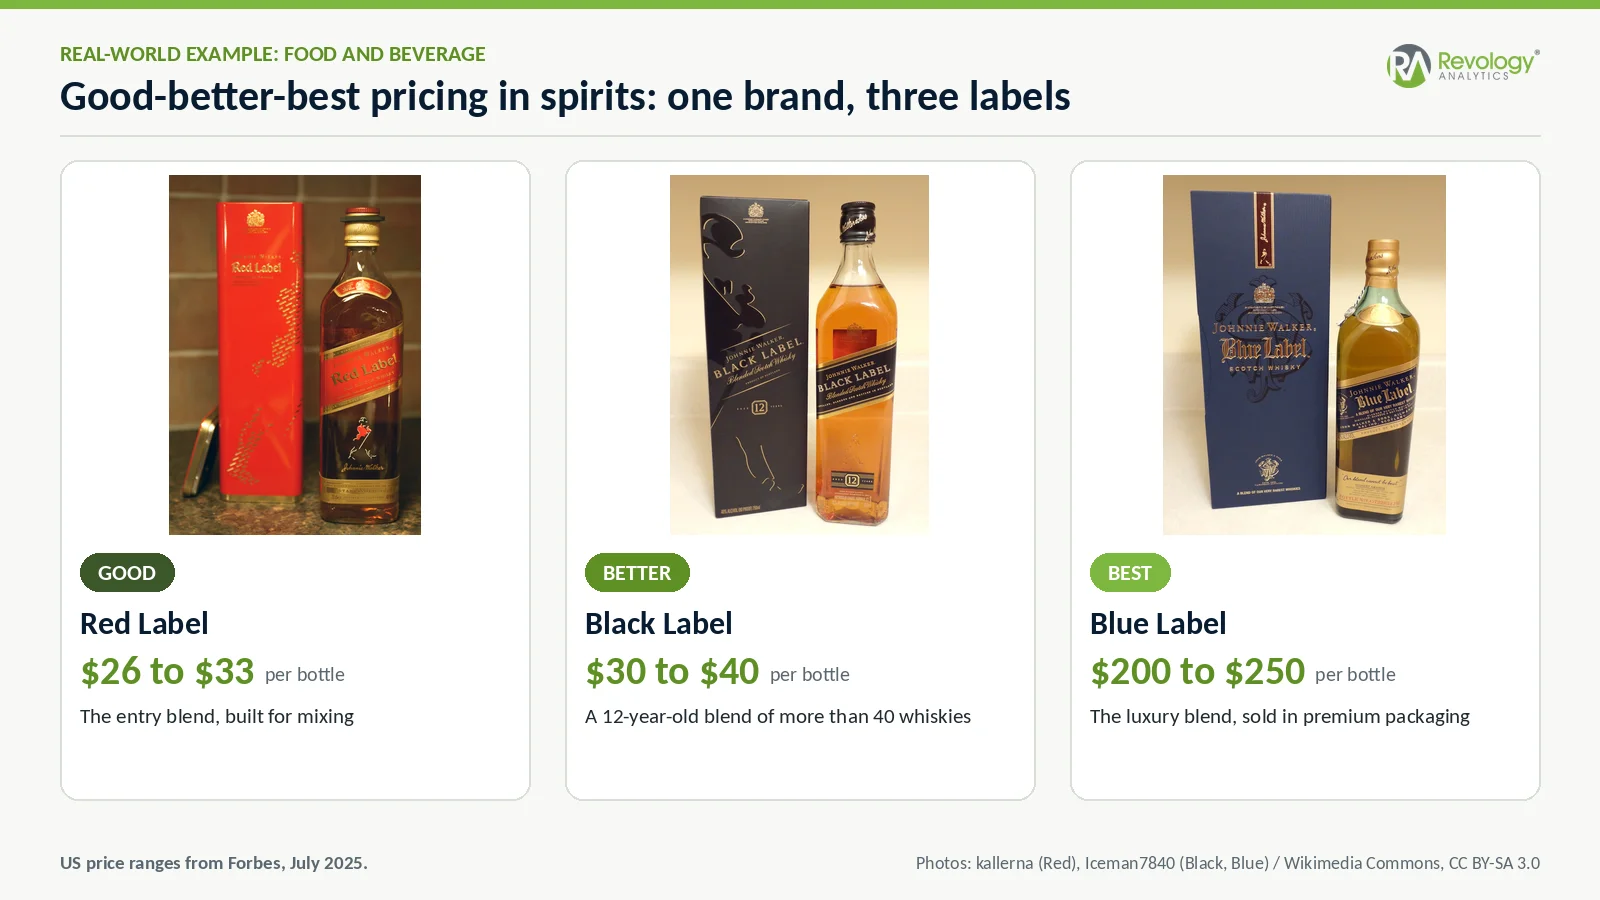
Johnnie Walker uses good-better-best pricing for a single brand, with a color-coded ladder. Red Label, the entry blend, sells for about $26 to $33 per bottle; Black Label, a 12-year-old blend, for about $30 to $40 per bottle; and Blue Label for about $200 to $250 per bottle (Forbes). The label color does the fencing: buyers can see what each step buys, from Black Label’s 12-year age statement to Blue Label’s premium packaging, before they compare prices.
Industrial, retail, and Revology examples
In B2B, good-better-best pricing tends to hide in price lists and service contracts rather than on a shelf. Public cases and our own work:
• Industrial materials (Xiameter). A no-frills, online-only brand for standard silicones, fenced by order minimums, lead times, and no custom technical support.
• Beer (Busch). A fighter brand at half Budweiser’s wholesale price, launched to block regional discounters.
• Auto parts retail (AutoZone). Duralast, Duralast Gold, and Duralast Platinum batteries are differentiated by technology, vehicle fit, and warranty length.
• Grocery private label (Walmart and Kroger). Walmart added bettergoods above Great Value; Kroger stepped from Smart Way to the Kroger brand to Private Selection.
• Pharmaceuticals (Revology engagement). Inverted pack and strength ladders reset to a 2.5x step between pack tiers, within a portfolio review sized at a median of $7.5 million to $8 million in annualized net pricing opportunity.
• Consumer storage hardware (Revology engagement). For a $200 million business, SKUs were grouped into good, better, and best price bins by capacity and form factor before elasticity modeling; the sizing showed a 1 to 3% net price realization gain worth $2 million to $6 million of net revenue.
• Auto service and tire retail (Revology work). Tire lines from Tier 1 premium brands to Tier 4 budget brands, priced with competitive index bands by trade area, such as 100 to 105 in affluent, high-competition areas; our white paper for auto service and tire retailers walks through the approach.
Five Good-Better-Best Pricing Mistakes That Cost Margin
Most failed good-better-best pricing launches trace back to one of five mistakes.
1. Building the lineup around a decoy. The evidence for decoys in real purchase decisions is thin. Design every tier to be bought.
2. Making Good a cheaper Better. A Good tier with Better’s content and a lower price is a discount with a new name, and your best customers will find it.
3. Setting the gaps with cost-plus. Price the upgrade from Better to Best on what it is worth to the buyer, which can be far above what it costs to deliver.
4. Letting Sales rebuild the price list deal by deal. Without approval rules, entitlements enforced in the systems, and incentives tied to margin, the fences wear away with every exception.
5. Adding tiers instead of add-ons. In Iyengar and Lepper’s well-known jam study, 30% of shoppers who stopped at a six-jam display bought a jar, compared with 3% at a 24-jam display. Some pricing advisers now argue the three-box model is fading because buyers resist paying for features they will not use. Our answer: keep three core tiers and put the extras on a short add-on menu.
How to Measure Whether Your Good-Better-Best Pricing Is Working
Judge your good-better-best pricing every month on eight numbers, each read tier by tier:
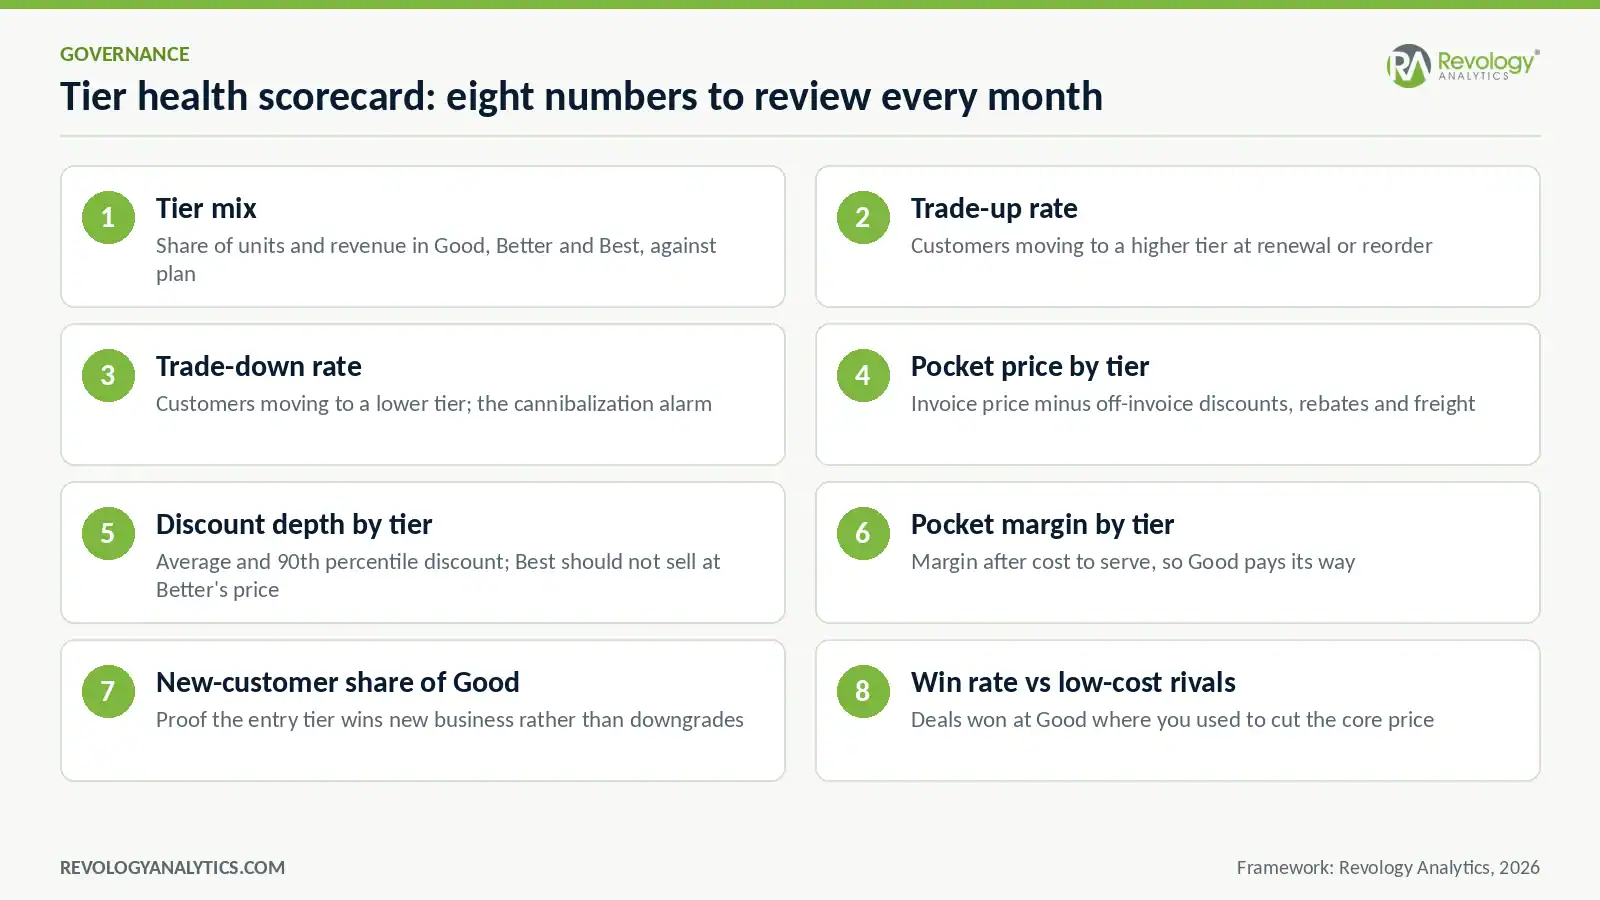
• Tier mix. Share of units and revenue in each tier, against plan.
• Trade-up rate. Customers moving to a higher tier at renewal or reorder.
• Trade-down rate. Customers moving to a lower tier; this is the cannibalization alarm.
• Pocket price by tier. Invoice price minus off-invoice discounts, rebates, and freight.
• Discount depth by tier. The average and the 90th percentile; Best should never sell at Better’s price.
• Pocket margin by tier. Margin after cost to serve, so the Good tier pays its way.
• New customer share of Good. Prove the entry tier wins new business rather than downgrades.
• Win rate against low-cost rivals. Deals won at Good, where you used to cut the core price.
Establish and maintain a regular review schedule: conduct monthly tier-mix reviews, quarterly audits of fence compliance, and annual updates to segmentation and choice models. Use these models to inform decisions, but retain final authority over fences and exceptions with P&L owners.
Good-Better-Best Pricing FAQs
What is good-better-best pricing?
Good-better-best pricing is a pricing architecture that offers three versions of a single core product or service at stepped prices. Fences such as features, service levels, warranties, and terms separate the tiers, so each customer picks the version that matches its willingness to pay.
What is an example of good-better-best pricing?
AutoZone’s Duralast, Duralast Gold, and Duralast Platinum batteries are a clean example, stepped by technology and by two-, three-, and four-year warranties. In B2B, a machine sold in standard, extended-warranty, and monitored versions is the same idea.
Why does good-better-best pricing work?
Buyers avoid extremes, so a credible premium tier makes the middle tier look sensible, and each segment pays closer to what the offer is worth to it. The lineup also lets you counter low-cost rivals with a fenced Good tier rather than a price cut on your core product.
How many tiers should you offer?
Three is the right default for most good-better-best pricing lineups. When some customers need more, add a short menu of add-ons before adding a fourth tier, because extra tiers make the choice harder and blur the lines.
How far apart should the tiers be priced?
In good-better-best pricing, the gaps should be wide enough that each price step buys a value step the customer can see. Set the gaps with measured elasticity and choice data rather than cost-plus markups, and model trade-up and trade-down before launch.
Does good-better-best pricing work in B2B?
Yes, and often better than in consumer markets, because B2B fences are easier to enforce: service levels, warranties, lead times, order minimums, and contract terms. The risk is Sales waiving those fences to close deals, so B2B lineups need approval rules and incentives tied to margin.
How do you stop the Good tier from cannibalizing the Better tier?
Take value out of Good along with price: fewer features, standard lead times, self-service ordering, and no custom support. Then model the trade-down before launch and track it monthly after.
What is the difference between good-better-best pricing and tiered pricing?
Volume-tiered pricing changes the per-unit price based on how much a customer buys; the product stays the same. Good-better-best pricing changes what the customer gets, and the price follows the value.
Key Takeaways
• Good-better-best pricing works when fences, not discounts, separate the tiers.
• Design the Better tier first; it should be the answer most buyers pick.
• Make the Best tier a product some customers buy, and cut value from Good along with price.
• Model trade-up, trade-down, and new-customer volume before launch; the same volume gain can raise or cut gross profit.
• Govern tier mix, discount depth by tier, and sales incentives every month.
How Revology Helps You Design and Govern Price Tiers
Revology’s Pricing Strategy and Monetization work covers the full lineup: willingness-to-pay segmentation, fence design, choice modeling and elasticity, a tier-migration model built on your own transactions, and the governance that keeps tiers apart, from deal desk thresholds to entitlements enforced in the quoting system and incentive design. We build it inside your commercial team over a 90- to 120-day engagement, so the models and the scorecard stay with you when we leave, and our clients typically realize 200 to 400 basis points of gross profit improvement in year one.
If your lineup grew one product at a time, or your best customers are buying your premium product at your middle price, talk to our team about a price architecture review of your good-better-best pricing.
Author: Armin Kakas, armin@revologyanalytics.com, revologyanalytics.com
Copyright 2026 Revology Analytics.
Want a second opinion on your pricing?
Tell us what’s going on with your pricing. One of our partners will get back to you the same day or the next.






