


For pricing and RGM leaders: what reference pricing is, how internal and external reference prices shape what buyers will pay, and how to manage price anchors across CPG, pharma, and retail without bleeding share.
Table of Contents
Every price you publish gets judged against a price you may not control. Reference pricing is the discipline of managing that comparison instead of leaving it to chance, and in 2026, it deserves a permanent place on your revenue growth management (RGM) agenda. Reference pricing is the practice of setting or judging a price against a benchmark (the reference price) that buyers, payers, or regulators use to decide whether an offer is fair. In consumer markets that benchmark lives in shoppers’ memories and on shelf tags, in pharmaceuticals, it is often written into law through external reference pricing.
We call the underlying problem anchor drift: the quiet divergence between the price you set and the reference buyers actually use. A brand team prices off the list. The shopper prices off the $11.99 they saw on promotion three weeks ago. A ministry of health prices off a basket of ex-factory prices in neighboring countries. When those references move, and your price architecture does not, margin leaks in ways your P&L will not explain until the damage is done.
Definition: Reference price. The internal or external benchmark a buyer compares an offer against: a remembered past price, a was/now tag, a competitor’s shelf price, or a government-mandated basket of prices in other countries.
This guide walks through the behavioral science, three anonymized client examples with real numbers, and a build sequence you can start this quarter.
What Is Reference Pricing?
Reference pricing shows up in two very different conversations, and confusing them costs credibility in the boardroom.
In commercial and marketing contexts, reference pricing means using a benchmark price to frame value: an MSRP next to a street price, a was/now tag, a competitor comparison on the shelf, or the price a shopper remembers from last month. The benchmark shapes willingness to pay before any rational evaluation happens.
In pharmaceutical and policy contexts, external reference pricing (also called international reference pricing) is a regulatory mechanism: a payer sets or negotiates drug prices against a basket of prices for the same product in other countries. As of 2019, 23 of 27 EU member states used some form of it, and reference baskets range from a single country to 38, according to the Commonwealth Fund’s issue brief on external reference pricing. The Congressional Budget Office scored a US proposal tying Medicare prices to international benchmarks at about $450 billion in savings over ten years, a number that tells you how much pricing power sits inside the reference mechanism itself.
Same word, two regimes. One is psychology, the other is law. A working reference pricing discipline handles both, because a global portfolio touches both.
Internal vs. External Reference Prices
The classic behavioral split:
- Internal reference price: the benchmark stored in the buyer’s memory, built from past purchases, shopping frequency, and brand familiarity. Nobody sees it, which is what makes it dangerous.
- External reference price: the benchmark you (or a competitor, retailer, or regulator) place in front of the buyer: MSRP, MAP, was/now tags, a competitor’s shelf price, a reimbursement ceiling.
Internal references move slowly and asymmetrically. External references move at the speed of a shelf tag or a pricing algorithm. Your architecture has to account for both, and for the fact that heavy promotion actively rewrites the internal one. Run a deep discount often enough, and the deal price becomes the reference price. That is baseline erosion, the classic failure mode of undisciplined high-low pricing, and it is self-inflicted.
The Behavioral Science Behind Price Anchors
Three findings from behavioral economics do most of the work here:
- Anchoring. Buyers evaluate prices relative to a starting point, even an arbitrary one. The first credible number frames everything after it.
- Loss aversion. In prospect theory terms (Kahneman and Tversky’s framework), a price above the reference point registers as a loss; a price below it registers as a gain. Losses hurt roughly twice as much as equivalent gains feel good, which is why price increases above the reference get punished harder than discounts get rewarded.
- Selective memory. Shoppers hold accurate internal references for a surprisingly narrow set of items, the key value items (KVIs) they buy frequently. McKinsey’s research on retail price perception suggests well-chosen KVIs represent 15-25% of category sales, driven by purchase frequency and price visibility. Everything else is fog.
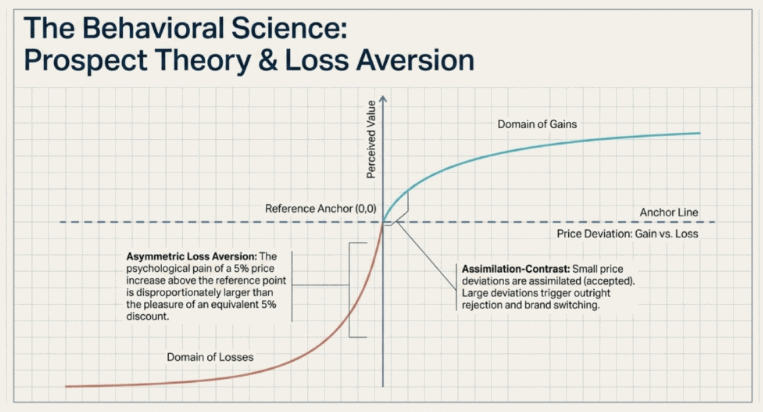
Prospect theory value curve showing asymmetric loss aversion around the reference price anchor
The asymmetry is the strategic gift. If shoppers only track a subset of prices closely, you can defend price image where memory is sharp and recover margin where it is not. KVI-based retail pricing runs entirely on this logic, and it only works if you know which reference prices actually exist in your buyers’ heads.
Why Reference Prices Decide Your Margin Before You Do
Key Insight: According to Revology’s analysis of roughly 2,000 public companies, a 1% price increase produces a 6.4% median lift in operating profit, with wide variation by sector. (Source: Pricing Still Packs a Punch, Revology Analytics, June 2025.)
Reference prices are where that leverage is won or lost, for four reasons:
- They gate every increase. Raise price above the buyer’s reference, and volume risk concentrates exactly where loss aversion bites. Raise it beneath a rising competitor reference, and nobody notices. Timing against the reference, not the calendar, is the skill.
- They reprice your promotions without asking. Promo depth is measured off a baseline. If over-promotion has dragged the internal reference down, your “20% off” is really 20% off a price nobody believes anymore. The classic decomposition in the Journal of Marketing Research (van Heerde, Gupta, and Wittink, 2003) puts roughly 84% of promotional lift down to brand switching and pantry loading rather than true incremental category demand. Our own CPG casework keeps reproducing that split, so a promo that also erodes the reference price destroys value twice.
- They set regulatory ceilings. In external reference pricing markets, one aggressive discount in one country can propagate through reference baskets and cap prices across a region. Parallel trade does the same job through arbitrage.
- They anchor retailer negotiations. Price image drives the retailer conversation. McKinsey’s retail price-perception work shows grocery chains adding 1.5 to 2 percentage points of margin by re-anchoring investment into the items shoppers actually remember.
Anchor drift compounds through all four channels at once. The companies that win treat reference prices as a managed asset, with owners, data, and guardrails. The ones that lose discover their real reference prices during a failed price increase.
Reference Pricing in Practice Across CPG, Pharma, and Retail
Three anonymized engagements show what managing the reference actually looks like. (All client details are anonymized; figures are directional and rounded.)
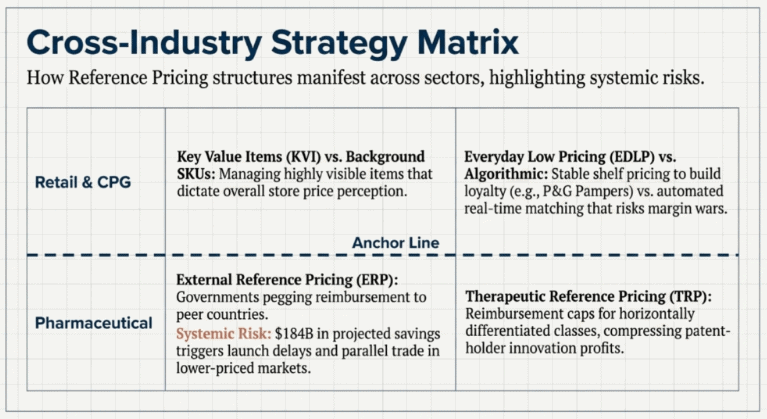
Reference pricing framework showing internal and external reference prices across CPG, pharma, and retail
CPG: Promoted Price Points Are the Real Reference Price
A national sparkling-beverage manufacturer had some 60 ad-hoc price tiers acting as manual funding envelopes, with distributor off-invoice ratios swinging from 30-70% and about $5 million a year in unplanned funding exceptions. Every day, the promoted prices had drifted into each other, so the promoted price was becoming the reference price.
The fix treated promo price points as protected anchors. The 12-pack sells at $11.99 on a deal, and that number is never offered as an everyday price. Deep one-dollar-per-unit deals got capped at four weeks a year for national accounts and zero for secondary ones. Tier architecture collapsed from 60 to 20-25 harmonized tiers. Channel relativities were locked in as guardrails: club at least 15% below grocery, mass 8-10% below, competitive index moves capped at 12 points with an absolute ceiling of 112.
Results: a 10-for-$10 multibuy delivered a 40.3% lift at a 1.97x return, shallow-but-frequent events replaced value-destroying deep cuts, and price-pack architecture work sized $3-4 million of gross profit with a path to 4.5% better net price realization (NPR, the share of list price a company actually banks). The aggressive scenario models +2.2% retail sales and +7.3% gross profit. For more on the retail-facing side of reference pricing, see our guide to retailer pricing frameworks and KPIs.
Pharma: External Reference Pricing and Price Corridors
A global pharmaceutical manufacturer’s emerging-markets division (about $5 billion in revenue) faced the regulatory version of the problem: external and international reference pricing ceilings, parallel-trade risk across borders, and competitor benchmarking muddied by dozens of formulations, strengths, and pack sizes. Its own pack ladders had inverted in places. When a product’s strength doubled, competitors raised prices 58-100%; the client managed only 56-92%, giving margin away on its strongest SKUs.
The methodology was built to make every move defensible against a reference:
- A Product Equivalence Matrix matched true therapeutic substitutes across internal and syndicated data.
- An equivalized competitive price index normalized everything to price per defined daily dose, volume-weighted against competitor ex-factory prices.
- Double Machine Learning (DoubleML) elasticity models separated real demand response from market noise, the approach we describe in our DoubleML price elasticity guide.
- A scenario simulator capped recommendations at the 90th percentile of historical market price moves (13-36% depending on market), so no recommendation outran what regulators and local teams had already seen the market absorb.
The pilot across four markets sized about $11.2 million in annualized revenue: $5.8 million from direct price corrections and $5.4 million from white-space pack introductions. One digestive-health brand with a dominant share held a 26-49 index-point price premium (an index of 126-149 vs. competitors) after its ladder was rebuilt to a 2.5x strength ratio, worth about $3.95 million. A women’s health brand raised prices 12% against competitors’ 6.7% and still gained about 4.6 share points. Another SKU took a 70% increase and nearly doubled its share, because the reference math showed it had been badly underpriced for years.
See how your pricing compares
Our 2025 report looks at how more than 150 business leaders handle pricing and promotions. See what the best companies do differently, and where most fall short.
Retail and E-commerce: When Algorithms Move the Anchor
A global data-storage manufacturer selling through Amazon and major retailers had lost its reference entirely: retailer algorithms constantly repriced, so the list price meant nothing. The team rebuilt the reference empirically. The everyday low price (EDLP) baseline for each SKU became the 95th percentile of actual observed consumer prices over a rolling 13-week window; anything below it counted as a promotion, and promo depth was measured off that baseline rather than off MSRP.
A 52-week seasonality index then splits the discount-driven lift from the seasonal lift. Legacy promo ROI readings of 0-20% were restated to 70-75% once Prime Day and Black Friday volume stopped being credited entirely to the discount. DoubleML plus gradient boosting, with empirical Bayes shrinkage for thin SKUs, produced elasticities leadership could trust: median own-price -1.04, promo lift +1.86, competitor cross-elasticity +0.41.
The strategic finding: for 82% of SKUs, promotional levers moved more volume than everyday price changes, so the company pivoted to surgical promotions instead of broad everyday-price cuts, with a targeted +1-3% net revenue lift and +1-2 points of EBITDA margin (roughly $3-6 million), a 10-20x first-year return on the analytics build. Understanding willingness to pay at the segment level made those trade-offs explicit rather than argued.
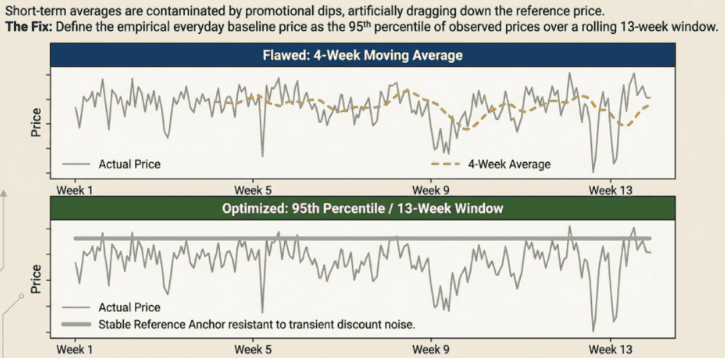
Empirical everyday baseline price methodology for reference pricing: 95th percentile of observed prices over a rolling 13-week window
How to Build Reference Pricing into Your Pricing Operating Model
You do not need a two-year transformation. The pattern that works runs in phases, usually inside 90 to 120 days for the first market or category.
Step 1: Define the reference set. Decide, per category and channel, what the true comparison basket is: which competitor SKUs, which channels, which countries (for external reference pricing exposure). This is where most programs fail first; a wrong equivalence map poisons everything downstream.
Step 2: Equivalize units. Convert to comparable units before comparing prices: price per defined daily dose in pharma, per ounce or per serving in CPG, per terabyte in tech. Pack-size math hides more anchor drift than any other single factor.
Step 3: Build the index and the empirical baseline. Compute a volume-weighted competitive price index and, for promoted categories, an empirical everyday price (the 95th-percentile method above). Our piece on competitive pricing for profitable growth covers the index construction trade-offs.
Step 4: Measure response around the reference. Estimate elasticities relative to reference points, not in a vacuum, and expect asymmetry above versus below the anchor.
Step 5: Wire in guardrails and governance. Reference pricing guardrails only work when someone owns them: floors, ceilings, corridor rules, and a cadence for review. Analytics recommends; governance decides.
A Worked Example: Your Reference Price Gap in Four Steps
Say you sell a supplement 24-pack at $28.99. Three comparable competitor packs sell at $24.99 (40% of category volume), $27.49 (35%), and $31.99 (25%).
- Weighted competitor reference = 0.40 × 24.99 + 0.35 × 27.49 + 0.25 × 31.99 = $27.61.
- Competitive price index = (28.99 ÷ 27.61) × 100 = 105.
- Reference price gap = (28.99 − 27.61) ÷ 27.61 = +5.0%.
- Decision rule. If your guardrail says the brand supports an index up to 112 (premium justified by share, loyalty, or clinical evidence), you have about 7 points of headroom; if elasticity near the anchor is steep, you bank the 105 and take the increase elsewhere. Assumptions to state explicitly: volume weights from sell-out data, prices net of promotion, and a 13-week observation window.
Key Insight: A +5.0% reference price gap at an index of 105 is not a problem to fix; it is headroom to govern. The guardrail, not the gap, decides the action.
Four steps, one spreadsheet, and suddenly the pricing committee is arguing about evidence instead of anecdotes.
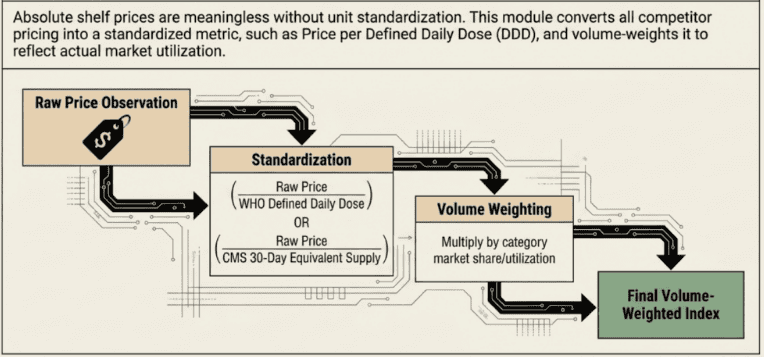
Equivalized competitive price index construction with unit standardization and volume weighting
Governance and Guardrails: Keeping Reference Prices Honest
Reference pricing fails legally before it fails commercially. Regulators on both sides of the Atlantic have fined retailers for fictitious anchors: inflated was/now tags against prices nobody ever paid. If you display a reference price, it needs to be one that the market genuinely offered, recently, and in meaningful volume.
The internal governance is just as unglamorous and just as decisive:
- Anchor integrity rules. Protected promo price points that never become everyday prices; minimum time-at-regular-price between events.
- Corridor management. For global portfolios, corridor rules that keep the gap between markets inside parallel-trade tolerance, informed by which countries reference which. RAND’s review of external reference pricing documents how basket design and revision frequency change the outcome; savings erode when references converge, so corridor strategy is a living decision, not a one-time setting.
- Decision rights and cadence. Who approves an off-guardrail price, how fast exceptions get reviewed, and which reconciliation gates catch drift (one client holds a weighted promoted shelf price within ten cents per unit of plan).
- Measurement discipline. Track NPR, index position vs. guardrail, promo depth off the empirical baseline, and share-of-volume sold on deal. When those four move together, you see anchor drift while it is still cheap to fix.
Notice what is absent: heroic AI. Models feed the guardrails; they do not replace the judgment or the cadence.
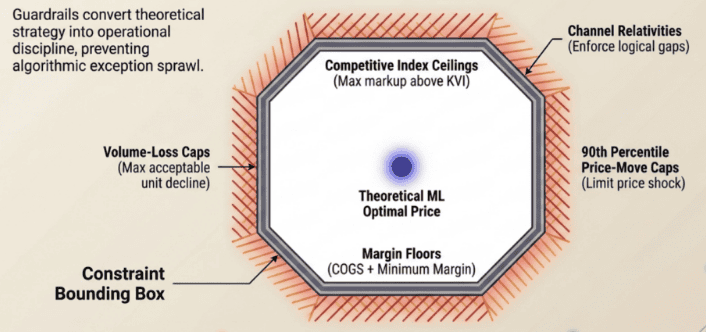
Reference pricing governance guardrails: floors, ceilings, corridors, and review cadence
Common Reference Pricing Mistakes
Four reference pricing mistakes show up in nearly every diagnostic we run:
- Treating the list price as the reference. Buyers reference what they experienced, and that is the street price. If 40% of volume moves on the deal, your effective reference sits far below the list.
- Assuming any price above the competitor reference bleeds share. The pharma case above gained 4.6 share points while raising prices at nearly twice the competitor rate. When equivalized value support exists, premiums hold.
- Discounting your way to a permanently lower anchor. Every incremental week on a deal teaches the market a new reference. The 84/16 lift decomposition should hang on the wall of every trademarking team.
- Treating external reference pricing as someone else’s problem. If you sell across borders, other people’s reference baskets are already pricing your portfolio. You either manage the corridor or discover it.
FAQs About Reference Pricing
What is reference pricing?
Reference pricing means setting or evaluating a price against a benchmark the buyer uses to judge fairness: a remembered past price, a displayed comparison (MSRP, was/now), a competitor’s price, or, in pharma, a regulated basket of international prices.
What is an example of reference pricing?
A retailer showing “was $199, now $149” is using an external reference price. A beverage brand protecting $11.99 as a promoted 12-pack anchor, never selling there every day, is managing the internal reference shoppers’ store.
What is the difference between internal and external reference prices?
An internal reference price lives in the buyer’s memory, built from past purchases. An external reference price is displayed at the moment of decision: a tag, a comparison, or a mandated ceiling. Internal references move slowly and asymmetrically; external ones move instantly.
Is reference pricing legal?
Displaying reference prices is legal when the anchor is genuine. Fictitious former prices have drawn regulatory fines in the US and EU. In healthcare, external reference pricing is itself the law in most EU markets. (US employer health plans use a cousin called reference-based pricing for provider reimbursement; that is a benefits-design topic, not the pricing discipline covered here.)
How does external reference pricing work in pharmaceuticals?
A payer benchmarks a drug’s price against a basket of prices for the same product in other countries, using rules for basket composition, calculation (average vs. lowest-price), and revision frequency. Manufacturers respond with launch sequencing and corridor management to keep cross-country gaps inside tolerance.
How do you calculate a reference price?
For competitive work: equivalize units, then compute a volume-weighted average of comparable competitor prices and index your price against it. For promoted categories: estimate the buyer’s effective reference as the everyday price actually observed, for example, the 95th percentile of transacted prices over a rolling 13-week window.
Key Takeaways and Next Steps
- Buyers, payers, and regulators all judge your price against a reference. Manage the reference, not the price alone.
- Internal and external reference prices require different levers: memory management (promo discipline, KVI strategy) versus displayed-anchor management (indices, corridors, compliance).
- The reference pricing math is not exotic: equivalence, weighted indices, empirical baselines, elasticity around the anchor. The discipline is guardrails plus cadence.
- The proof carries numbers: +4.6 share points during an aggressive increase, 40.3% lift at 1.97x ROI from protected anchors, and 82% of a portfolio re-aimed at the levers that actually move volume.
- A 1% price increase is worth 6.4% in operating profit for the median firm. Reference prices are where that gain is defended.
If anchor drift sounds familiar, the fastest path to clarity is a reference price gap audit on your top revenue SKUs: two to three weeks to map equivalents, build the index, and size the corrections. Our Pricing and Revenue Growth Management advisory team runs these as the front end of a 90-to-120-day capability build, and the models stay with your team when we leave. Bring your messiest category; that is usually where the money is.
Want a second opinion on your pricing?
Tell us what’s going on with your pricing. One of our partners will get back to you the same day or the next.






