
Our latest article for CFOs, commercial leaders, and small pricing teams at $100M to $2B consumer and B2B companies. See what sits between list price and net revenue before agreeing next year’s customer terms.
If your 2027 plan includes a price increase, how much will you keep after discounts, rebates, and customer allowances? Sales and finance should be able to answer that for each major customer, because those terms can vary widely from one account to the next.
Take an illustrative business with $200M in gross sales. Each additional percentage point of gross-to-net deductions reduces net revenue by $2M. If the plan assumes deductions of 20% of gross sales and the year ends at 22%, net revenue is $4M below plan, even though gross sales and volume haven’t changed.
Gross to net is the total of the deductions between gross sales at list price and the net revenue you recognize. Those deductions include on-invoice discounts, off-invoice trade, rebates, allowances, and customer fees that reduce revenue. The bridge shows how they add up. A deduction may be commercially justified. Check it against the agreement and the commercial benefit it paid for before calling it leakage.
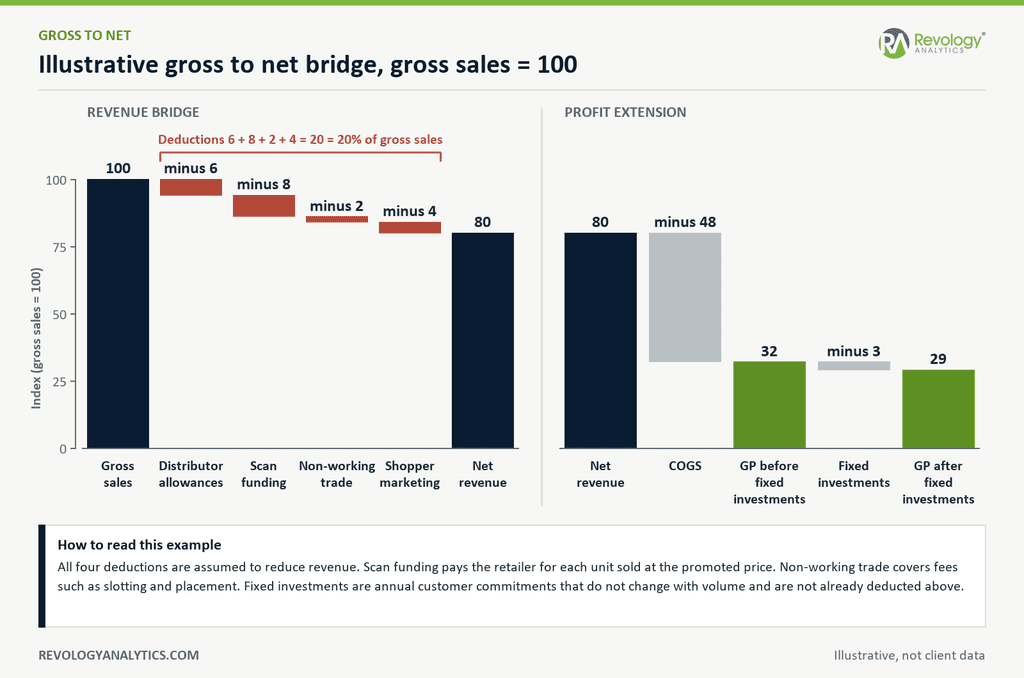
Figure 1. Illustrative gross to net bridge. Gross sales of 100 less distributor allowances of 6, scan funding of 8, non-working trade of 2, and shopper marketing of 4 leave net revenue of 80, so deductions equal 20% of gross sales. Subtracting COGS of 48 leaves gross profit of 32 before fixed investments, and fixed investments of 3 leave 29. The example assumes all four deductions reduce revenue and that fixed investments are not already included above.
A gross-to-net bridge helps you explain a gap like that $4M by customer and product. A small pricing team can build the first version in Excel. What matters is that sales and finance agree on the definitions, how spend is allocated, and who keeps the numbers current.
The numerical examples are illustrative. The anonymized situations describe issues we encountered in past work and the decisions they raised.
For the broader CPG approach, our free guide, How to Build the Pricing & RGM Analytics Navigator for Your CPG Business, covers six modules on the data, customer views, and trade analytics needed to see true net price. Download the guide.
Table of Contents
How Gross to Net Relates to the Price Waterfall
Our price waterfall guide follows the deductions from list price to pocket price. A gross-to-net bridge applies the same logic to customer planning and financial reporting. For the 2027 plan, show the deductions you expect for each customer, then reconcile the result to the net revenue finance reports.
Under US accounting rules, payments to customers generally reduce revenue. Payments for a distinct good or service need a separate assessment, including fair value. The finance team should confirm the treatment. Calling a payment non-working trade or shopper marketing doesn’t decide where it sits in the accounts.
Hershey’s 2025 filing describes net sales after estimated promotional costs. PepsiCo’s 2025 filing explains how annual customer incentives are accrued as products are delivered and settled later. The revenue plan needs to account for these deductions, even when settlement comes later.
Agree on the Revenue Lines
Before comparing the plan with actuals, ask sales and finance what they mean by gross, net, and dead net. Agree on what each line includes.
- Gross sales. Units multiplied by the agreed list price, before deductions. If your system starts from invoice value, identify the on-invoice discounts it has already removed.
- Net revenue. Gross sales less the discounts, rebates, allowances, and other items classified as revenue reductions. It should use the same accounting basis as that used for reported net sales.
- Net net or dead net. An internal label some teams use for revenue after all agreed commercial deductions. Define what it includes and reconcile any difference from reported net revenue.
Keep cash collected separate. Payment timing and unsettled claims can make cash differ from recognized revenue. If sales and finance start from different revenue lines, they can each follow their own definitions and still produce materially different plans.
Be Clear About What Creates the Pricing Benefit
A list increase, a net price increase, and a reduction in gross to net are related, but each requires a different action. Make clear which one the customer plan depends on.
- A list increase changes the starting price. Recalculate any discounts and rebates tied to it before assuming how much of the increase reaches net revenue.
- A net price increase raises the revenue you retain per unit after deductions. Track that result in the pricing plan.
- A gross-to-net reduction lowers deductions while list price stays the same. If a tender or contract prevents a list increase, renegotiating eligible allowances may be one of the few options available.
Show the expected effect for each customer and when the new terms take effect. The finance team can then reflect it in the forecast, and sales knows what it needs to negotiate.
In a prior distributor review, invoice prices had risen alongside supplier costs, while margin rates for a comparable basket of products remained broadly stable. The higher selling prices hadn’t demonstrated an improvement in the margin rate. The analysis separated product net price from supplier-cost changes and tracked freight and fees separately. Actual invoices would show whether a proposed price improvement had been achieved after implementation.
The Layers Between List Price and Profit
Start with the sequence below, then check each discount and allowance against the contract. Two percentages may apply to different price bases, so you can’t assume they can simply be added together.
- List or gross price. The starting price for the product and channel, before deductions.
- On-invoice discounts. Subtract volume discounts, order-tier discounts, contract allowances, and other reductions taken directly on the invoice. What remains is the invoice price.
- Off-invoice trade and allowances. Depending on the agreement, these may include distributor allowances, scan funding (a payment to the retailer for each unit sold at the promoted price), feature and display support, co-op funds, growth and volume rebates, cash terms, and logistics allowances. They also include non-working trade, such as slotting and placement fees, and shopper marketing paid to the retailer. Many are accrued before the customer settles them through a short payment, billback, or claim. Subtract the items classified as revenue reductions to reach net revenue.
- COGS and fixed investments. Subtract cost of goods sold (COGS) from net revenue to reach gross profit before fixed investments. Then subtract fixed investments, the annual customer commitments that don’t change with volume and aren’t already in the deductions above, to reach gross profit after fixed investments. That last line is a management view for comparing customers. Count each cost once.
Figure 1 shows four deductions. Your bridge may also carry invoice discounts, rebates, payment terms, or freight allowances.
When You Sell Directly to the Customer
For a direct retailer account, start with list sales, meaning gross sales at list price, and subtract the funding you give that retailer. In Figure 2, that is scan funding and shopper marketing; your agreement may add invoice discounts or rebates. Assigning that later spend to products is often the harder part. An invoice discount may include a material code in the ERP, whereas a customer claim may arrive without a SKU. Without an agreed allocation rule, you can see what the account spent but still miss which products carried the cost.
When You Sell Through a Distributor or DSD Partner
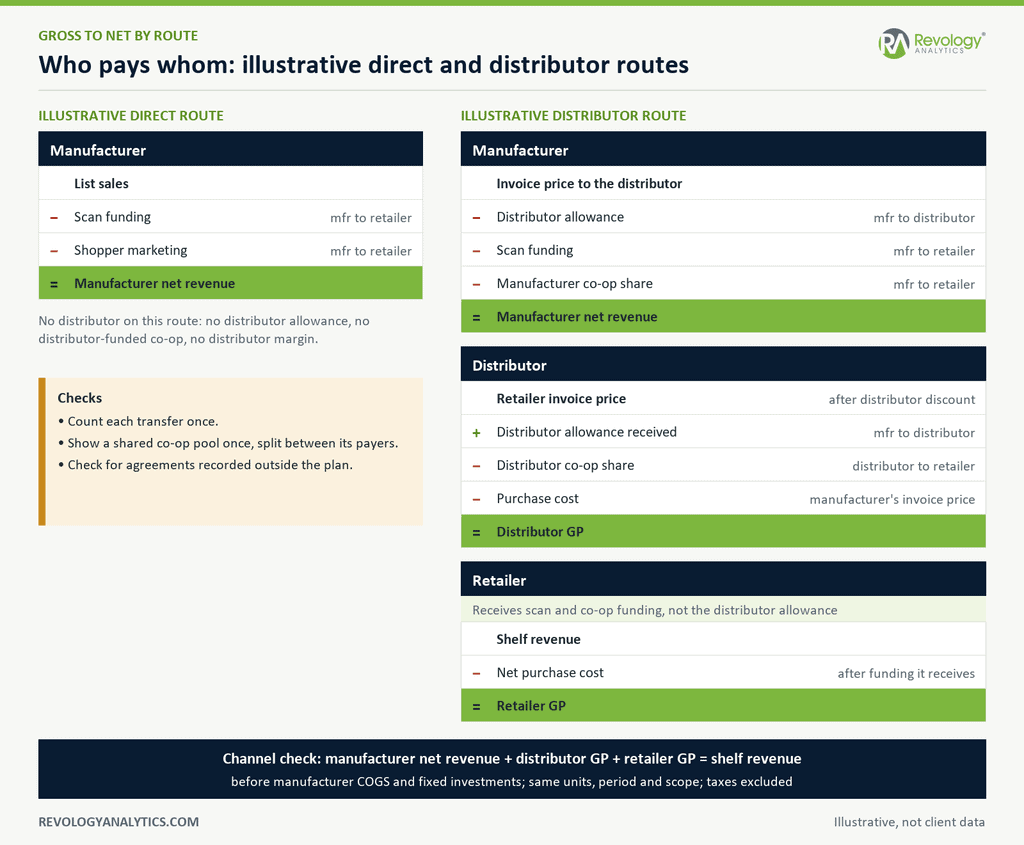
Figure 2. Illustrative economics by route. Identify who pays and who receives each amount, and count each transfer once. Each route shows typical funding, not a complete list. The check at the bottom holds only when all three parties are measured in the same units, period, and scope, with taxes excluded.
When you sell through a distributor, start the manufacturer’s bridge at its invoice price to the distributor. Identify who pays and who receives each allowance. Manufacturer net revenue is that invoice price less the distributor allowance, the scan funding paid to the retailer, and the manufacturer’s own share of any co-op. The distributor’s discount to the retailer and the distributor’s share of co-op belong in the distributor’s economics.
For the distributor, start with what it invoices the retailer, add the manufacturer’s allowance, then subtract its own co-op funding and what it paid the manufacturer for the product. That is distributor gross profit. You can show the allowance as a lower product cost instead, but count it once.
For the retailer, gross profit is shelf revenue less net purchase cost, after the funding the retailer actually receives.
Figure 2 ends with a simple check: across the three parties, the pieces should add back to shelf revenue.
Where Sales and Finance Lose Track of Deductions
Sales negotiates a deduction, finance accrues it, and accounts receivable may settle it months later. When those records don’t connect, it becomes difficult to explain what the customer actually cost. Start by checking these six areas.
- Different definitions of net. Sales may quote net after promotional funding while finance reports net after every revenue deduction. One report may divide trade by gross sales and another by net sales. Agree on the line and the denominator before trying to explain a gap.
- Off-invoice spend without a product. An account total shows what was spent, but it doesn’t indicate which SKUs received support or whether the investment was productive. That can hide differences in product profitability.
- Accruals treated as final costs. Month-end accruals are estimates and may be held at region or company level. Until they are allocated and reconciled to settled claims, the customer view can make expected spend look final.
- Late or bundled deductions. A retailer may claim several events together weeks after they ran. Keep estimates and settled claims distinguishable so the team can see where timing explains a difference.
- Distributor agreements missing from the plan. In one consumer goods pricing review, special allowances sat outside the standard terms, and one distributor was missing from the main reporting feed. The review called for a complete register of agreements, showing eligible cases, the funding rate, and total expected cost separately. The standard price file didn’t capture the full commitment.
- Inconsistent treatment of freight and fees. Freight, broker fees, and customer allowances may sit in different accounts or reporting lines. If sales and finance map them differently, a change in the reported gross-to-net rate may stem from classification rather than commercial terms.
The bridge should help the team decide what to do next. Check an unmatched claim against the agreement and eligible volume. Correct a misclassified fee, and review an accrual when the estimate is out of date. Even a valid allowance may deserve a discussion about what the business gets in return. Investigate any gap between expected and recorded deductions, and confirm the evidence before pursuing a recovery.
Why Accrual Timing Matters
In one consumer products engagement, the team described repeating a promotion while deductions from the earlier event were still outstanding. When the remaining charges arrived, the earlier promotion showed a negative return. Sales were visible before the full cost was known. To avoid planning based on an incomplete result, keep an estimate of total spend alongside records of what has settled and what remains open.
Suppose a promotion runs in March and finance accrues its expected cost at month-end. The first claims arrive in April. More follow in May, some bundled with other events, and the reconciliation finishes in June. For roughly three months, the event cost is still an estimate. Anyone using it to plan the next promotion needs to know what is still outstanding.
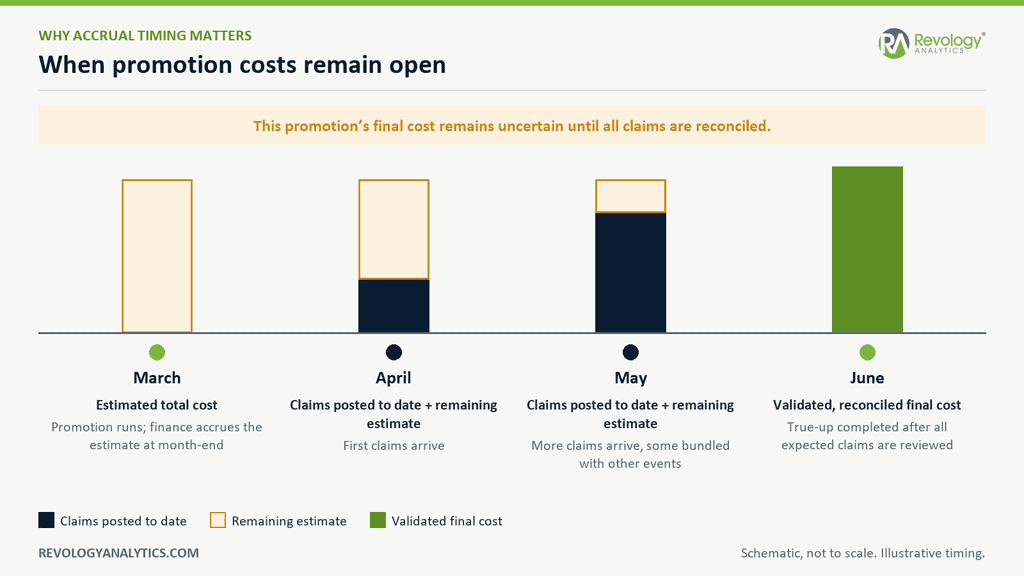
Figure 3. Illustrative reconciliation from March to June. Claims may arrive in installments. Keep posted amounts separate from the remaining estimate until expected claims have been reviewed and the true-up is complete. Receiving, validating, and settling a claim are separate stages.
For each event, show the estimated total cost, validated claims, amount settled, and remaining expected liability. Keep disputed amounts separate, with an owner and supporting evidence. Receiving a claim doesn’t mean it has been validated, and settling part of it doesn’t close the event.
For example, suppose the team has accrued $100,000 for an event. After reviewing all claims, finance validates a final cost of $108,000. The additional expense is an $8,000 true-up; payments settle the accrued liability. If some claims remain disputed or additional charges are expected, keep that uncertainty visible until the event is finalized.
Build the 2027 Gross to Net Bridge in Six Steps
Build a shared bridge for each key customer before agreeing 2027 terms. The first version can take several weeks while the team maps accounts and resolves definitions. With reliable inputs and stable rules, the monthly refresh can take a few days.
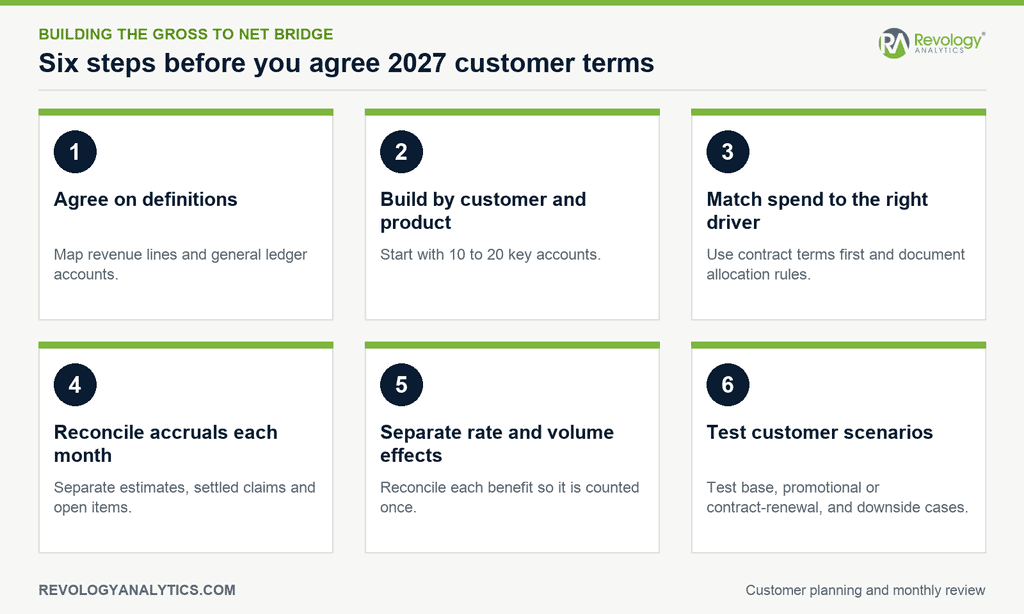
Figure 4. Six steps to build and maintain a customer bridge that sales and finance can use together. Adapt the scenarios to the customer’s commercial model and count each benefit once.
Step 1: Agree on Definitions and Account Mappings
Maintain one reference that defines each revenue line and the general ledger accounts feeding it. Map on-invoice discounts, working trade such as scan funding, non-working trade such as slotting, and costs below net revenue without overlap. State the denominator for every ratio, so “trade rate” means the same thing in both teams’ reports.
A catch-all “sales discount” account, for example, may need to be split into the commercial deductions it contains. Distinguish rebates received from suppliers from those paid to customers, and map each under the appropriate accounting policy. Sales and finance should be able to follow the same transaction through both reports.
Step 2: Build at the Level Where You Set Prices
If you set prices by customer and product, build the bridge at that level. A company average can hide an account whose deductions have moved well beyond plan. Start with the top 10 to 20 customers, check how much revenue they represent, and group smaller accounts for the first version.
For each customer and product, retain the eligible quantity, starting revenue basis, and invoice value. Record each deduction with its calculation basis, agreement dates, accrual and claim status, and owner. Show which amounts were matched directly and which were allocated.
Name the numerator and denominator of every rate. In Figure 1, the same 20 deductions are 20% of gross sales and 25% of net revenue.
Show each customer’s three largest deductions separately and group the rest as “all other,” with the detail available underneath. That gives sales and finance a manageable starting point for the discussion, rather than asking them to work through 30 categories at once.
Step 3: Agree How Unassigned Trade Will Be Allocated
Some trade spend arrives without a customer or product reference. Match it to a contract, event, or claim wherever possible. For the amounts you can’t match, agree on an allocation rule before reviewing the results and document why it fits the spend.
A per-case allowance is better allocated using volume or shipments than gross sales. A rebate defined as a percentage of sales needs a sales-based calculation. If every unassigned cost is spread by gross sales, higher-priced products can end up carrying more cost simply because of the allocation method.
Step 4: Reconcile Accruals and Actuals Each Month
After each close, have finance and sales compare open accruals with settled deductions by customer. Show the expected and actual spend, investigate any differences, and assign an owner to claims older than the agreed-upon threshold.
Include distributor allowances and billbacks. If deductions currently receive little scrutiny, start with the five largest customers and five largest deduction codes. Use that review to establish a process the team can maintain.
Step 5: Separate Rate Changes From Volume Changes
Lower trade spend can come from selling fewer cases, even when the cost per case has increased. In this illustrative example, a customer received $8.0M of trade on 1.0M cases last year, or $8.00 per case. This year, trade is $7.6M on 0.9M cases. Assume the product mix hasn’t changed.
- Total change. Trade fell by $0.4M, from $8.0M to $7.6M.
- Volume effect. Selling 0.1M fewer cases at the old $8.00 rate reduces trade by $0.8M.
- Rate effect. Funding increased to about $8.44 per case. Across 0.9M cases, that higher rate adds about $0.4M of trade.
Here, fewer cases explain the lower total spend. The customer received more funding per case. Separate those effects before calling the change a saving, and make sure sales and finance count the same saving once.
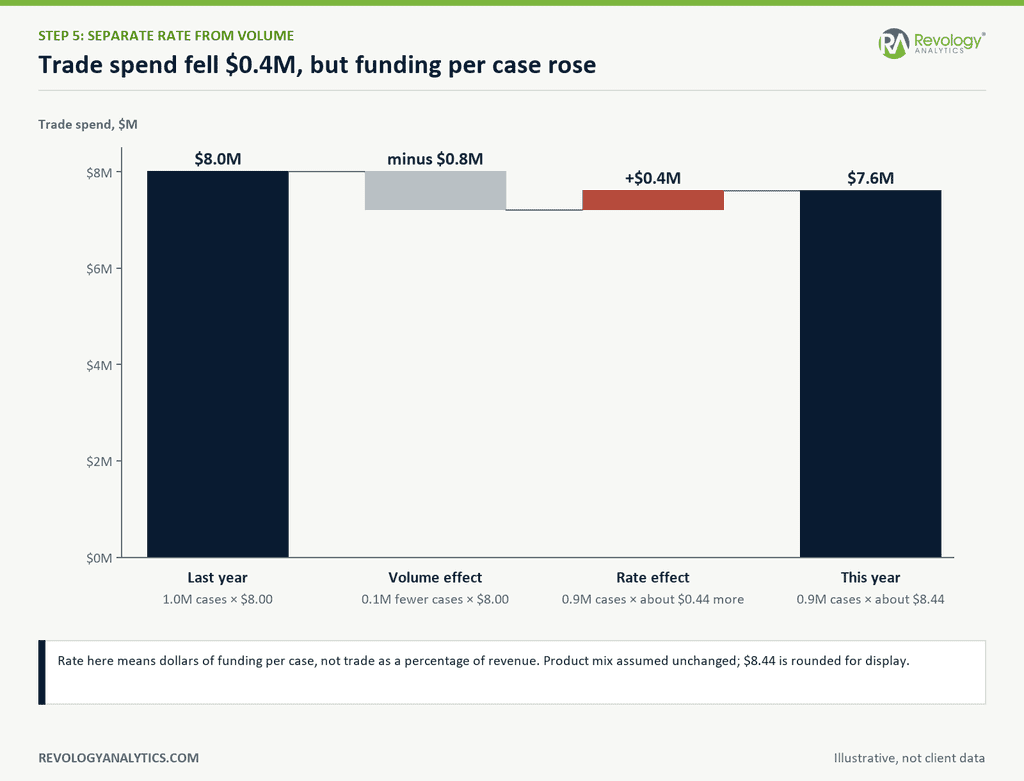
Figure 5. Illustrative change in trade spend with product mix unchanged. Lower volume reduces spend by $0.8M; higher funding per case adds $0.4M. Total spend is $0.4M lower, while average funding rises from $8.00 to about $8.44 per case. Here, rate means dollars of funding per case, which is a different measure from trade as a percentage of revenue.
Also check what happens to any freed trade budget. Reinvesting it elsewhere changes the profit benefit, as does losing volume after support is reduced.
Step 6: Test Customer Scenarios Before Agreeing Terms
Before signing 2027 terms, test each key customer under a base case and a downside case. Add a promotion or contract-renewal case where relevant. Include genuinely unplanned charges, claims above the accrual, and changes in volume or mix. Show the cash timing of unsettled deductions separately from their effect on revenue and profit. Then use the results to identify which terms need to be changed before signing.
Consider this illustrative break-even calculation. A customer buys $50M at list price. Gross-to-net deductions of 20% leave $40M in net revenue. At a 40% gross margin on net revenue, gross profit is $16M. For this simplified model, assume the product mix and unit costs remain unchanged, with the cost of goods and trade spend scaling with volume.
- Reduce off-invoice trade by one percentage point of gross sales. If volume holds, net revenue increases by $0.5M.
- With costs unchanged at that volume, gross profit rises from $16M to $16.5M.
- Divide the $0.5M gain by $16.5M to find the break-even volume loss: about 3%. At that volume decline, gross profit returns to $16M.
Under those assumptions, losing more than about 3% of volume leaves the business worse off after the trade reduction. A higher starting margin leaves less room, because each lost case carries more profit. The threshold moves if some costs stay fixed when volume falls or the customer’s product mix shifts, so rerun it with the costs that actually change.
Applying the Bridge in Pharma and Tender Markets
In pharma, start with the channel and agreement. Retail pharmacy contracts, hospital tenders, and reference-price markets can follow different commercial rules. Build each bridge around the deductions that apply to that business.
For a fixed-price contract, reconcile the agreed selling price with the applicable rebates, fees, and other adjustments. Separate obligations already in place from changes that need a new agreement. The same six steps apply, but the bridge needs to reflect the country, channel, and contract you’re assessing.
Who Maintains the Bridge
Sales brings the customer agreements and planned activity. The finance team brings the accounting treatment, accruals, and settled deductions. Without the commercial detail, the bridge is difficult to use in negotiations. Without a reconciliation to the books, it can’t support the forecast.
Maintain the definitions together, agree on one bridge for each key customer, and review it monthly. Build it in your own environment, with calculations the team can explain and rerun. Use that foundation for the customer P&L, promotion scorecard, and price realization tracking, so each analysis starts from the same revenue and trade numbers.
The potential effect on profit is worth examining. Research cited in our 2025 Revenue Growth Analytics Maturity Report, covering approximately 2,000 public companies, puts the median operating-profit sensitivity to a 1% price improvement at about 6.4%, with volume and costs held constant. Recovering deductions would have the same modeled effect if it produced an equivalent improvement in net revenue without additional costs or lost volume.
Gross to Net FAQs
What Is Gross to Net?
Gross to net is the total of deductions between gross sales at list price and recognized net revenue. It includes discounts, rebates, allowances, and customer fees that reduce revenue. A bridge by customer and product shows how those deductions add up and which ones explain a difference from plan.
How Does Gross to Net Differ From a Price Waterfall?
The concepts overlap. A price waterfall shows deductions from the list price to a defined endpoint, such as the pocket price. A gross-to-net bridge uses that view for revenue planning and reporting. Define the endpoint and reconcile it to the books so different labels don’t create competing versions of the numbers.
What Is a Typical Gross-to-Net Percentage?
There isn’t one useful benchmark across companies. Channel mix, promotional intensity, distributor terms, and accounting definitions all affect the rate. Start by comparing the same customer over time consistently. If the rate is rising while volume is flat, investigate what changed before turning to an industry average.
How Often Should Trade Accruals Be Reconciled?
Start with a monthly review after close. During heavy promotion periods, a weekly review may help if claims arrive quickly enough to act on. Waiting until quarter-end can mean planning several new events while the costs of earlier ones are still estimates.
Where Does Freight Belong?
Have finance confirm the treatment under the applicable accounting policy and record it in the shared definitions. Distinguish a freight allowance paid to a customer from freight costs paid to a carrier. Keep freight and broker fees visible in the profitability analysis, and count each once.
Before You Sign Off on the Plan
- Identify whether each customer plan depends on a list increase, higher net price, or lower gross-to-net deductions.
- Agree on revenue definitions, ledger mappings, and the denominator for every trade rate.
- Build key customer bridges at the product level where pricing decisions are made.
- Document allocation rules that follow the agreement and the driver of the spend.
- Reconcile accruals and actual deductions monthly, with an owner for each open item.
- Separate rate, volume, and, where relevant, mix effects before claiming savings.
- Test base, promotional, or contract-renewal, and downside scenarios before committing to customer terms.
How Revology Helps
We help sales, finance, and pricing teams build agross-to-nett process they can keep running. That means agreeing on definitions, building gross-to-net bridges by customer and product, setting allocation rules, and putting a monthly reconciliation in place. We build the analysis in your environment and work with your team on how to use and maintain it. There is no Revology license fee for the capability.
Our free guide, How to Build the Pricing & RGM Analytics Navigator for Your CPG Business, puts this work in the broader CPG context. Its six modules cover customer profitability, trade, and related commercial analytics. Download the guide.
If you’re working through the net revenue assumptions behind your 2027 customer plan, talk to our team about a fixed-fee pricing diagnostic.