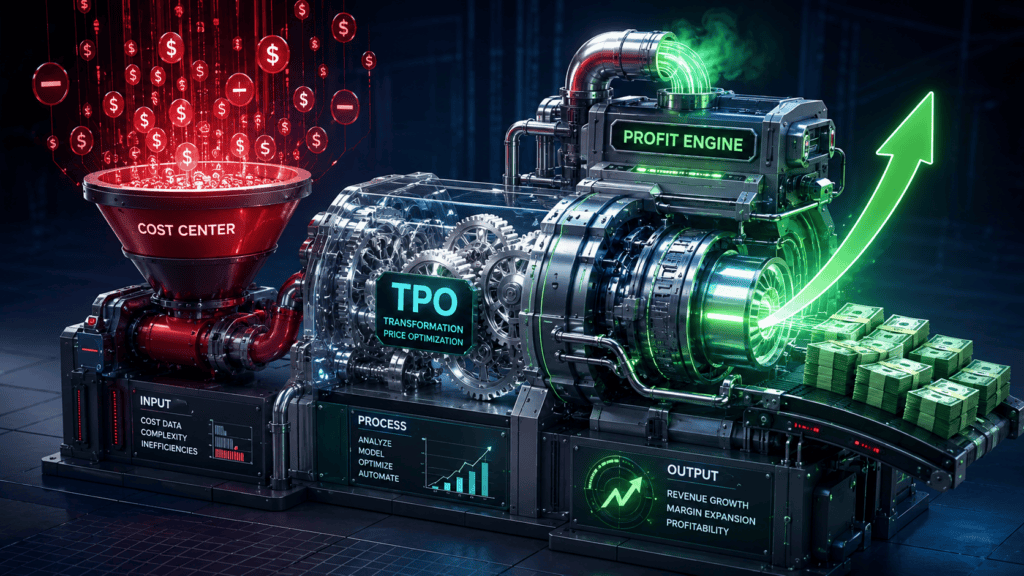
This guide offers CPG revenue growth, sales finance, and RGM leaders a concise overview of trade promotion optimization, explains why most promotions underperform, and outlines five strategies to turn trade spend into measurable profit.
Table of Contents
Trade promotion optimization (TPO) is the discipline of using data and analytics to plan, measure, and reallocate trade promotion spending so every promoted dollar returns measurable profit. Where trade promotion management (TPM) tracks and executes promotions, trade promotion optimization predicts and improves their ROI through baseline modeling, incremental lift measurement, and scenario planning. For consumer goods manufacturers, this is the second-largest line item on the P&L: trade spending accounts for 20 to 30 percent of gross sales, behind only cost of goods sold (Deloitte, 2026).
The reality is that most trade promotion spending is ineffective. McKinsey research found that 72 percent of US trade promotions fail to turn a profit, with the global figure near 59 percent. Despite this, companies often repeat the same annual plans, tracking accruals in TPM systems that do not identify which events generate profit.
This guide explains how trade promotion optimization addresses this challenge. It covers baseline and lift modeling to distinguish true incremental volume, demonstrates the promo ROI formula with real examples, details the five most effective levers for improving returns, and outlines a practical crawl-walk-run transition from manual TPM to AI-supported TPO for mid-market manufacturers.
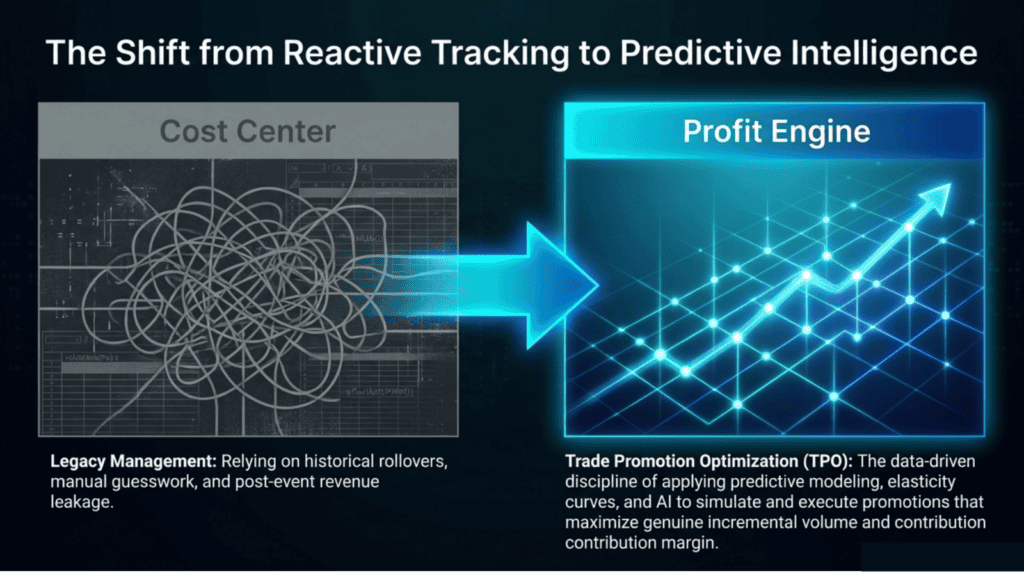
Transitioning from reactive tracking to predictive intelligence enables trade spend to be managed as a profit engine.
Key Takeaways
•Trade spend runs 20-30% of gross revenue for most CPG manufacturers, second only to COGS on the P&L.
•72% of US trade promotions fail to achieve break-even when measured against true incremental volume.
•TPM systems record and execute promotions; trade promotion effectiveness (TPE) measures promotional ROI; and trade promotion optimization (TPO) decides which events deserve funding.
•Five levers drive returns: baselines, post-event analysis, fund reallocation, guardrails, and scenario planning.
•AI-supported TPO is a crawl-walk-run journey built on governance, not a software purchase.
What Is Trade Promotion Optimization (TPO)?
Trade promotion optimization is the analytics-driven practice of measuring the true incrementality of every promotional event and reallocating trade funds to the events, accounts, and mechanics that drive profit rather than volume alone. It sits on top of your existing promotion workflow and changes the decisions, not the paperwork.
A working definition you can put in front of your CFO: trade promotion optimization means knowing, for each event, how many units you would have sold anyway, what the promotion truly costs after retailer margin math, and whether the incremental gross profit cleared your hurdle rate. Then it means acting on that knowledge in the next quarter’s plan.
That last sentence is where most organizations stall. Measurement without reallocation is a reporting exercise. Reallocation without measurement is guesswork. Trade promotion optimization only earns its name when the two operate together on a governed cadence.
Key Insight: 72% of US trade promotions fail to turn a profit (McKinsey & Company), yet trade spend remains the second-largest P&L line for CPG manufacturers. Closing even part of that gap is one of the fastest margin levers available to a consumer goods business.
TPO vs. TPM: What Is the Difference?
Trade promotion management handles the operational spine: planning calendars, allocating funds, processing deductions, and settling claims. It is a system of record. Trade promotion optimization is a decision-making system. The distinction matters because many manufacturers bought TPM software expecting better returns and instead got better bookkeeping.
| Dimension | Trade Promotion Management (TPM) | Trade Promotion Optimization (TPO) |
| Core question | Did we execute and pay correctly? | Did the event create incremental profit? |
| Orientation | Backward-looking, transactional | Forward-looking, analytical |
| Data | Accruals, deductions, settlements | Baselines, lift, elasticities, syndicated data |
| Output | Compliance and spend tracking | Event ROI, reallocation decisions, scenarios |
| Typical owner | Sales finance / trade ops | Revenue growth management (RGM) or commercial analytics, with finance |
| Value created | Process control, fewer leakages | Margin growth from better funding choices |
Both systems are necessary. TPM without TPO only records losses, while TPO without TPM lacks reliable spend data. Our client experience shows that the best results occur when TPM manages operations and a dedicated analytics layer addresses ROI questions.
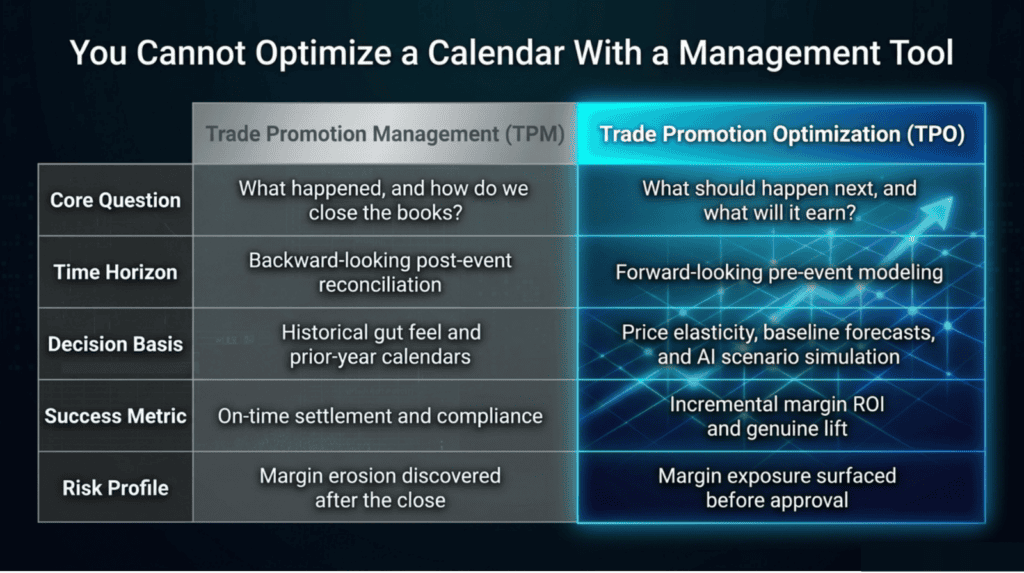
A management tool alone cannot optimize the promotional calendar; TPM and TPO serve distinct purposes.
Why Trade Promotion Optimization Matters in 2026
Three forces have raised the cost of running promotions on autopilot. First, retailers are negotiating harder for trade dollars while inflation-weary shoppers chase deals, so promoted volume is up and quality of spend is down. Research circulated by Forrester puts global trade promotion spending above $500 billion a year, with roughly 35 to 40 percent of it failing to deliver any incremental return. Second, promotion leakage, off-target schemes, and unauthorized claims quietly drain 1 to 3 percent of annual revenue at poorly instrumented manufacturers (FieldAssist, 2026).
Third, the tooling gap has become a strategy gap: the Promotion Optimization Institute reports that 62 percent of organizations have not yet applied generative AI to trade or revenue growth management, which hands early adopters a measurable head start.
In summary, trade spend continues to rise while measurement lags behind. Organizations that close this gap first gain a margin advantage, while competitors bear the cost through their own promotional budgets.
Why Do Most Trade Promotions Lose Money?
The primary reason is that few organizations measure promotions against a credible baseline. McKinsey’s research found that in developed FMCG markets, 70 to 90 percent of trade promotion spend is value-destroying after accounting for baseline sales. This significant measurement gap is what trade promotion optimization aims to address.
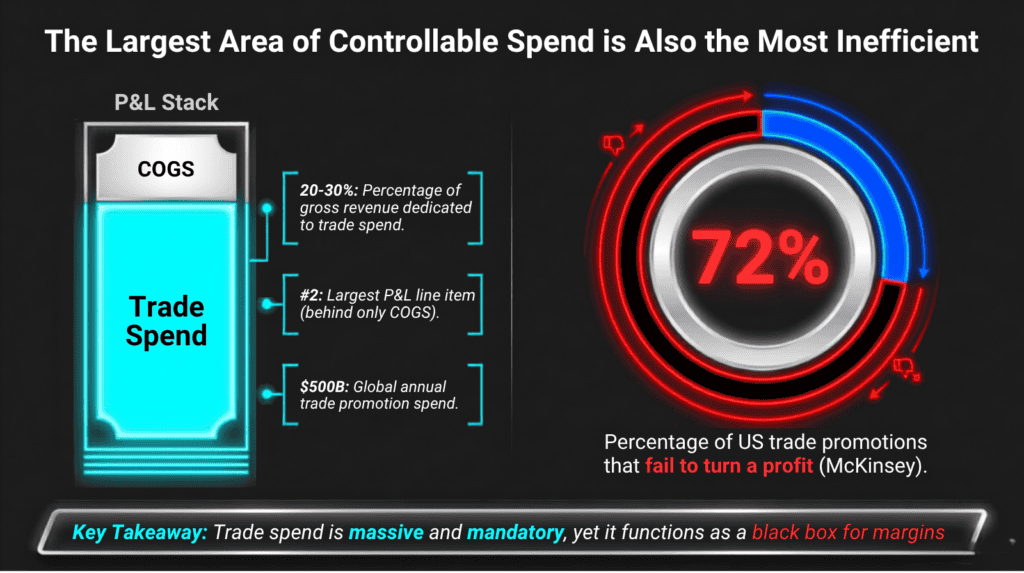
The largest controllable expense is often the most inefficient.
Five drivers show up again and again in promotion effectiveness and optimization work with manufacturers:
• No baseline discipline. Without a modeled non-promoted baseline, every unit sold during an event looks incremental, and every event looks like a winner.
• TPM systems built for accruals, not decisions. The data exists, but it lives in a format designed for deduction management and audit trails.
• Naive lift math. Comparing promo-week sales to the prior week ignores seasonality, forward buying, pantry loading, and cannibalization of your own adjacent products.
• Funds locked by history. Trade budgets follow last year’s allocations and long-standing retailer relationships, not event-level returns.
• Capability gaps. Mid-market manufacturers rarely carry a promotion analytics team, so post-event analysis happens once a year, if at all, and 61% of consumer goods companies also report difficulty executing planned promotions at retail (Promotion Optimization Institute, 2026).
The Cost-Center Trap: How Trade Spend Is Managed Today
At a typical manufacturer, the annual plan is finalized in Q4 under retailer deadlines. Funds are allocated similarly to the previous year, with minor adjustments. Throughout the year, teams track spending against accruals, manage deductions, and report volumes sold. Events are rarely re-ranked by profit due to a lack of trust in lift calculations.
The underlying data challenges are often greater than process issues. For example, at one mid-market beverage manufacturer, promotion data was fragmented across five systems, including Microsoft Dynamics 365 ERP, a trade planning system, distributor depletion feeds, Circana syndicated POS, and retailer data portals. Analyzing the ROI of even a few events required a week of data extraction and reconciliation, and bill-backs in the ERP could not be linked to specific deals. The team referred to this as budgeting against budgets.
Sales teams accept the plan because promotions support shelf presence and volume targets, while finance is satisfied as long as accruals reconcile. The main challenge is the ‘spray-and-pray’ promotional calendar, maintained by inertia and anecdotal justification. This approach persists because individual event costs are hidden, while the perceived risk of removing events is immediate. The first objective of trade promotion optimization is to provide a measurement robust enough to withstand scrutiny from key stakeholders.
How Do You Measure Trade Promotion ROI?
Trade promotion ROI measurement, the engine room of trade promotion optimization, starts with one question: how many of the units sold during the event would have sold anyway? Answer that with discipline, and everything else follows.
Baseline and Incremental Lift Modeling, Explained
Baseline sales are the volume you would have captured with no promotion running. Incremental lift is the actual promoted volume minus the baseline. Simple to say, easy to get wrong. A credible baseline model controls for seasonality, holiday timing, distribution changes, competitor activity, and your own overlapping events. In one engagement with a consumer electronics manufacturer, the team built a historical baseline index for roughly $100MM in promoted revenue precisely because high-traffic periods made naive comparisons meaningless. Events measured against raw prior-period sales showed a median lift near 0.5; measured against the corrected baseline, true median lift landed around 1.5, and true promo ROI for key events moved from the low teens to the 75-80 percent range.
Two adjustments separate practitioner-grade measurement from dashboard decoration. Subtract forward buying and pantry loading, the volume your trade partners and shoppers pulled forward that you will not sell next month. Then subtract cannibalization, the share of promoted volume that simply migrated from your own adjacent products. Multiplicative regression and random-forest ensemble models handle these controls well at scale, and syndicated data from NIQ or Circana supplies the market context that internal shipment data cannot.
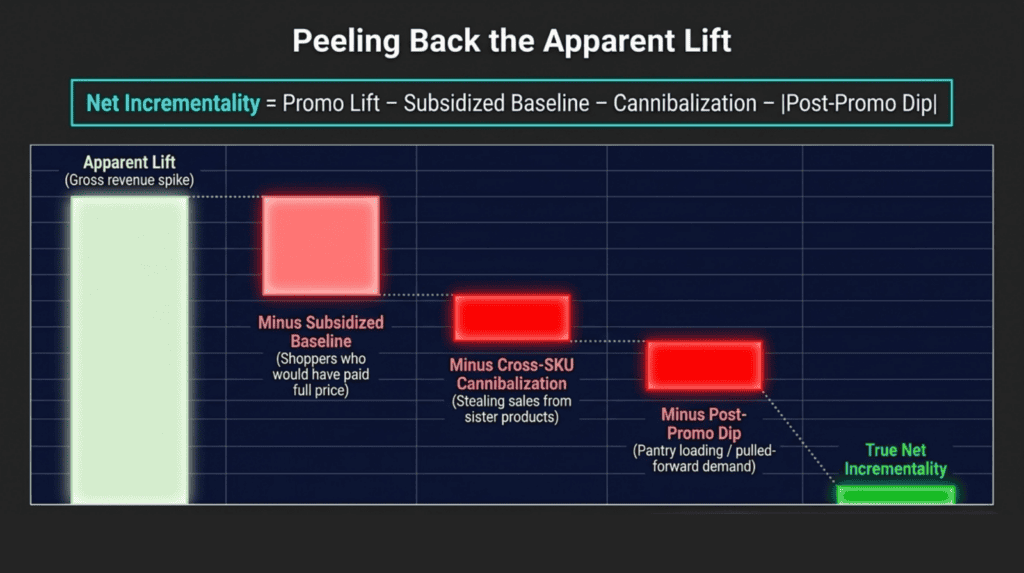
Peeling back the apparent lift: what remains after subsidized baseline, cannibalization, and the post-promo dip is true incrementality.
The Trade Promotion ROI Formula
Framework: Promo ROI = (Incremental Gross Profit – Total Promotion Cost) / Total Promotion Cost. Incremental gross profit is incremental volume times unit margin on promoted price, after cannibalization and forward-buy adjustments. Total promotion cost includes the discount funding, fixed fees, and display or feature payments.
Run the number for every event, then rank. Most manufacturers discover a barbell: a quartile of events with strong positive returns, a long middle, and a bottom quartile that loses money on every promoted unit. Top-quartile organizations see 60 percent or more of their promotional events beat their minimum acceptable ROI hurdle, while the average organization clears that bar on fewer than 40 percent of events (FieldAssist / Scout, 2026). The gap between those two numbers is your reallocation opportunity.
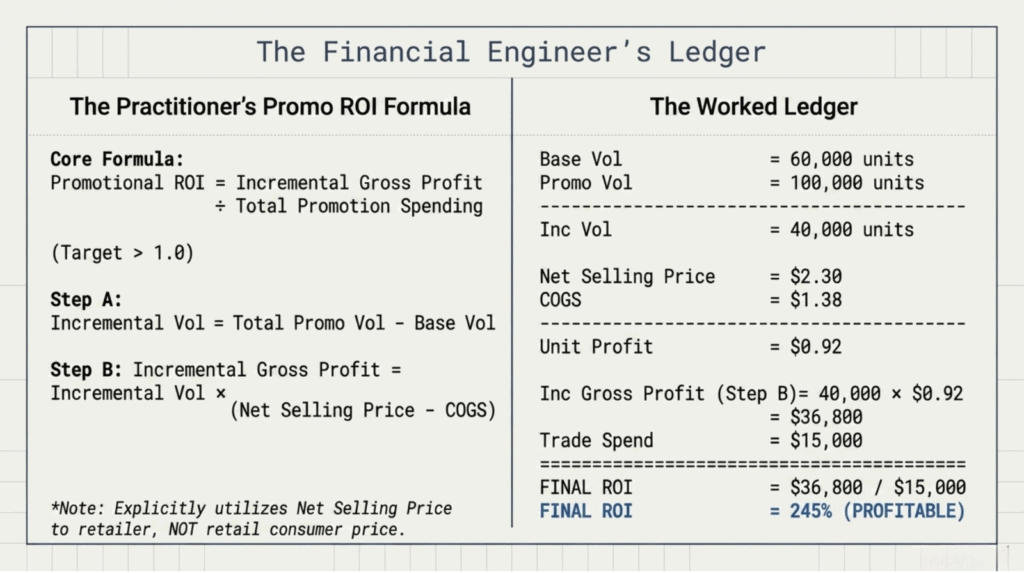
The practitioner’s promo ROI formula was calculated using an event ledger.
The 5 Levers of Trade Promotion Optimization
Effective trade promotion optimization programs pull the same five levers, in roughly this order.
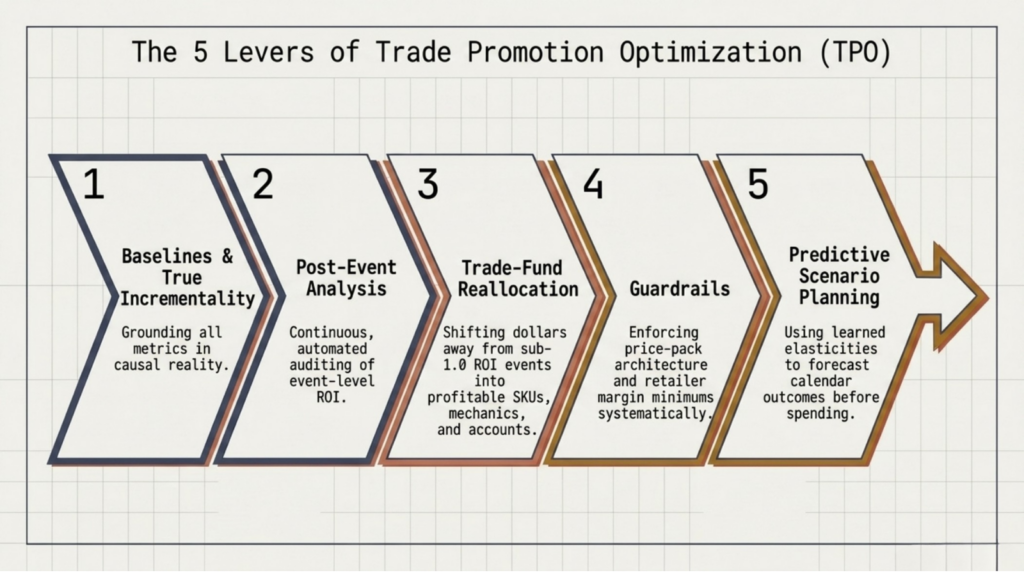
The five levers of trade promotion optimization, sequenced: measurement first, machine learning last.
Lever 1 – Baselines and True Incrementality
A solid baseline is fundamental to trade promotion optimization. Begin with your top two accounts and top 20 promoted SKUs, rather than attempting to analyze the entire calendar at once. A robust baseline covering 80 percent of promoted volume is more valuable than a weak one covering all events. Ensure that shipments, syndicated consumption, and trade spend data are aligned at the event level before applying any models.
Lever 2 – Post-Event Analysis at Scale
Annual post-mortems are insufficient. The standard should be post-event analysis for every significant event within 30 to 45 days of completion, generated automatically and reviewed monthly with sales leadership. For example, when a large CPG manufacturer adopted this approach, insight-driven event selection increased trade investment ROI from approximately 80 percent to the low 90s within a year.
Post-event analysis at scale: a trade promotion optimization dashboard ranks every event by true multi-tier ROI (illustrative view).
Lever 3 – Trade-Fund Reallocation Across Events and Accounts
This lever delivers measurable returns from trade promotion optimization. Reallocate funds from low-performing events to high-performing mechanics, shift resources from over-promoted to under-served accounts, and prioritize strategies that maintain price perception over deep discounts. For instance, a beverage manufacturer achieved a 3 to 5 percent ROI improvement on trade spend, meeting a seven-figure annual savings target by eliminating unprofitable events and redeploying funds.
Lever 4 – Guardrails: Price, Pack, and Retailer Margin Math
Promotions interact with everyday price architecture. A promoted price that undercuts your own adjacent pack sizes cannibalizes margin; no model will rescue, which is why price pack architecture and promotion planning belong in the same conversation. Set floor prices, maximum event frequency, and retailer margin guardrails before the negotiation, not after. Pay-for-performance trade terms, where funding follows executed display and feature compliance, put teeth behind the guardrails.
Advanced trade promotion optimization programs implement these guardrails through automated systems rather than relying on guidelines alone. For example, the beverage manufacturer referenced below uses a bottom-up simulator to enforce rules such as a gross margin floor in the mid-20s, limits on acceptable volume loss, channel-gap rules to maintain pricing relationships, and restrictions on deep-discount events to a few weeks per year at national accounts and none at secondary tiers.
A key rule is that distributors must not earn less profit per deal line than before any changes. A funding solution calculates the manufacturer spend required to maintain partner profitability. Consolidating approximately 60 legacy price tiers into 20 to 25 harmonized tiers eliminated significant special funding exceptions that previously resulted in annual losses.
Lever 5 – Predictive Scenario Planning
Once baselines and elasticities exist, you can war-game next quarter’s calendar before committing funds: projected units, net revenue, and gross profit for each proposed event, compared against alternatives. Scenario planning turns the annual negotiation from a volume argument into a profit conversation and gives sales teams a defensible story when a retailer pushes for one more deep-discount week.
How Do You Reallocate Trade Funds Without Losing Volume?
Concerns about losing volume often prevent the removal of unprofitable events. The practical approach is to reallocate funds gradually and validate results. Rank events by true ROI, eliminate the bottom decile in the first year, and reinvest those funds into proven strategies within the same account to maintain positive retailer relationships. Preserve events with strategic value beyond the P&L, such as new item support, but ensure these exceptions are explicit and time-limited.
Anticipate tradeoffs. Some volume from discontinued unprofitable events may not be recovered, and revenue may temporarily stabilize while gross profit increases.
That tension is exactly why reallocation needs a governance forum: a monthly or quarterly promo council where sales, finance, and RGM review event rankings, agree on the shifts, and log the decisions. Joint business planning with retailers turns the same analysis outward, showing category impact rather than just manufacturer margin. The state of promotion analytics across the industry suggests that most competitors are not yet equipped for that conversation, making preparedness a genuine advantage.
From Manual TPM to AI-Driven Trade Promotion Optimization
The technology conversation comes last for a reason. Tools amplify a working process; they cannot substitute for one. The Revology view, formed through engagements such as our manufacturer promotion effectiveness case study, is that governance, decision rights, and cadence determine whether any trade promotion optimization investment pays back. AI raises the ceiling; it does not lay the foundation. Ownership matters too: manufacturers who build and keep their own elasticity models retain the learning, while black-box vendor scores leave when the contract does.
What Does AI Add to Trade Promotion Optimization?
Applied to a governed process, machine learning improves three things. Baseline accuracy: AI-driven forecasting has been shown to deliver a 13 percent improvement in forecast accuracy, 40 percent fewer supply shortages, and 35 percent lower inventory (research cited by McKinsey, 2026). Recommendation quality: PepsiCo’s PromoAI platform reached roughly 85 percent acceptance and execution of its optimized promotional recommendations, a strong signal of organizational trust in the models (INFORMS Journal on Applied Analytics, 2026).
Scale: an AI-supported TPO transformation typically yields a 2 to 5 percent total revenue increase and a 5 to 10 percent improvement in trade spend ROI year-over-year (XTEL / FieldAssist, 2026). At the top end, a Fortune 500 CPG brand optimized a $400MM trade budget with ML, delivering about $10MM in incremental margin and a 5.4-point ROI improvement across 1,100 SKUs (Tredence, 2025).
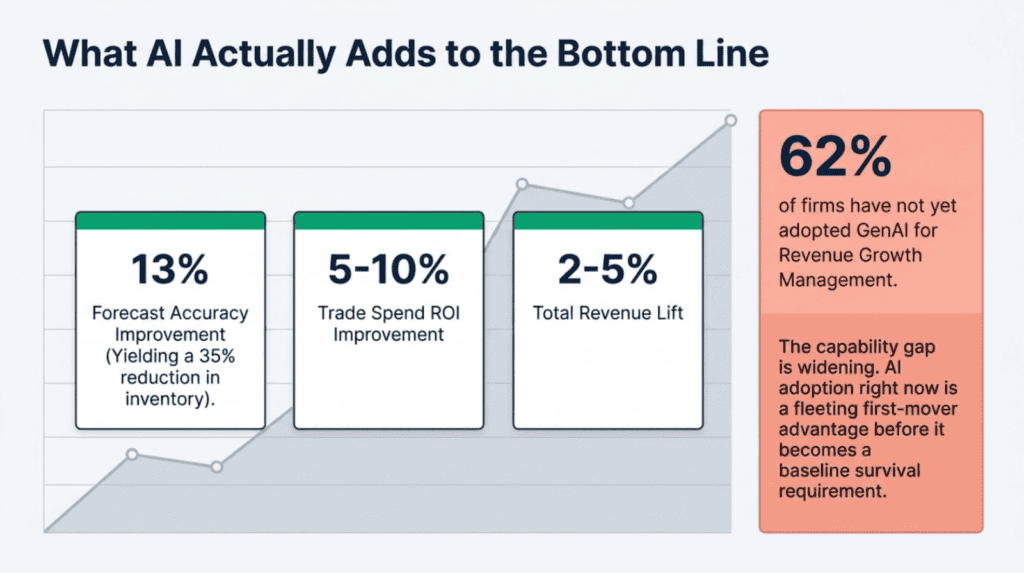
What AI adds to a governed trade promotion optimization process, in measured ranges.
Data Point: With 62% of organizations yet to apply generative AI to trade or revenue growth management (POI, 2026), the realistic prize for early movers is not exotic. It is the compounding effect of slightly better baselines, slightly faster post-event analysis, and consistently better funding decisions, quarter after quarter.
A Crawl-Walk-Run Roadmap
Step 1, Crawl (months 0-3): Build baselines and run post-event analysis for your top accounts and SKUs. Stand up the promo council. Kill the bottom decile of events.
Step 2, Walk (months 4-9): Extend coverage to the full calendar. Introduce elasticity-driven scenario planning for the next planning cycle. Move one or two major accounts to pay-for-performance terms.
Step 3, Run (months 10-18): Layer machine-learning baselines and recommendation engines onto the governed trade promotion optimization process. Integrate promotion decisions with pricing and mix management inside a broader RGM operating model.
The order of implementation is more important than speed. Manufacturers that bypass foundational steps and purchase a TPO platform immediately often end up with visually appealing data that does not drive action.
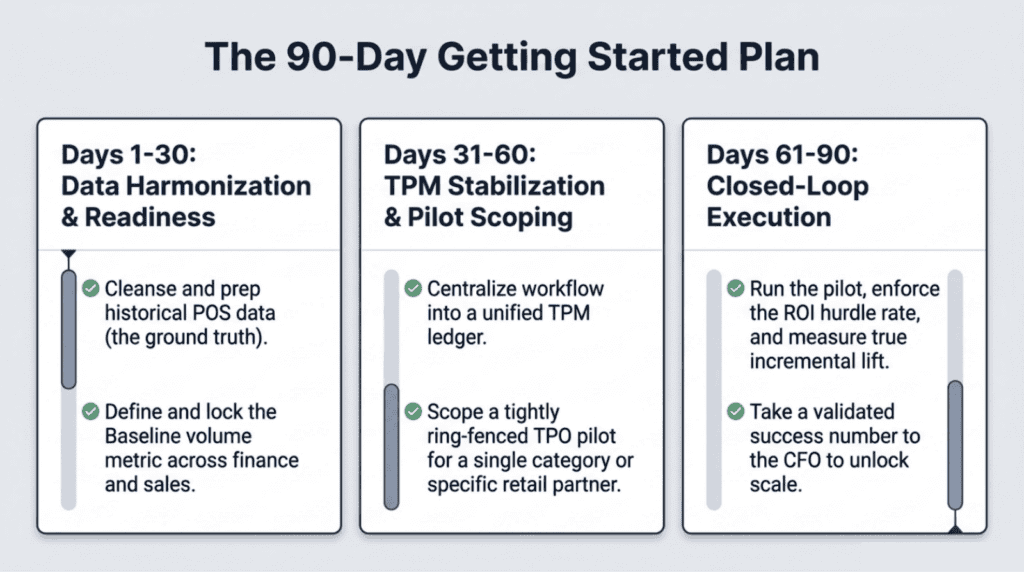
A 90-day trade promotion optimization start plan: harmonize the data, scope a ring-fenced pilot, run it closed-loop.
Real Example: What TPO Looks Like in Practice
A composite view of trade promotion optimization drawn from anonymized client work, with the math shown.
Step 1: Establish the baseline. A large CPG manufacturer with over $1 billion in revenue increased promotional spending from approximately 15 percent to 20 percent of gross revenues in pursuit of market share, resulting in declining margins and minimal incremental lift. The team consolidated shipments, distributor data, and syndicated consumption into a central warehouse, then applied multiplicative regression and random forest models to distinguish baseline from incremental volume for each event.
Step 2: Re-rank every event based on true ROI. For example, consider an event with 100,000 promoted units at a $2.00 manufacturer-funded discount, $40,000 in display fees, and a measured incremental volume of 60,000 units at a $1.80 per-unit margin. Incremental gross profit is $1.80 × 60,000 = $108,000. Total promotion cost is (100,000 × $2.00) + $40,000 = $240,000. Promo ROI = ($108,000 – $240,000) / $240,000 = -55 percent. Applying this analysis across the full calendar quickly identifies underperforming events.
Step 3: Reallocate and govern. Funding was redirected to events and mechanics with demonstrated incrementality, convenience-channel rebates were transitioned to pay-for-performance, and a monthly review process ensured rankings remained visible to decision-makers.
Step 4: Realize the results. Within a year, trade investment ROI increased from approximately 80 percent to the low 90s, gross profit grew by high single digits overall and low double digits on anchor brands, and the business achieved mid-single-digit unit volume growth with a 3 to 5 point increase in dollar share. This demonstrates trade promotion optimization delivering improved outcomes with the same budget.
Practitioner Note: The critical factor was not the modeling itself, but the establishment of a monthly forum where sales, finance, and RGM reviewed and acted on event rankings. Analytics provided insights, while governance ensured those insights translated into improved margins.
Inside a Trade Promotion Optimization Build: A Beverage Manufacturer’s View
In another trade promotion optimization engagement, ERP transactions were managed in Microsoft Dynamics 365, deal rates in a separate planning system, distributor depletions in a third source, and Circana syndicated data in a fourth, with no reconciliation at the event level. Robust data integration across internal and external systems was therefore essential.
Automated pipelines pulled those feeds into governed data layers, with a small master data app maintaining crosswalks between system hierarchies. Because invoice reconciliation could not reliably tie bill-backs to individual deals, the team engineered an estimated spend proxy – Circana’s actual units sold multiplied by planned deal rates – so every event carried a credible spend figure without waiting on perfect settlements. And elasticity models built on double machine learning produced own-price, discount, and merchandising lift estimates, with hierarchical fallbacks where the data ran sparse.
The results justified the investment in data integration. Deep-discount-only events lost nearly ninety cents per promoted dollar, while display-supported events achieved approximately 30 percent ROI. Multipacks frequently produced negative ROI due to higher unit costs and slower velocity, prompting a shift toward high-velocity single-serve formats. ROI is now calculated at the manufacturer, distributor, and retailer levels, with the program targeting a 3 to 5 percent efficiency gain on a mid-eight-figure trade budget and about half a point of net price realization, delivering seven-figure annual value for each metric. Sales leadership noted the unprecedented transparency, with every event and account ranked by true return.
One event, decomposed: lift net of cannibalization, forward buys, and pantry loading, with ROI versus target flagged in real time (illustrative view).
Common Trade Promotion Optimization Mistakes
Be aware of five common failure modes. The most significant is treating trade promotion optimization as a software purchase instead of an operating model change, which results in tools serving only as reporting layers. Measuring lift against prior-period sales rather than a modeled baseline overstates returns and undermines trust during financial audits. Waiting for perfect data delays value realization, whereas piloting with top accounts can deliver early benefits.
Two more deserve their own warning. Framing the goal as cutting trade spend puts sales on the defensive; the goal is reallocating spend, and total budgets often stay flat while profit climbs. And letting the analytics team own promotions alone guarantees shelf-ware. Ownership belongs with a cross-functional council, because promotion choices are commercial strategy expressed in dollars, a theme consistent with why half of companies still trail in promotion analytics.
For perspective on the size of the prize relative to other levers: according to Revology’s research of 2,000 global companies, a 1% improvement in price realization produces a 6-7% lift in operating profit, and excluding highly regulated industries, the figure reaches 10-11% (“Pricing Still Packs a Punch,” Revology Analytics, June 2025). Promotion dollars flow through the same price waterfall, so disciplined trade promotion optimization and tighter control of margin leakage compound in the same way.
Frequently Asked Questions
What is trade promotion optimization?
Trade promotion optimization is the practice of using analytics to measure the true incremental impact of trade promotions and reallocate spend toward events that create profit. It combines baseline modeling, post-event analysis, and scenario planning on a governed cadence, so funding decisions follow measured returns instead of last year’s calendar.
What is the difference between TPM and TPO?
Trade promotion management runs the workflow: planning, funds, deductions, and settlement. Trade promotion optimization evaluates and improves outcomes by measuring lift and ROI, then reallocating funds. TPM is the system of record; TPO is the system of decision. Mature organizations run on shared data.
How do you calculate trade promotion ROI?
Promo ROI equals incremental gross profit minus total promotion cost, divided by total promotion cost. Incremental gross profit is measured against a modeled non-promoted baseline and adjusted for cannibalization and forward buying. Total cost includes discount funding, fixed fees, and display or feature payments.
What percentage of trade promotions are profitable?
Fewer than half in most studies. McKinsey found 72 percent of US trade promotions fail to turn a profit, and 70-90 percent of spend in developed FMCG markets is value-destroying on a true incremental basis. Top-quartile manufacturers clear their ROI hurdle on 60 percent or more of events, and trade promotion optimization is how they narrow the gap from below.
How much do CPG companies spend on trade promotion?
Trade spending typically runs 15 to 30 percent of gross revenue for consumer goods manufacturers, making it the second-largest P&L line item after cost of goods sold. Globally, trade promotion spending exceeds $500 billion a year, which is why even single-digit gains from trade promotion optimization carry seven-figure value for mid-market companies.
What is baseline and incremental lift in promotions?
Baseline sales are the units a product would have sold in the absence of promotion, estimated using models that control for seasonality, distribution, and competitor activity. Incremental lift is the actual promoted volume minus that baseline, further adjusted for forward buying and cannibalization. Lift that survives those adjustments is the only volume a promotion should take credit for.
Diagnostic Checklist and Next Steps
Five questions to pressure-test your current trade promotion optimization state. Can you name your ten best and ten worst events from last year by true ROI? Does your lift math control for seasonality, forward buying, and cannibalization? Do post-event analyses arrive within 45 days for every material event? Is there a standing forum with authority to move funds between events and accounts? Do promoted prices respect your pack architecture and margin guardrails?
If you answered ‘no’ to two or fewer questions, begin trade promotion optimization at the crawl phase: focus on baselines and post-event analysis for your top two accounts this quarter, using existing data. Resource-constrained teams do not need a platform to start; a disciplined analyst, event-level spend data, and syndicated consumption are sufficient for the initial steps, and early reallocation gains often fund subsequent initiatives.
If you want experienced hands on the problem, Revology Analytics builds promotion effectiveness and trade promotion optimization capabilities alongside mid-market teams, from baseline models through the governance that keeps them in place.