

Overview: Revenue growth in Practice
This article from Revology Analytics explains revenue growth in the context of modern pricing analytics and revenue growth management. It draws on real engagements with mid-market and enterprise clients to turn revenue growth from a buzzword into a measurable commercial capability. Read on for the full perspective, and see our related reading for additional depth.
Table of Contents
Revology Analytics had the opportunity to join 25 leading Revenue Growth Management executives in CPG and Manufacturing in St. Louis earlier this week. We discussed the state of Revenue Growth Analytics in the CPG industry and the significant opportunity to in-source and own many of the advanced analytics capabilities foundational to a successful RGM and Pricing strategy.
In many ways, the state of Revenue Growth Management and its associated analytics capabilities have not changed meaningfully in the last ten years for Consumer Goods companies. There’s still a heavy reliance on data and information providers like Nielsen and IRI to carry out foundational Pricing & Promotional Analytics efforts, including Price Elasticity and Marketing Mix Modeling, or a heavy reliance on 3rd party software for price analytics, scenario analyses, and optimization efforts.
However, the world is changing….fast.
Current State of Revenue Growth Analytics Capabilities
Our inaugural Revenue Growth Analytics Scorecard, taken by nearly 150 commercial leaders across various industries, revealed substantial opportunities, not just for CPG companies but other industries as well:
1 out of 3 companies measure Net Price Realization annually or less frequently, despite this being a Pricing 101 type (i.e., must-have) capability
Almost 50% of companies do not measure Price Elasticities at least annually. CPG and Retail lead this space, while industries like Distribution, Manufacturing, and Med-Tech rarely measure it. Again, this is a fundamental capability, and given changing industry dynamics and more frequent industry shocks, we suggest modeling price elasticities semi-annually.
1 out of 3 companies says that they don’t have adequate research to quantify the relative Price vs. differential Value for their products (vs. competition). The CPG industry especially struggles in this regard, and the lack of ongoing Price-Value measurement is one of the biggest reasons CPGs routinely erode Price increases with incremental Promotional investments (of course, their Retail partners exacerbate this problem).
Nearly 60% of companies are not analyzing and monitoring the share of gross profits for their products within their supply chain. This can be a big issue as supply chain partners may only partially cover their share of promotional investments during high-demand periods (and instead pocket manufacturer promotional funds).
Despite the Promotion Effectiveness & Optimization software industry being quite mature in CPG, commercial leaders rated their “Promotional Effectiveness & Optimization” capabilities slightly less than “Average”. Companies with homegrown Pricing and Promotional Analytics tools often outperform those with turnkey enterprise software.
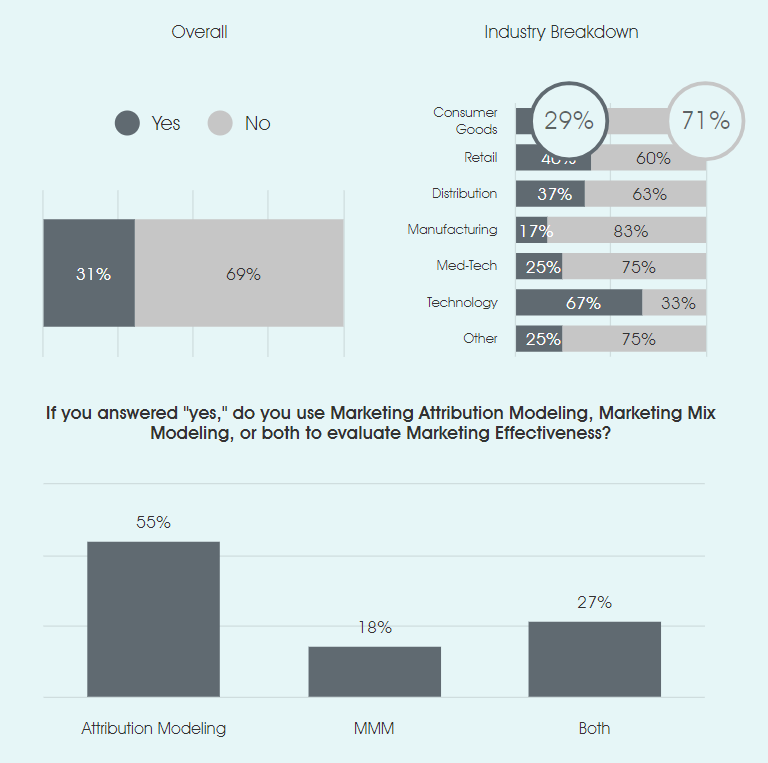
70% of companies cannot quantify the return on their Marketing investments. For CPG companies, only 1 in 3 measure Marketing ROI regularly, and most do not have in-house capabilities to perform Marketing Mix Modeling.
Majority of companies, including 70% of CPG participants, do not have customer-facing analytics tools. Building analytics solutions that help customers win more (increase profitability, optimize assortment, etc.) results in substantial increases in customer stickiness and can serve as the precursor to justifying pricing premiums (due to the value differentiation you provide to your customers).
In-Sourcing Revenue Growth Analytics Capabilities is Imperative
The democratization of analytics, advanced models, the improvement in BI tools over the last decade, and the emergence of LLMs are causing a shift in the build vs. buy debate.
Companies slowly realize they don’t need as many full-stack data scientists (those who can build and operationalize models). Instead, they are finding substantial Value in business analysts with solid domain knowledge (in Pricing/RGM as an example) who also have foundational Machine Learning skills.
So, what are the benefits of In-Sourcing?
I. You are building capabilities that are tailored to your business:
Develop models that align precisely with your brand strategy, consumer behaviors, and other industry/company nuances.
Adapt quickly to the unique dynamics of product categories and regional markets.
Seamlessly combine analytics/models with internal data systems and operational workflows.
Ensure consistency and alignment with sales, marketing, and supply chain operations (requires that analytical solutions be co-created).
II. You enable much higher data ROI and solution agility:
Reduce dependency on expensive third-party data providers and analytics platforms. Incur lower ongoing costs after initial setup and training.
Invest in upskilling existing talent, leveraging their business acumen and data fluency.
Implement changes and optimizations quickly without vendor dependencies.
React in real-time to market shifts, leveraging agile decision-making processes.
Iteratively refine models and strategies based on immediate feedback and results.
III. You build better Sales & Marketing Enablement
Develop a deep understanding of customer, competitor, and distributor behavior and identify optimization opportunities (i.e., in-house Sales & Marketing Knowledge Graphs).
Measure the return on investment for marketing campaigns more accurately by integrating sales, customer, and marketing data.
Generate proprietary insights methodologies that competitors cannot easily replicate.
IV. You drive analytical adoption through increased cross-functional collaboration
Facilitate better integration between different departments, such as marketing, sales, and IT, leading to a more cohesive analytics strategy.
Encourage the sharing of insights across departments, enhancing overall analytical acumen.
Engage employees by involving them in high-impact projects, leading to improved job satisfaction and retention.
Foster a sense of individual and team ownership and accountability for analytics outcomes.
Build a repository of case studies, learnings, and analytical models that constitute a valuable intellectual capital base.

The Landscape of Analytics Tools and Techniques is Accelerating
Over the past decade, there has been a significant evolution in BI tools, as well as advanced algorithms being open-sourced by gracious domain experts. The industry has progressed from elementary BI tools and limited cloud infrastructure in the early 2010s to sophisticated, self-serve platforms integrating machine learning features, such as those in Tableau and Power BI.
One largely untapped opportunity for CPG (as well as Manufacturing and Distribution in general) is Knowledge Graphs, which substantially enhance the Sales and Marketing team enablement and insights generation.
Knowledge Graphs are not a new concept but are still heavily under-utilized in traditional industries. They offer an advanced alternative to the challenges faced by CPGs and other sectors in managing and analyzing multi-dimensional sales, inventory, competitive, customer, and marketing data.
With its SQL-based limitations, traditional data warehousing has been inadequate in handling the dynamic and multi-dimensional nature of contemporary sales and marketing analyses. In contrast, Knowledge Graphs structure data as nodes, properties, and relationships, facilitating lightning-fast access to advanced insights and predictive models. Their advanced, relationship-based data structure allows for richer, multi-faceted insights, substantially outperforming traditional data warehouses in integrating disparate data sets without complex queries.
For CPGs, this means effectively mapping the data and relationships between sales, products, promotions, competitor behavior, distributor transactions, and retailer sales pricing trends for quick and comprehensive analyses of critical business problems.
A Call for Action
Our Revenue Growth Analytics Maturity Study marks a turning point in Pricing, Marketing, and Sales Analytics capabilities for companies. It emphasizes the importance of in-sourcing advanced commercial analytics, driving executive support for the Revenue Growth Management agenda, and leveraging LLMs to supercharge your analytics.
The future of Revenue growth Analytics lies in the intersection of in-house domain (human) expertise and leveraging advanced technology like LLMs and Knowledge Graphs. The integration of Knowledge Graphs, in particular, represents a significant advancement in handling sales, pricing, and marketing data, enabling CPGs and other companies to derive actionable insights more swiftly and accurately.
We encourage those of you reading this article to explore more about in-sourcing fundamental Revenue Analytics capabilities and to attend one of our upcoming webinars on these topics.
Frequently asked questions about revenue growth analytics
What is revenue growth analytics?
Revenue growth analytics covers the advanced analytics capabilities that a successful revenue growth management and pricing strategy is built on. Examples from Revology’s scorecard include measuring net price realization and price elasticities, quantifying price versus value against competitors, promotion effectiveness and optimization, marketing ROI, and customer-facing analytics tools.
What gaps did the Revenue Growth Analytics Scorecard reveal?
Among nearly 150 commercial leaders, 1 in 3 companies measure net price realization annually or less often, nearly 60% do not monitor their products’ share of gross profit within the supply chain, and 70% cannot quantify the return on their marketing investments. Most companies, including 70% of CPG participants, also have no customer-facing analytics tools.
How often should companies model price elasticities?
Revology suggests modeling price elasticities semi-annually, given changing industry dynamics and more frequent industry shocks. It is a fundamental capability, yet almost 50% of companies do not measure elasticities even once a year. CPG and retail lead in this area, while distribution, manufacturing, and med-tech rarely measure them.
Why do CPG companies erode their price increases?
A key reason is the lack of ongoing price-value measurement. One in three companies say they lack adequate research to quantify their price versus their differential value against competitors, and CPG companies struggle most. Without it, they routinely erode price increases with incremental promotional investments, a problem their retail partners make worse.
What are the benefits of in-sourcing revenue growth analytics?
In-sourcing builds capabilities tailored to your brand strategy, consumer behaviors, and categories, integrated with your internal systems and workflows. It raises data ROI and agility through less dependence on expensive third-party data and platforms, lower ongoing costs, and faster changes. It also strengthens sales and marketing enablement with proprietary insights, and it drives adoption through cross-functional collaboration and ownership.
Why is the build versus buy debate shifting?
The democratization of analytics, advanced models, a decade of better BI tools, and the emergence of LLMs are shifting the debate toward building. Companies also find they need fewer full-stack data scientists and get substantial value from business analysts with solid domain knowledge, in pricing or RGM for example, who also have foundational machine learning skills.
What are knowledge graphs and why do they matter?
Knowledge graphs structure data as nodes, properties, and relationships. That gives fast access to advanced insights and predictive models and lets companies integrate disparate data sets without complex queries, where SQL-based data warehouses fall short. For CPG companies, a graph maps sales, products, promotions, competitor behavior, distributor transactions, and retailer pricing trends for quick, comprehensive analysis.
Related Reading
- Solving Unproductive Inventory Challenge with Dynamic Markdown Pricing
- The Unproductivity Problem with Your Inventory
For broader industry perspective on pricing analytics and revenue growth management, see McKinsey’s Growth, Marketing & Sales insights.






