


Table of Contents
How unproductive inventory is hurting your wholesale business, and how to fix it with pragmatic markdown pricing.
After enjoying a couple of great years and bonus payouts, your Company (ABC Industries, a consumer products wholesaler) is suddenly accelerating toward liquidity problems, risking its ability to meet debt obligations on asset-backed loans. Your Revenue Management and Finance teams find out that ABC Industries has a major non-working capital problem on its hands, driven by unproductive inventory. It turns out unproductive inventory has been piling up over the last year, representing 35% of the $500 million worth of products in ABC’s 20 nationwide warehouses.
ABC has been buying up too much inventory. When manufacturing partners gave out attractive pricing deals for bulk buys, ABC’s merchants jumped on the opportunity, often buying 5-20x more than they could sell within a 6-month time frame. ABC didn’t have a good process or underlying analytical method to mitigate the problem, leaving a ton of non-selling inventory piling up in the warehouses. $175MM of cash tied up in stock is not a good problem. ABC needed a way to get rid of the inventory fast, drive additional liquidity to improve cash flow, and do it in a way that drives incremental gross profit (i.e., not through a flash liquidation that gets rid of inventory in bulk at 50% of acquisition costs).
If this sounds like a familiar problem, you’re not alone. Unproductive inventory typically accounts for 15-30% of distributors’ merchandise and is often treated as the cost of running a wholesale business. Despite investing $ millions in industry-leading inventory management software, distributors are still struggling to find systematic solutions to the unproductive inventory problem. But it doesn’t have to be that way. There are several concurrent paths to addressing the issue, and we’ll focus our attention on one of the most pragmatic and impactful ones: Markdown Pricing.
Unproductive inventory has a considerable cost for your wholesale business
Unproductive inventory is easy to spot by analyzing historical inventory productivity metrics (Days on Hand, Turnover, GMROI, etc.) and comparing current inventory levels vs. expected demand. Unproductive inventory can be “dead inventory” that hasn’t been sold in a certain number of weeks or months (the most significant drivers for liquidity problems). It can also be “slow-moving or dying inventory” whose sales have been steeply trending down for weeks or months. For the “slow-moving” category, it is best to combine sales trend analysis with customer concentration (i.e., are there only five customers out of 50,000 buying these products?).
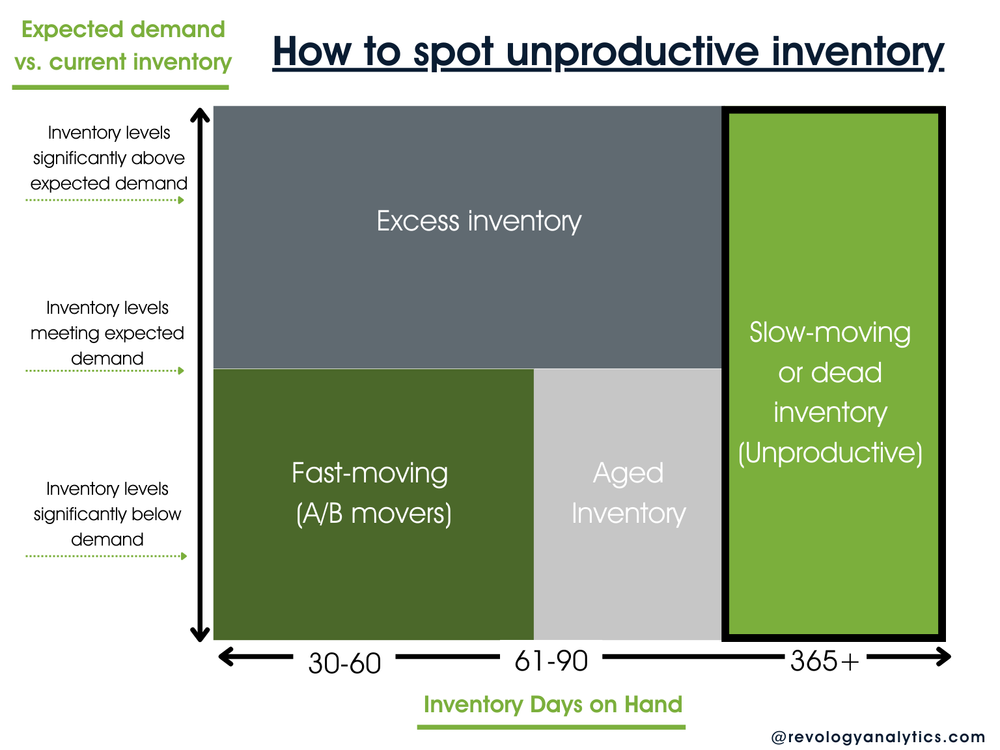
So how exactly is unproductive inventory hurting your business?
They place undue pressure on your inventory carrying costs (storage, warehouse utilities, labor, insurance, etc.). Carrying costs typically comprise ~ 20% of inventory acquisition costs, and non-selling items exacerbate these costs.
You start to have cash flow problems. Unproductive inventory tying up capital negatively impacts your ability to generate cash and profits. Instead of enjoying the healthy business cycle of selling items to generate profits, which you can reinvest to buy more fast-moving stock, you create a “non-working capital problem.”
You are accruing more and more interest on the loans you took to buy the inventory in the first place.
You run into warehouse space issues. If ~35% of ABC Industries’ warehouse space is used to store unproductive inventory, they may need additional space to make room for fast-moving products (A/B movers).
You incur additional labor costs as warehouse associates need to constantly move unproductive inventory from the front to the back of the warehouse.
You start incurring incremental management and administrative costs as you attempt to fix these unproductive inventory problems through ad-hoc clearance pricing, inventory repositioning (warehouse transfers), or bulk liquidation events.
Solving the problem with automated markdown pricing
There are several ways to address the unproductive inventory problem, including remarketing, repositioning (to other warehouses in the network that have the demand for it), selling to liquidators, donations, and the least desirable, accounting write-offs.
Implementing automated clearance pricing is one of the most effective ways to solve the issue, and it doesn’t have to be expensive or overly complicated. While there are specialized inventory optimization and price optimization software in the market (both with clearance pricing modules), they are often prohibitively expensive for middle-market firms and too rigid/inflexible to incorporate the changing nuances of the business.
A rules-based clearance pricing engine is often enough to drive substantial business results and generate much-needed cash and incremental gross profits. Because it is automated and dynamic, it will save hundreds or thousands of hours annually for your Pricing and Sales teams.
Below is a simple blueprint for designing and implementing an inventory markdown pricing process in your organization:
Step 1 – Problem decomposition and understanding
Understand why your unproductive inventory problem exists and define the business outcome you want to achieve within X weeks or months (e.g., freeing up $100MM in cash by the end of 26 weeks while investing no more than $15MM in price markdowns).
Figure out who the key stakeholders you need to engage with to decompose the problem and bring along the markdown pricing solution journey. These are typically your Sales, Supply Chain, IT, and Finance teams. Both Sales and Supply Chain will give you helpful context about the problem, help you brainstorm about the solution, and inject much-needed pragmatism in the final delivery. They will also be a key partner in ensuring that your Clearance Pricing solution will be used throughout the organization. Finance will be a crucial stakeholder and help you incorporate critical thresholds in your automated markdown process (e.g., max. discounting limits by product category to ensure you don’t price discount below inventory reserve levels). IT will help you assemble the right data assets for this project, and more importantly, they are contributing to a significant revenue-generating commercial initiative for the Company.
See how your pricing compares
Our 2025 report looks at how more than 150 business leaders handle pricing and promotions. See what the best companies do differently, and where most fall short.
Step 2 – Building the clearance pricing solution
First, define what data elements you need to build an automated solution. Suppose your Company pulls pricing, sales, and inventory data from various systems (part Oracle, part MSFT SQL Warehouse). In that case, this is the time to invest in a purpose-built analytical data warehouse in the Cloud (i.e., AWS, Azure, GCP). It ensures that you have all the required data elements in one spot, easily accessible by your Clearance Pricing Engine, with fast data access for modeling and visualization.
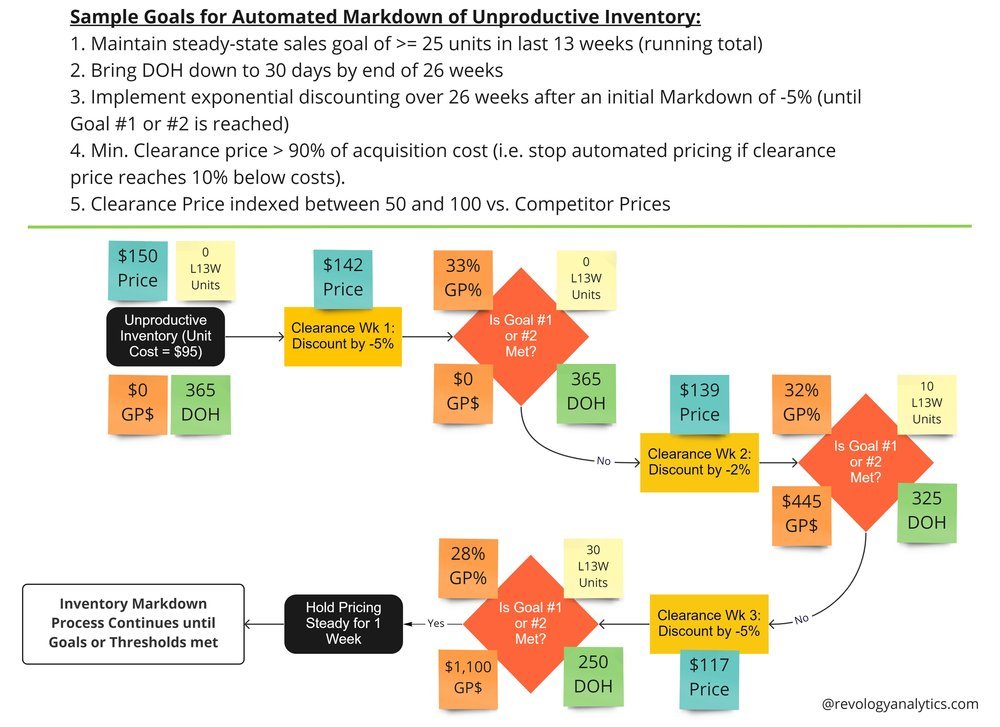
The markdown pricing solution (or tool or platform) does not have to be complicated. Often, an MVP (Minimum Viable Product) type solution can drive substantial benefits to your Company. Below. The below is an overly simplified automated markdown solution that considers Unit Sales and DOH (Days on Hand) goals, with thresholds for maximum price investments and competitive price indexes. There are no machine learning and optimization algorithms, just some raw data and data-informed heuristics that you can formulate with your Sales, Supply Chain, and Finance partners. You can build and deploy it at 10x the speed and 0.01x the cost compared to a more sophisticated turnkey solution that claims to use “ML and AI.”
You can make this slightly more complicated and incorporate seasonality and cross-price elasticities (i.e., if you discount too much, you may be sourcing volume from your top moving items) to control substantial over-investing. If you operated a hub and spoke network, it is vital to also account for nuances (e.g., unified clearance price within the hub network).
Step 3 – Do some internal roadshows
Getting your cross-functional partners involved (from executives to functional managers) creates a sense of ownership in the clearance pricing solution. It will help you address blind spots as you build the capability and drive adoption once deployed.
Your roadshow can be in the form of monthly senior executive updates (meetings), with weekly or bi-weekly updates and working sessions with functional stakeholders. Once you deploy your clearance pricing solution, you continue the monthly updates via email to your executive sponsors and functional counterparts that helped you build and deploy. Post-deployment, your communication should include metrics related to your Markdown Pricing solution for unproductive inventory.
Inventory Days on Hand, Turnover, and GMROI trends by week since deployment
Clearance Price Investments by week
Weekly Unit Sales, Sales Revenue, and Gross Profit $
Progress to goal for Cash Generation, total Price Investment, and Inventory Depletions
Overall split of price investments that are below and above your accounting reserves (e.g., $10MM price investment invested above 50% of acquisition costs and $5MM below)
As part of the roadshows and working sessions, It is essential to drive acceptance criteria of the solution before you start building the clearance process, before you pilot, and right before you deploy nationwide. Everyone should be familiar with how the clearance pricing process works, what the critical thresholds are, understand price execution cadence, and be aligned on overall goals.
Step 4 – Conduct a clearance pricing pilot
Work with your sales partners to identify a sample of warehouses or distribution centers (the “test DCs”) in several markets or regions (the “test markets”) and conduct a 6-8 week price test. The rest of the warehouses in the test markets will serve as the control group. Measure and communicate weekly progress to your executive sponsors and key stakeholders, and invite them to review and give feedback.
Do another executive and functional stakeholder roadshow once you wrap up the clearance price test. You review the processes beginning-to-end, review results, and align on the national rollout’s timing, cadence, and outcomes.
Step 5 – Launch your automated solution with Clearance Pricing Guidelines
Post-pilot, you are ready to launch your automated clearance pricing solution across the Company. While you’ve developed an automated solution that runs on its own each week, or at the press of a button by a Pricing team member, it is essential to have provisions for your Finance, Supply Chain, and especially Sales teams.
I recommend that you build a living document shared with your key stakeholders that is also visible and easily accessible on a Sales Portal. It should have the following components:
A visual explanation of how Clearance Pricing for Unproductive Inventory works in your Company. Give examples.
Guidelines for deeper quantity discounts (bulk buys) that your Sales teams can share with larger customers. Whenever possible, create a calculator that gives clearance price ranges based on specific inputs such as customer size, product type, current cost, competitor prices, and current days on hand.
An updated worksheet shows Regular vs. Clearance Prices for each product and channel/region/market/distribution center/customer type (or size). Your sales teams need to be able to access this Clearance Pricing worksheet on their tablets or mobile phones.
Focus on the problem, not the solution
The more unproductive inventory you carry, the more you tie up valuable cash in your wholesale business, unable to invest in more productive assets, and put your Gross Profit and EBITDA goals at risk. As a commercial leader, you can address this problem through simple, pragmatic solutions like an automated, dynamic markdown process.
You often don’t need “ML and AI” to drive 90%+ of the potential benefits that markdown pricing can generate. You can deploy a robust clearance pricing capability within 3-4 months, substantially improving your liquidity and profitability within the same year. You can also eliminate hundreds or thousands of hours each month spent on tactical clearance pricing efforts through spreadsheets or ad-hoc Sales team pricing negotiations with customers.
Visit our Margin Analytics & Optimization practice area to learn more, or contact us with any questions or comments.
Frequently asked questions about unproductive inventory
What is unproductive inventory?
Unproductive inventory is stock that ties up cash because it is not selling. It includes dead inventory that has not sold for a set number of weeks or months, the biggest driver of liquidity problems, and slow-moving or dying inventory whose sales have trended steeply down. It typically makes up 15% to 30% of a distributor’s merchandise and is often treated as a normal cost of running a wholesale business.
What causes unproductive inventory to pile up?
In the ABC Industries example, merchants jumped on attractive bulk-buy deals from manufacturers and bought 5 to 20 times more than they could sell within six months, with no process or analytical method to catch it. Unproductive stock grew to 35% of $500 million in inventory, tying up $175MM in cash and putting the company’s ability to meet obligations on asset-backed loans at risk.
How do you identify unproductive inventory?
Analyze historical inventory productivity metrics such as days on hand, turnover, and GMROI, and compare current inventory levels with expected demand. Dead items stand out by how long they have gone without a sale. For slow-moving items, combine sales trend analysis with customer concentration, for example checking whether only five of 50,000 customers still buy the product.
What does unproductive inventory cost a wholesale business?
Carrying costs such as storage, warehouse utilities, labor, and insurance typically run about 20% of inventory acquisition costs, and non-selling items make them worse. Unproductive stock also ties up cash, adds interest on the loans used to buy it, crowds out fast-moving products in the warehouse, and creates extra labor and management costs for ad-hoc clearance, transfers, and liquidation events.
How can distributors clear unproductive inventory?
Options include remarketing, repositioning stock to warehouses that have demand for it, selling to liquidators, donations, and, least desirable, accounting write-offs. Automated clearance pricing is one of the most effective and does not have to be expensive. Specialized inventory and price optimization software with clearance modules exists, but it is often prohibitively expensive for middle-market firms and too rigid for the changing nuances of the business.
How do you build a markdown pricing process?
Start by defining the goal, such as freeing up $100MM in cash within 26 weeks while investing no more than $15MM in markdowns, and bring in Sales, Supply Chain, IT, and Finance. Consolidate the data in a cloud analytical warehouse and build a simple engine around unit sales and days-on-hand goals, with limits on price investment and competitive price indexes. Then run internal roadshows, pilot, and launch with clearance pricing guidelines.
Do you need AI to run markdown pricing?
Usually not. A rules-based engine built on data-informed heuristics, with no machine learning or optimization algorithms, can capture 90% or more of the potential markdown benefits, and it can be built and deployed at 10x the speed and 0.01x the cost of a turnkey solution that claims to use ML and AI. A robust clearance pricing capability can be live within three to four months.
Related Reading
- Tariff Shockwaves & Margin Erosion: Why Mid-Market Industrial Firms Need Revenue Management as a Service Now
- RFM Analysis as an Important Revenue Growth Analytics Capability – Part 1
For broader industry perspective on pricing analytics and revenue growth management, see McKinsey’s Growth, Marketing & Sales insights.
Want a second opinion on your pricing?
Tell us what’s going on with your pricing. One of our partners will get back to you the same day or the next.






