


This guide provides pricing, RGM, finance, and commercial leaders with a clear understanding of the true costs of price wars, the break-even analysis needed to assess competitor price cuts, and a fight, flank, or fold framework for making account-level decisions rather than market-wide moves.
Table of Contents
September 2026 is a timely moment to discuss price wars, as several are underway. Walmart increased its rollbacks from about 7,200 items in Q1 to over 11,000 in Q2, partly funded by tariff refunds. Target reduced prices on more than 10,000 items and introduced hundreds of private-label food products. In August, eight Chinese polysilicon producers, representing over 90% of national capacity, pledged to stop selling below cost. Frontier AI model prices for comparable capabilities have dropped by approximately 90% over 18 months.
In July, Lowe’s observed competitors discounting grills and patio furniture using refund funds but chose not to match these promotions. This uncommon approach in price wars is the focus of this. A price war involves repeated competitive price cuts, leading to market-wide margin erosion. Before matching a competitor’s cut, calculate the break-even volume: at a 30% contribution margin, a 10% price cut requires a 50% increase in volume to maintain profit. Therefore, it is often more effective to fight selectively, use non-price strategies, or exit the segment instead of matching market-wide.the board.
The main issue is reflex matching: an automatic, market-wide response that appears safe, appeases the sales team, but ultimately transfers margin to customers who would have stayed regardless. The competitor’s initial move is only the beginning.
‘Price war’ definition: a sequence of retaliatory price cuts between two or more competitors in the same market, usually triggered by excess capacity, a new entrant, a misread competitive signal, or product commoditization, that transfers margin from every participant to the customer without a lasting change in market share.
What is a price war, and why do they start?
Normal price competition is healthy, with minor price adjustments and alternating contract wins, allowing the market to reflect cost and value. In contrast, a price war escalates with each cut, prompting a deeper response, spreading beyond contested accounts and lowering customer reference prices. When the price war ends, market shares remain similar, but all participants have reduced margins.
Rao, Bergen, and Davis made this point in their HBR classic on how to fight a price war more than two decades ago, and the core finding still holds: the best counterattack often does not involve a retaliatory price cut at all.
Price war vs. ordinary price competition
The distinction appears in speed, scope, and lasting impact. A price war accelerates typical price changes into weeks, expands from specific SKUs and accounts to list prices, and signals to buyers that previous prices were negotiable, which is difficult to reverse. Retailers often recognize this better than manufacturers, as reflected in PYMNTS’ description of the 2026 rollbacks as an effort to reset shopper reference prices rather than simply lower them.
The four triggers behind most price wars
Nearly every observed price war can be traced to one of four triggers, each requiring a distinct response.
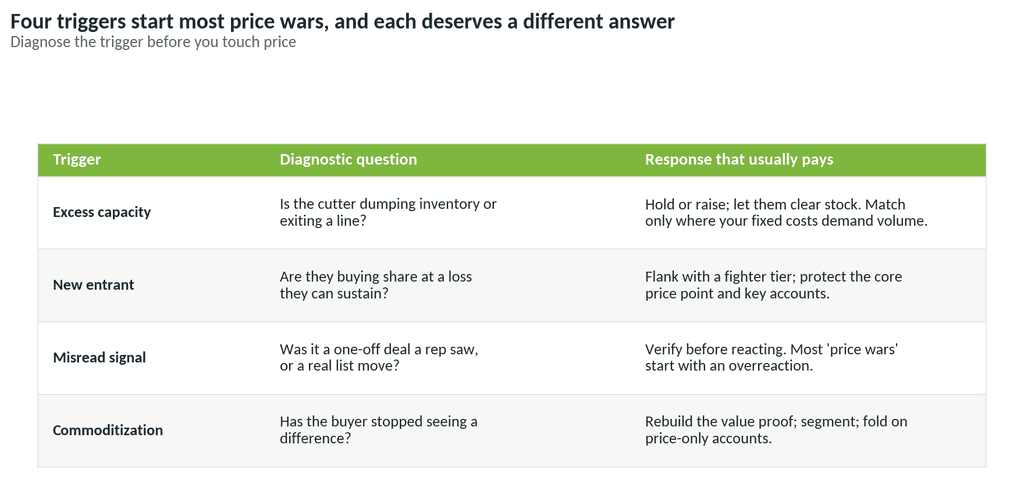
Four triggers that start most price wars, the diagnostic question for each, and the ideal response
Excess capacity is the most common trigger. For example, in China’s auto industry, profit margins dropped to 4.4% in 2025 and reached a historic low of 3.2% in early 2026, with over 70% of car sales incurring losses before regulators intervened. The second trigger is a new entrant seeking market share, which often appears more threatening than it is due to the entrant’s uncertain sustainability. Commoditization is a gradual trigger, occurring when buyers perceive no differentiation and focus solely on price.
The fourth trigger, often overlooked, is a misinterpreted competitive signal. Many price wars begin when a sales representative reports an aggressive quote, management assumes a broader price move, and the response inadvertently initiates a price war. This occurs frequently because few companies have accurate competitor pricing data. According to Revology’s 2025 Revenue Growth Analytics Maturity survey, 71% of organizations rely on ad hoc or fragmented competitive pricing data. Without visibility, it is impossible to diagnose the true trigger.
The real cost of matching: break-even volume math
Reflex matching persists because organizations rarely quantify the cost of initiating a price war. Calculating this cost is straightforward; it requires only your contribution margin and the size of the proposed price cut.
The price war break-even formula
Required volume change to hold contribution dollars
ΔV = −ΔP / (CM% + ΔP)
where ΔP is the price change as a share of the current price (negative for a cut), and CM% is the contribution margin before the cut.
Example: a 10% cut at a 30% margin → 0.10 / (0.30 − 0.10) = +50% volume.
Break-even price elasticity (gross-profit basis)
E(break-even) = −1 / (GP% + ΔP)
Example: 10% cut at 30% GP → −1 / (0.30 − 0.10) = −5.0. If your measured elasticity is less negative than −5.0, the cut loses money by construction.
The price war break-even formula reveals two key insights. First, the required volume increase grows much faster than the price cut: at a 30% margin, a 5% cut requires 20% more volume, a 10% cut requires 50% more volume, and a 15% cut requires 100% more volume. Second, low-margin businesses have minimal flexibility. For example, a distributor with an 18% gross margin needs about 6% more volume to offset a 1% price cut. If the cut equals or exceeds the margin, no increase in volume can compensate.
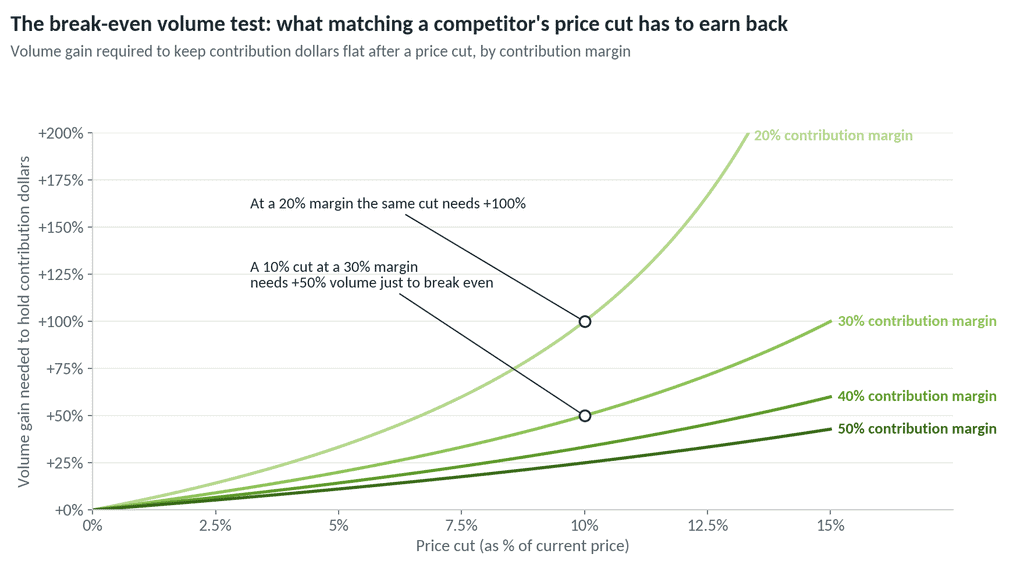
Price war break-even chart: volume gain required to hold contribution dollars after a price cut, by contribution margin
The volume gain required to hold contribution dollars, by contribution margin and depth of cut:
- 20% margin: a 3% cut needs +17.6% volume, a 5% cut +33.3%, a 10% cut +100%, and a 15% cut +300%.
- 30% margin: a 3% cut needs +11.1%, a 5% cut +20.0%, a 10% cut +50.0%, and a 15% cut +100%.
- 40% margin: a 3% cut needs +8.1%, a 5% cut +14.3%, a 10% cut +33.3%, and a 15% cut +60.0%.
- 50% margin: a 3% cut needs +6.4%, a 5% cut +11.1%, a 10% cut +25.0%, and a 15% cut +42.9%.
Compare these price war thresholds to actual demand. Most B2B and consumer categories have measured own-price elasticities between −0.5 and −2.5. Our previously published break-even price elasticity analysis confirms this: a 40% year-end discount on a product with a 50% margin would require an elasticity of −10 to maintain gross profit, which is unrealistic.
Worked example: a $400M distributor facing a 10% competitor cut
Take a $400M industrial distributor. One product family generates $60M in revenue at a 28% contribution margin, contributing $16.8M per year. The largest rival cuts the list price on that family by 10%. Twenty contested accounts account for about 25% of the family’s revenue, and the distributor’s measured elasticity for the family is −1.8. Those are the assumptions; here is the price war math.
Step 1: Compute the break-even volume. ΔV = 0.10 / (0.28 − 0.10) = +55.6%. To match everywhere and hold $16.8M, volume has to rise by more than half.
Step 2: Compare it with what elasticity supports. At −1.8, a 10% cut yields roughly +18% volume, a third of what break-even requires. Matching across the family produces $60M × 1.18 × 18% unit margin, or about $12.7M of contribution. That is a $4.1M loss versus doing nothing at all.
Step 3: Price the alternatives. Hold list price and do nothing, and the contested accounts drift: assume 12% of family volume walks, which leaves $14.8M, a $2.0M loss. Fold deliberately by ceding the pure price buyers (about 10% of volume) and redeploying the sales time, and contribution lands near $15.1M, a $1.7M loss before any cost-to-serve savings. Flank by holding list, giving the 20 contested accounts a 5% targeted concession tied to volume commitments and contract term, and accepting that about 3% of volume still leaves, and contribution is about $15.6M, a $1.2M loss.
Step 4: Decide with the numbers in front of you. Matching costs 3.4 times as much as the flank response. Every option loses something, because a rival’s cut is a real event, but the spread between the reflex answer and the targeted answer is nearly $3M on a single product family.
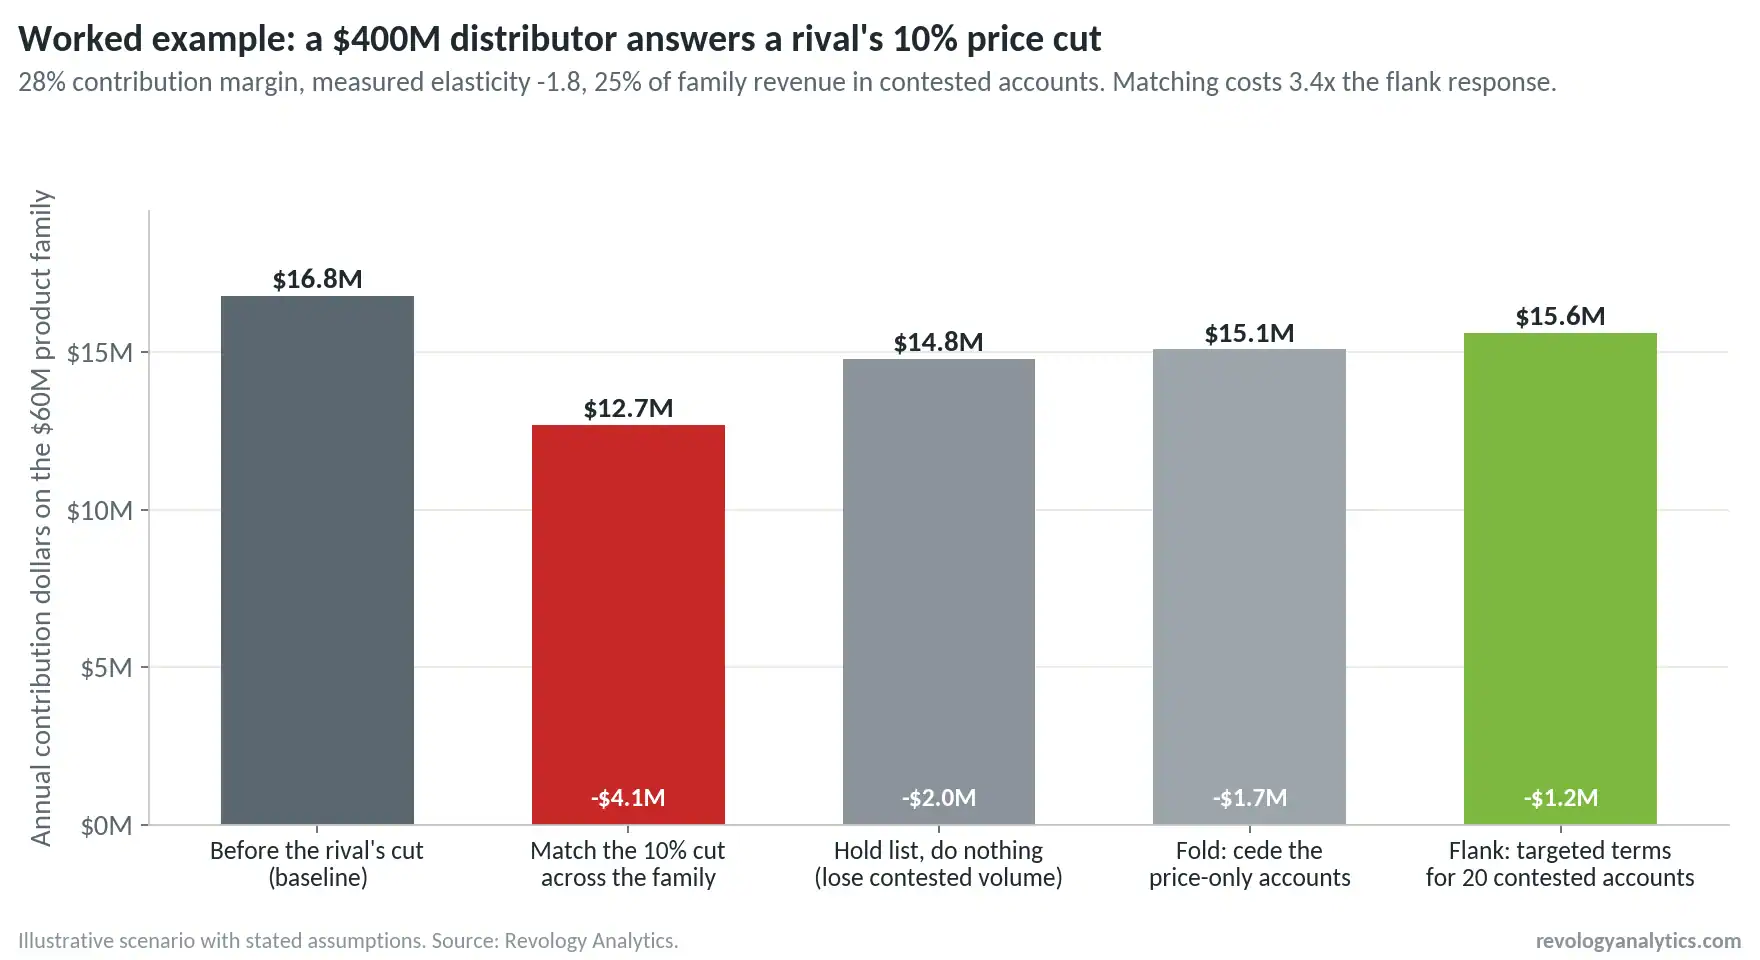
Worked example of a distributor’s response to a rival’s 10% price cut: contribution dollars under match, hold, fold, and flank options
Learn how customers react to price changes
Our free 50-page guide, Mastering Price Elasticity Modeling, shows step by step how to measure the way your customers respond when prices go up or down.
Reading break-even against your measured elasticity
The example is valid only if the measured elasticity of −1.8 is accurate. Elasticities derived from textbooks or isolated promotions are insufficient for significant decisions. Often, teams defend the wrong products based on unreliable data.
When we ran a Double Machine Learning price elasticity model across the retail portfolio of a global technology hardware manufacturer, the spec-led enterprise lines showed own-price elasticities near −1.0 and competitor cross-elasticities of 0.3 to 0.5, while the commoditized consumer lines showed cross-elasticities of 0.7 to 1.2. The company had been matching competitor cuts on both, which is how a price war spreads from the products that deserve a fight to the ones that never needed one.
Aligning pricing responses with actual cross-elasticity and maintaining prices where cross-elasticity was low resulted in a 1- to 2-point increase in EBITDA margin in the first year.
The asymmetry that makes this worth doing carefully is the same one that makes pricing power valuable in the first place. According to Revology’s research of 2,000 global companies, a 1% improvement in price realization produces a 6-7% lift in operating profit. Excluding highly regulated industries, this figure is in the 10-11% range. A price war trades that multiplier away one point at a time.
Fight, flank, or fold: the price war decision framework.
An effective response to a price war involves a range of strategies. Our recent pricing power scorecard recommends using break-even analysis rather than reflexive action. Once you have the data, evaluate each account and segment based on two criteria: the extent to which the rival’s price influences the buyer (cross-price elasticity, switching costs, specification-driven buying) and the account’s value to your business (profitability, strategic importance). Make decisions accordingly.
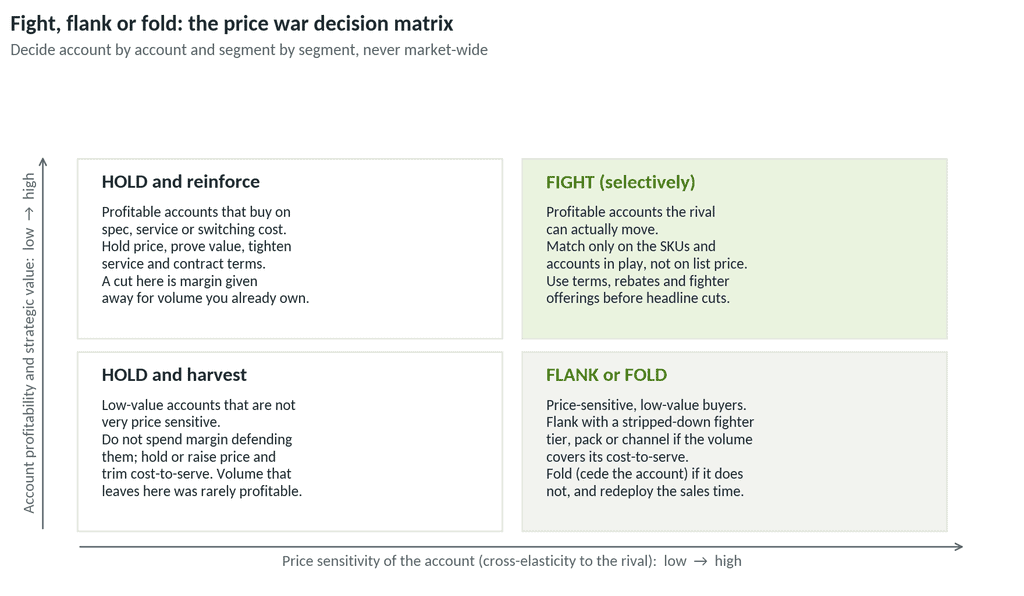
Price war decision matrix: fight, flank, or fold by account price sensitivity and account profitability
Fight: when to match, and how to match surgically
In a price war, fight where the account is profitable, and the rival can actually take it. Even then, match the SKUs and accounts in play rather than list price, and match through terms, rebates, and fighter offerings before headline cuts. The hardware manufacturer above learned a second lesson here: on Amazon, the first-party algorithm mirrored any third-party price drop within hours, so promotions launched in the same week as a competitor’s produced almost no lift, while promotions timed to high-traffic weeks when rivals sat at everyday price captured a large share shift. Fighting well is as much about timing and fencing as it is about depth.
Flank: non-price and partial responses
Flanking addresses a price war with alternatives to core price reductions. A classic example is the fighter brand. In the early 1990s, Procter & Gamble reduced Luvs’ price by 16% and lowered its costs while maintaining Pampers’ price, thereby widening the value gap and competing across market segments without sacrificing overall margins. The key metric is the breakeven cannibalization rate, calculated as the fighter brand’s unit contribution divided by the flagship’s unit contribution. If cannibalization from premium buyers remains below this rate, the flanking strategy is effective.
Flanking can also involve adjusting terms. For example, a national sparkling-water brand faced a retailer’s request for a 16-week deep rollback on scan-funded terms, which would have resulted in negative distributor margins. Instead, the brand offered a pure off-invoice structure at a slightly higher price, generating approximately $1.8 million more gross profit over the period, with 193,000 units of volume conceded and $1.3 million in distributor margin compressed, an outcome the team proactively managed. Other flanking tools include bundles, service tiers, extended warranties, contract escalators, and payment terms.
So does the negotiating posture the pricing literature recommends when a buyer reports a lower competitive offer: if they can truly meet their needs at a much lower price, it is in their interest to accept it, and those who are bluffing rarely do.
Fold: when ceding the segment is the profitable move.
Folding in a price war means declining to pay for volume that was never profitable. Lowe’s gave the cleanest public example this summer. When competitors used tariff refunds to discount seasonal categories in July, CEO Marvin Ellison told investors: “We did not choose to match some of those promotions because they were not in our financial plan, nor did we think it was financially prudent to match them.” Comparable sales went from +1.7% in June to −1.2% in July, the quarter still finished positive, and the gross margin stayed intact, as reported in Lowe’s second-quarter results and call coverage.
The same beverage brand chose to exit a premium sub-brand for a different reason: conjoint analysis revealed the issue was brand perception, not price. A price cut would have only reduced margins without addressing the underlying problem.
In summary, the three responses can be combined as follows:
- Fight where the account is profitable, switching costs are low, and cross-elasticity is high. The tools are a selective match on the contested SKUs, targeted rebates, and timing. The main risk is that cuts leak into uncontested accounts, so watch the relative price index and the win rate in contested accounts.
- Flank when buyers are price-sensitive but valuable, or when protecting a flagship price point. Use tools such as fighter-tier, pack, channel variants, terms, bundles, and unbundled services. The primary risk is cannibalization of the flagship, so monitor the breakeven cannibalization rate and product mix.
- Fold when buyers are solely price-driven, unprofitable, and disloyal, or when competitors are temporarily funded. This involves ceding volume and reallocating sales resources and cost-to-serve. The main risks are internal perception and short-term volume loss, so track contribution per account and overall portfolio margin.
Price war playbook: 5 proven moves before you cut price
Move 1: Diagnose the trigger before you respond. Confirm the cut is real, list-level, and sustained before doing anything else. The pricing literature has a well-known case of an industrial supplier whose sales team prepared to match a rival’s prices, slashing prices across several accounts, until intelligence indicated the rival was exiting the category and clearing inventory. The supplier instead raised prices by 5% to 7%. The question from Nagle and Cressman still applies: what will the competitor do if we respond with a cut, and is there a response that costs less than losing the sale?
Move 2: Conduct break-even analysis by segment. A single company-wide break-even number is insufficient. Calculate the required volume gain and break-even elasticity for each product family and segment, then compare these to your measured elasticities. If the required volume exceeds what elasticity supports, do not match, regardless of sales input.
Move 3: Map the battlefield account by account. In most distributors, the top 20% to 30% of customers generate 150% to 200% of net profit, while the bottom 30% to 50% destroy a large share of it. A price war fought on averages defends the second group with the first group’s margin. Overlay cross-price elasticities by segment and track three to five core competitors on pocket price, not list price, so the map reflects what buyers pay.
Move 4: Use the most targeted effective response. In a price war, start with non-price levers, then consider limited actions restricted to specific regions, segments, channels, or time periods. Only as a last resort, selectively adjust key value items that influence your price image. A market-wide price cut should be the final option and must have a predetermined exit date.
Move 5: Write the rules of engagement in advance. The beverage brand’s guardrails are a good template: a 25% gross-margin floor per product group, a maximum volume loss of 17% before the plan is reopened, deep promotions capped at 12 weeks a year in national accounts and zero in convenience, a competitive price-index ceiling of 112 against branded rivals, and no single increase that moves the index more than 12 points.
Establish clear decision rights, including one accountable owner per pricing decision, a deal desk for exceptions beyond set parameters, and a pricing committee led by someone without a sales quota. Apply the two-time rule: if the same exception is requested twice, it indicates a policy gap rather than an exception. Rules created during a crisis tend to be overly lenient.
Price war scenarios by industry: CPG, retail, distribution, industrial
The price war framework applies universally, though the specific triggers and effective responses vary by industry.
- CPG (branded): The typical trigger is private-label pricing at 40% to 50% below branded products, supported by retailer-enforced matching and back-billing. Effective strategies include maintaining the frontline list price, using promotional structures and packaging rather than list-price cuts, and flanking with a fighter pack or a value tier. Monitor the price index against private label, promotion depth, and duration, and deductions as a percentage of gross sales.
- Retail. The usual trigger is a rival funded by a windfall or a new format; value retailers were growing 11.6% year on year in early 2026, compared with 2.3% for conventional supermarkets. What pays is defending the key value items only, holding on to background items, and folding on unprofitable categories. Watch the basket price image, the KVI index, and gross margin by category.
- Distribution: Typical triggers include decentralized quote-level discounting, competitors’ liquidating inventory, or increased marketplace transparency. Effective strategies are implementing price floors in CPQ systems, escalating exceptions to a deal desk, exiting unprofitable tail accounts, and applying index-linked surcharges for cost shocks. Monitor pocket price by account, exception rates, and cost-to-serve.
- Industrial manufacturing. The usual trigger is overcapacity, a low-cost entrant, or spec-driven commoditization. What pays is holding on spec-led products, flanking with a standardized fighter line, and using contract escalators tied to indices. Watch cross-elasticity by product line and the win rate on contested bids.
Tariffs deserve a note because 2025 and 2026 turned cost shocks into price-war triggers across industry after industry. Manufacturers that passed tariffs through as itemized, index-linked surcharges rather than list-price increases kept the conversation with customers about cost rather than competitor prices, and they are now able to reverse the surcharge cleanly as refunds of roughly $165 billion in invalidated IEEPA duties flow back to importers. We covered the mechanics of pricing strategies to counter tariff impacts.
Common misconceptions about price wars
“Matching is the safe option.” In reality, matching is often the most expensive approach in nearly all margin structures, as demonstrated by the break-even analysis above. It appears safe because the costs are distributed across all accounts rather than being visible as a single lost deal.
“The lowest-cost player always wins.” The lowest-cost competitor may win the war of attrition, but profitability is not guaranteed. For example, China’s automakers captured 61% of the global EV market share, yet more than half the industry operated at a loss.
“Price wars are illegal.” Below-cost pricing by a competitor is generally lawful. The Federal Trade Commission’s guidance on predatory pricing is blunt: low prices generally benefit consumers, and courts have been skeptical of predatory pricing claims unless there is a dangerous probability the discounter can recoup its losses later. Plan to defend yourself in a price war with commercial tools; the courts will rarely do it for you.
“Volume comes back when prices recover.” Reference prices reset. Mela, Gupta, and Lehmann’s eight-year scanner study found that heavy promotion raises long-run price sensitivity, and premium brands are hurt most. The August reference-pricing carousel that drew the most reach of anything we published this year made the same point: every price gets judged against a price you may not control, and a price war hands that control to the customer. Read more in reference to the pricing strategy.
“Customers only care about price.” In B2B markets, factors such as switching costs, service levels, terms, and risk are often more important than price. If a buyer cites a lower price but does not switch, the price was not the deciding factor.
Frequently asked questions about price wars.
What is a price war?
A price war is a cycle of retaliatory price cuts among competitors in the same market, in which each reduction is matched or undercut until margins collapse for all participants. It differs from normal price competition in speed, scope, and how it resets customers’ reference prices.
What causes a price war?
Four triggers explain most of them: excess capacity to be filled, a new entrant buying shares, a misread competitive signal that provokes an overreaction, and commoditization that leaves buyers with no basis for choice other than price. Revenue-based sales incentives make all four worse.
Should you match a competitor’s price cut?
Only where the break-even math and your measured elasticity say the volume can materialize, and only on the accounts and SKUs the rival can actually take. Match surgically through terms, rebates, or fighter offerings before touching the list price.
How do you calculate the volume needed to break even after a price cut?
Divide the cut by the contribution margin minus the cut: ΔV = −ΔP / (CM% + ΔP). A 10% cut at a 30% margin needs +50% volume; at a 20% margin, it needs +100%.
How do price wars end?
Through capacity exit or consolidation, through price leadership when a large player signals an increase and rivals follow, through regulation, as in China’s 2026 below-cost bans, or through exhaustion when the participants cannot fund further cuts. They rarely end with shares meaningfully changed.
Is a price war illegal?
Usually not. Below-cost pricing is unlawful predation only when it is part of a strategy to eliminate rivals with a real prospect of recouping the losses afterward, a standard that US courts apply skeptically. Coordinating with competitors to end a price war is illegal.
Who wins a price war?
Most often, the customer, in the short run. Among competitors, the winner is the firm with the lowest cost, the deepest pockets, or the most differentiated position, and even the winner typically ends with lower margins than before.
The best-studied modern case is the Dutch grocery price war that began in late 2003: in a four-year panel of 1,821 households, van Heerde, Gijsbrechts, and Pauwels found that the market-leading initiator stopped its share decline and hard discounters gained, while mid-market and premium chains lost, shoppers became more price sensitive, and spending per visit eventually fell as households spread purchases across stores.
How do you avoid a price war in the first place? Publish clear pricing intentions, keep prices competitive on the few key value items that define your price image, differentiate on service and terms, build switching costs, maintain an accurate competitive price index, and write rules of engagement before a rival forces the question.
Key takeaways and a next step
Key takeaways
A price war transfers margin to the customer: shares end where they started, and profit ends lower.
Run the break-even math first. A 10% cut at a 30% contribution margin needs +50% volume; at 20%, it needs +100%.
If the required volume exceeds what the measured elasticity supports, matching loses money by construction.
Choose fight, flank, or fold account by account, never market-wide.
Write the rules of engagement before the first shot: floors, no-go zones, maximum duration, decision rights, and exit criteria.
A 1% improvement in price realization lifts operating profit 6-7% (Revology, Pricing Still Packs a Punch, 2025). A price war trades that away.
If a competitor has recently reduced prices or you anticipate a price war, the next step is to act promptly. Revology’s pricing strategy and monetization advisory team can conduct a competitive-response diagnostic within a few weeks, providing measured elasticities by segment, a break-even model for relevant products, an account-level fight, flank, or fold map, and a concise set of rules of engagement for your deal desk to implement immediately.
The models and the data stay with your team when we leave, which is the point. A price war is easier to sit out when you can show your board, in their own numbers, what matching would have cost.
Want a second opinion on your pricing?
Tell us what’s going on with your pricing. One of our partners will get back to you the same day or the next.






