
Table of Contents
A practical guide for CFOs, commercial leaders, and PE operating partners: what pricing power actually is, and the associated metrics, KPIs, and pricing levers that improve it.
Procter & Gamble rode price increases for four straight years. Pricing contributed 13 points of organic growth from fiscal 2023 through 2026, while volume added almost nothing. Then, in the June 2026 quarter, the engine stopped: price, volume, and mix all contributed zero. P&G’s CFO told investors the company now has to earn its value every day. That sentence should be pinned above every commercial leader’s desk, because it describes the moment most of the market is living through right now. The inflationary years allowed almost everyone to raise prices. They also let almost everyone confuse a rising tide with pricing power.
Pricing power is a company’s ability to raise or hold prices without losing enough volume to hurt profit. You measure it through five observable metrics: net price realization, relative price position, price elasticity, volume retention after increases, and gross margin durability against input costs. And you build it deliberately, through value proof, segmentation, offer architecture, and pricing capability, rather than inheriting it from a hot market.
The distinction mentioned is particularly significant in 2026, more so than it has been in the past decade. According to the Bureau of Labor Statistics, producer prices were still nearly 5% higher than the previous year in July. However, consumers and B2B buyers are no longer accepting price increases without question. Although costs continue to rise, acceptance of these price hikes has stalled. Companies that are able to maintain their profit margins amid this pressure are those that see pricing power as an asset that can be measured and developed. Warren Buffett stated to the Financial Crisis Inquiry Commission that “the single most important decision in evaluating a business is pricing power.” Investors take this into account when assessing valuations. Unfortunately, few operators can provide concrete data to demonstrate the extent of their pricing power.
What Is Pricing Power?
| Definition: Pricing power is the degree to which a business can increase prices without a proportionate loss of demand. High pricing power means customers accept price increases because the offering is differentiated, switching is costly, or value is well-proven. Low pricing power means increases leak away in discounts, exceptions, and volume loss. |
There are two key factors to consider regarding pricing. The first is external pricing power, which refers to the extent to which your customers, competitors, and the overall market allow you to set prices. This includes aspects such as product differentiation, customer switching costs, brand equity, and supply concentration.
The second factor is internal price execution, which looks at how much of the price you are theoretically entitled to actually remains with you. This involves elements like discount governance, contract terms, discipline in managing freight and rebates, and your quoting behavior.
Many leadership teams focus on the first issue while overlooking the second. In our experience, the second issue is where significant value lies. A company may possess substantial external power, but it can still lose that advantage through wide-ranging discount practices and ad hoc exceptions. This brings us to the main concern of this article: pricing drift. Pricing drift refers to the gradual, unmanaged decline in realized prices that is not attributable to any single decision and lacks clear ownership. It is what transforms a 4% price-increase announcement into just a 1.5% actual gain. Pricing drift rarely appears in board presentations but is always evident in the price waterfall analysis.
Robert J. Dolan and Hermann Simon made an important distinction thirty years ago in their book, *Power Pricing*. They separated two types of pricing strategies: “everyday pricers,” who accept that the market determines prices and focus their efforts on increasing volume and reducing costs; and “power pricers,” who view pricing as a managed tool for extracting value.
Power pricers operate based on four principles that will likely seem familiar by the end of this article:
1. An active approach to pricing
2. Detailed fact files on customer value and their willingness to pay
3. Quantitative tools such as break-even analysis
4. A strong organizational commitment to implement these strategies
Although the terminology originates from 1996, the gap it highlights continues to show up in earnings calls as late as 2026.
Is pricing power the same as inelastic demand? Not exactly. Elasticity is just one factor—it reflects the characteristics of your demand curve at current prices. Pricing power, on the other hand, encompasses a wider range of elements: elasticity, your competitive position, and your ability to implement price increases effectively. Even if you face inelastic demand, you might still struggle to capitalize on it if your discounting practices are not disciplined. Many companies experience this issue.
Why Pricing Power Is the Most Undermanaged Profit Lever
The math has been settled for thirty years; however, the discipline is still not fully embraced. According to Revology’s research of 2,000 global companies, a 1% improvement in price realization can lead to a 6% to 7% increase in operating profit. In industries that are not highly regulated, this increase is typically in the range of 10% to 11%. This data is sourced from “Pricing Still Packs a Punch” (Revology Analytics, June 2025), which revisited the classic 1992 profit-sensitivity analysis using current data. The potential benefits are substantial and are even greater in the automotive, industrial, and consumer sectors than the blended median indicates.
Dolan and Simon made the same case with a worked industrial example in Power Pricing: for a typical manufacturer earning a 10% return on sales, a 10% price improvement doubles profit, while a 10% volume gain adds only 40%. The arithmetic cuts just as hard in reverse. At those economics, a 20% price cut needs volume to double before profit recovers, while a 20% increase can shed a third of its volume and still protect the baseline. Price is the strongest profit driver a commercial team touches, in both directions.
Yet the same research program found that half of the 158 commercial organizations surveyed sit stuck in medium analytics maturity, and only 1.9% operate at the top tier. Sixty-three percent cannot quantify the incremental ROI of their own promotions. If you cannot see realization, elasticity, or promo lift, you cannot manage pricing power; you can only announce increases and hope.
The public markets are now distinguishing between merely announcing results and effectively managing performance. Take a closer look at PepsiCo’s second-quarter results for 2026: the company reported 2.4% organic growth, which was made up of approximately two percentage points from effective net pricing and one percentage point from volume overall. However, in North America, the convenience foods segment experienced negative pricing, while international franchises showed strong performance with three to four percentage points of pricing growth along with increasing volume. It’s the same company and the same quarter, yet the pricing power varies significantly across different business segments. Averages can obscure these differences, but scorecards reveal them.
The tide that once lifted everyone’s spirits has receded. Procter & Gamble’s fiscal 2026 results indicate that the contribution of pricing to organic growth has declined significantly, dropping from +7 percentage points in fiscal 2023 to just +1 in both 2025 and 2026, with the June quarter showing no growth at all. When one of the most disciplined companies in pricing adjusts its approach to generating increases on a product-by-product basis, it signals the end of the era of blanket price increases, where the same percentage was applied across all SKUs and customers. This trend will likely impact the rest of us as well.
How to Measure Pricing Power: A 5-Metric Scorecard
You shouldn’t assess pricing power based on surveys or gut feelings. Instead, it should be evaluated through five key numbers that your data already includes. These numbers should be analyzed together and monitored on a quarterly basis. Here’s the scorecard we develop with clients, along with indicators of what a healthy pricing power looks like for each metric.
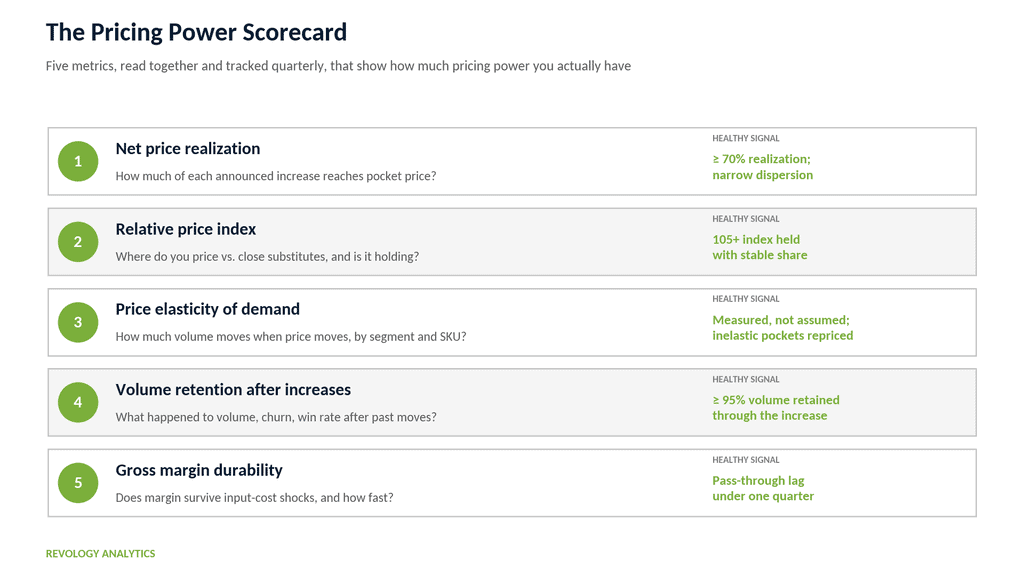
Pricing power scorecard: five metrics with healthy ranges: net price realization, relative price index, elasticity, volume retention, margin durability
1. Net price realization: the first pricing power test
Net price realization (NPR) measures how much of your list or announced price actually survives the trip through discounts, rebates, freight concessions, terms, and off-invoice leakage to reach the pocket price. The diagnostic here is the pocket-price waterfall Michael Marn and Robert Rosiello introduced in 1992, and the Deloitte pricing leaders behind Pricing and Profitability Management still treat it as the definitive tool of transactional pricing, for good reason. Their classic case: a $6.00 list price that invoiced at $5.78, then bled quick-payment discounts, volume bonuses, co-op advertising, and freight absorption until only $4.47 reached the pocket. That is 22.7% of the list gone, most of it below the invoice line where revenue reporting never looks.
Build the waterfall, then track two things: the realization rate of each announced increase (pocket price change divided by announced change) and the dispersion of pocket prices for similar customers buying similar volumes. A 4% increase that pockets 1.5% is a 38% realization rate, and a warning. Wide dispersion is pricing drift made visible: it means your effective price is being set customer by customer, in the field, without governance.
2. Relative price index, held over time
Price yourself against your two or three closest substitutes, weighted by where you actually compete. The index itself matters less than its trajectory paired with share: sustaining a 105–110 index with stable share is demonstrated pricing power; drifting from 110 to 102 to defend volume is the opposite, whatever the strategy deck says. In distribution and B2B, run the same index at the quote level against won and lost deals.
3. Measured price elasticity, not assumed
Price elasticity of demand tells you how much volume moves when the price moves. Below roughly 1.0 in absolute terms, demand is inelastic, and price captures more revenue than it loses. The catch: most teams either assume a blended number or borrow one from a category study. Modern methods, including Double Machine Learning elasticity models that strip out promotion, seasonality, and mix effects, produce elasticities by SKU, segment, and channel. That granularity is where the power sits, because portfolios are never uniformly elastic. There are inelastic pockets in nearly every book of business, and they are usually underpriced.
4. Volume retention after increases
The most effective natural experiment you have is your last price increase. For each significant action taken in the past 24 months, compare volume, churn, and win rates in the two quarters following the increase against the preceding baseline, analyzing this data on a customer-by-customer basis. Retaining 95% or more of your volume after the price increase demonstrates pricing power and suggests you may have left money on the table. Conversely, a loss of 15% indicates a potential issue. Many companies fail to close this loop, meaning that each future price increase is based on anecdotal evidence rather than solid data.
5. Gross margin durability against input costs
Plot your gross margin percentage against your input-cost index (PPI for your category, or your actual COGS basket) over the past twelve quarters. Durable or expanding margin through a cost shock is that power in action: it means you passed cost through and kept it. Margin that compresses for two quarters after every cost spike quantifies your pass-through lag, and each month of lag is a number your CFO can put a dollar figure on. With producer prices still up 4.7% year over year, this is the metric under the most stress right now.
A worked example. Take a $500M distributor at 8% operating margin ($40M) and 30% gross margin, announcing a 4% increase on a flat-demand book:
Step 1: Measure realization. Pocket price rises 1.8% against the 4% announced. Realization rate: 1.8 ÷ 4.0 = 45%. The waterfall shows the leak: 90 basis points to new discount exceptions, 70 to rebate creep, 60 to freight waivers.
Step 2: Compute the profit stakes. Each realized point on $500M is $5M of revenue that flows straight to operating profit. Closing the gap from 1.8% to 3.0% realized is worth $6M, a 15% lift in operating profit with zero new volume.
Step 3: Check the volume risk. Breakeven volume loss = price increase ÷ (gross margin % + price increase) = 4 ÷ (30 + 4) = 11.8%. Measured portfolio elasticity of −1.2 predicts roughly 4.8% volume loss on a 4% move. Plenty of headroom: the increase stays profit-accretive even if elasticity runs 50% worse than modeled.
Step 4: Set the floor. Governance target: ≥70% realization on the next increase, dispersion band tightened by a third, reviewed monthly. That is management, not hope.
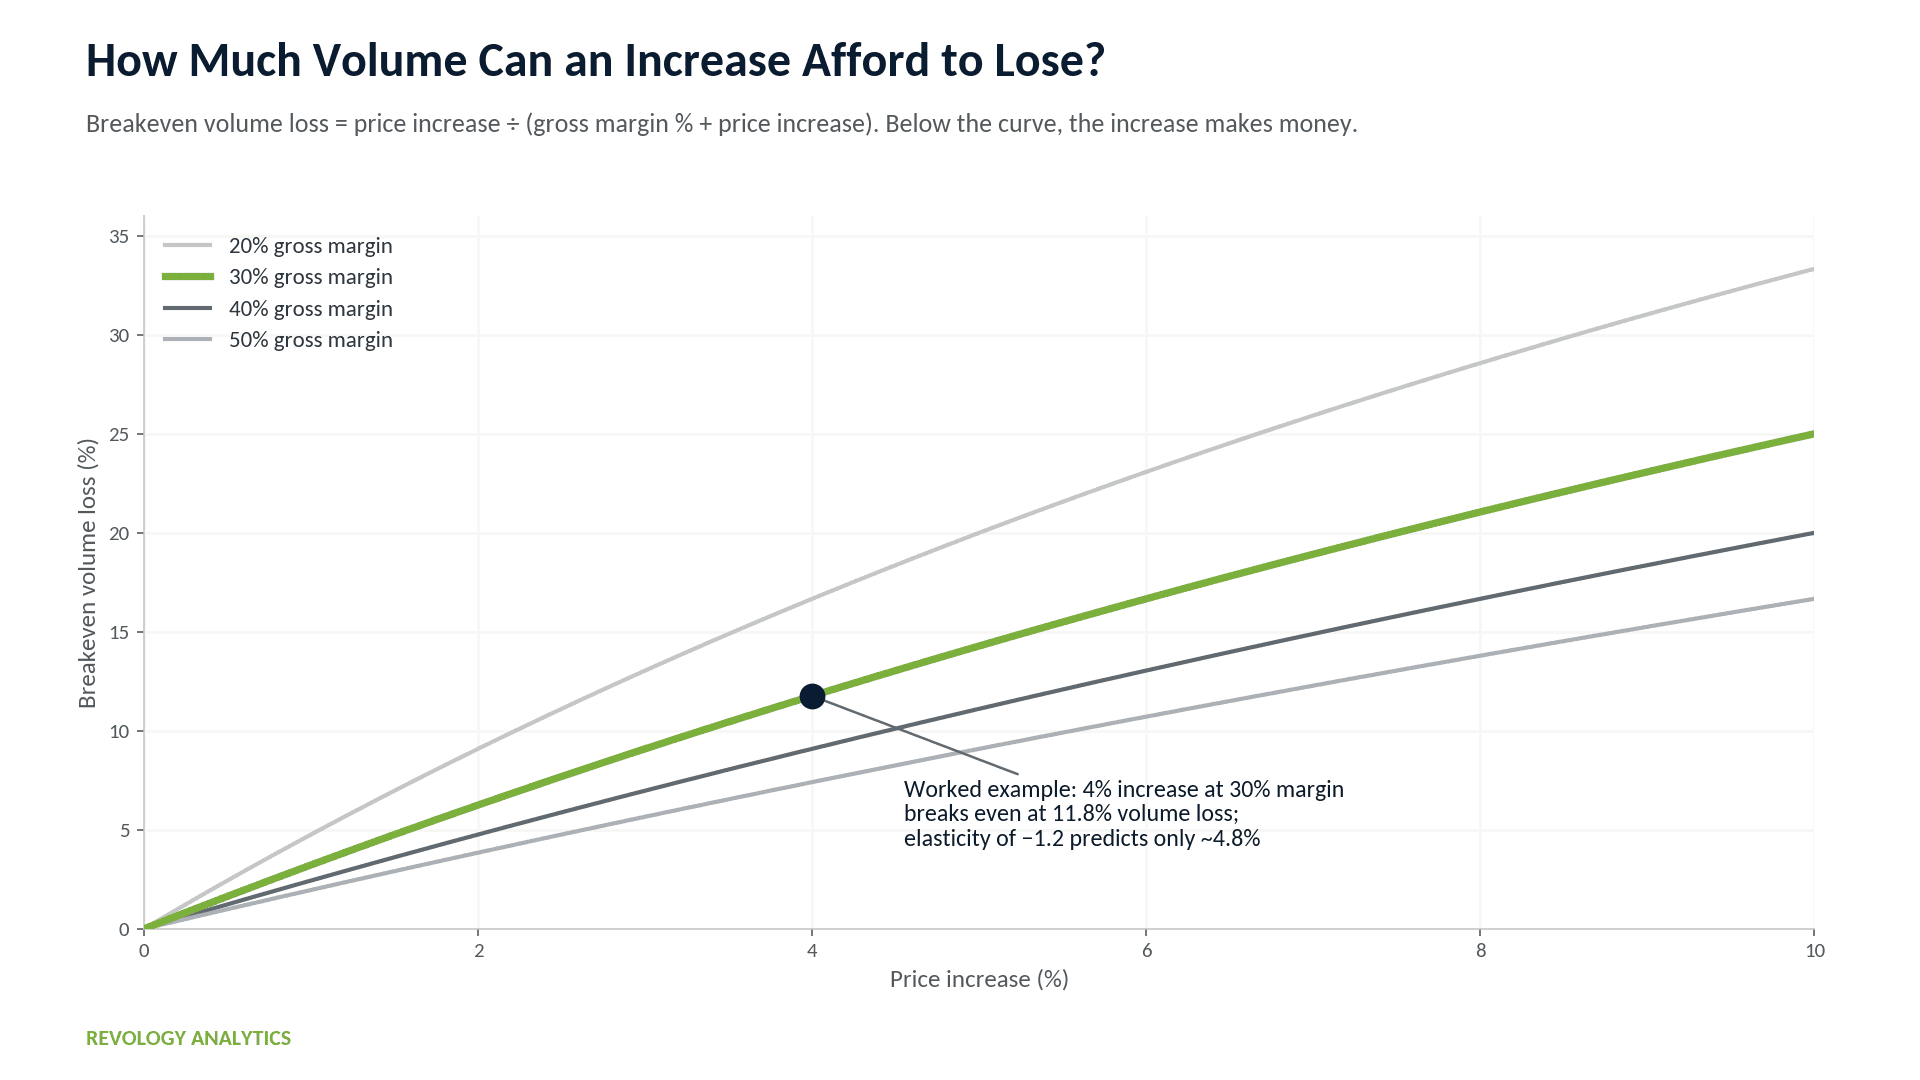
Breakeven volume loss curve by gross margin, with the 4% increase example marked at 11.8%
The 7 Levers That Build Pricing Power
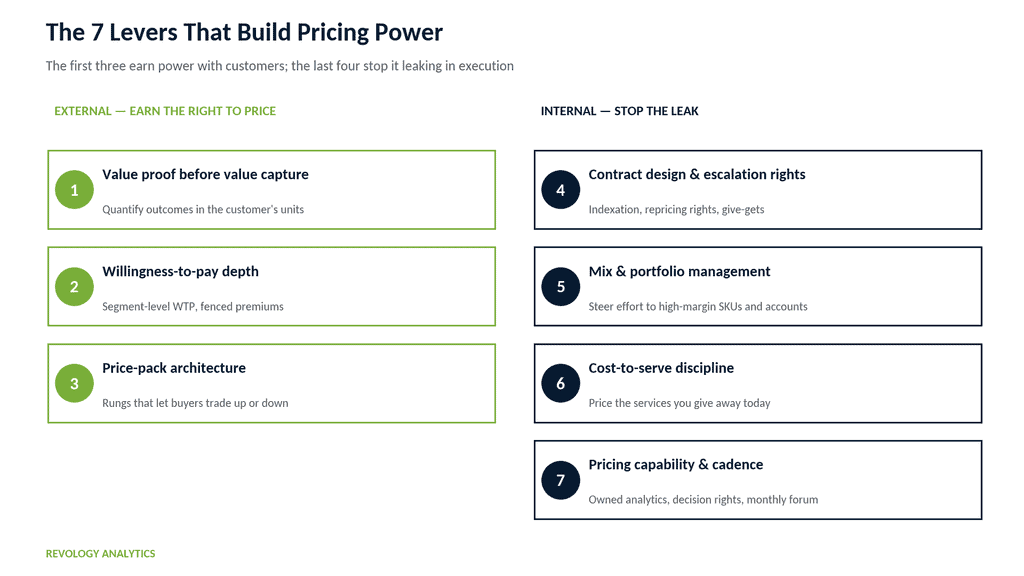
The scorecard indicates your current position. There are seven key factors that influence this reading. The first three focus on enhancing external power, particularly with customers, while the last four aim to address internal issues related to execution. Most companies typically need to implement two or three of these factors in sequence, rather than attempting to apply all seven at once.
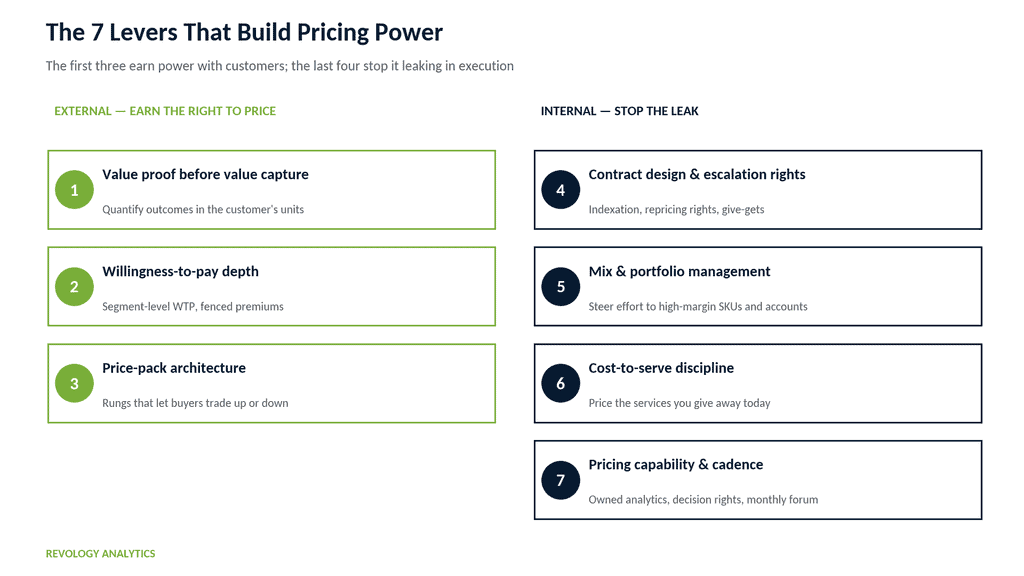
The 7 levers that build pricing power, grouped into external value levers and internal execution levers
1. Value proof before value capture
Customers pay for outcomes they can verify. Quantify what your offer saves or earns for each segment, in their units (downtime hours, scrap rate, working capital days), and arm sellers with that math. This is the foundation of value-based pricing done properly, and it converts price conversations from cost-plus defense into ROI arithmetic. A PE-owned footwear brand we supported delivered an eight-figure gross margin improvement largely through this shift: segmented, value-based price setting where uniform pricing had been leaving the premium segments underpriced.
2. Willingness-to-pay depth, by segment
Averages destroy pricing power. Dolan and Simon quantified the cost of ignoring this: under a linear demand curve, a single flat price captures only about half of the market’s profit potential, with a quarter lost to buyers priced out and a quarter left in the pockets of customers who would have paid more. Measuring willingness to pay at the segment level, through transaction modeling, choice-based research, and win-loss analysis, reveals that some customers value your speed, others your reliability, others your risk absorption, and they will pay differently for each. Segmentation with fences (volume commitments, service tiers, channel terms, timing) lets you charge each segment closer to its ceiling without leaking the premium price to everyone.
3. Price-pack architecture and offer design
When a straight increase would snap, re-engineer the offer instead. Price-pack architecture creates rungs: pack sizes, bundles, service tiers, and good-better-best structures that give price-sensitive customers a landing spot while premium buyers trade up. On the bundle question, Power Pricing is specific: mixed bundling, where customers can buy the package or the pieces, typically outearns both pure bundles and pure a-la-carte, because it serves extreme and balanced preferences at once. Every rung you add is an increase you can take somewhere without losing the customer entirely, which is precisely what pricing power means in categories under pressure.
4. Contract design and escalation rights
Pricing power that cannot be exercised through contracts does not exist. Review your portfolio for evergreen pricing, missing indexation clauses, and increase caps. Establish cost-escalation clauses linked to published indices, and implement 60 to 90-day repricing rights. Maintain a give-and-get approach: do not offer any concessions without receiving something in return, such as increased volume, longer terms, product mix changes, or adjusted payment terms. In the B2B sector, the contract is where power is either secured or lost years in advance.
5. Mix and portfolio management
Realized price moves when mix moves, whether you manage it or not. The Meehan team calls the underlying failure the volume-incentive trap: pay sellers on revenue or units and you have hired an army that discounts to close, because nothing in their compensation feels a bad price. Re-point incentives at realized margin, then steer selling effort, shelf priority, and quote priority toward high-margin SKUs, services, and accounts, and fix or exit the chronic value-destroyers. A privately owned pet products company took this route through a portfolio, channel, and pricing reset: over 3% margin improvement and 50% revenue growth on key accounts, without a headline list increase doing the work.
6. Cost-to-serve discipline
Unpriced services represent discounts that you did not agree to. Services such as expedited orders, small drops, custom specifications, extended payment terms, and free freight all come with costs. By charging for these services or creating pricing tiers, you can recover your margins and positively influence customer behavior. By combining the price waterfall with a detailed analysis of customer-level cost-to-serve, you can identify unprofitable areas that may be obscured within average margins.
7. Pricing capability: the muscle behind every other lever
None of the above survives contact with the field unless someone owns pricing, the data is instrumented, and the operating cadence exists. That means a pricing function with decision rights, elasticity and realization analytics refreshed on cycle, and a monthly forum where increases are planned and post-mortemed.
Pricing and Profitability Management structures this maturity as six competencies (pricing strategy, price execution, advanced analytics, organizational alignment and governance, technology and data management, and tax effectiveness) and warns that standing up a real pricing organization changes decision rights across sales, marketing, and finance, so treat it as change management, not a reporting tweak. This is buildable in-house: mid-market manufacturers are increasingly in-sourcing their pricing and RGM analytics rather than renting the capability, and the maturity data says the gap between the 1.9% at the top and everyone else is mostly this lever, compounding.
Defending Pricing Power When Costs and Competitors Move
Building power is only half the job. The 2026 environment, with persistent cost inflation and volatile demand, is a stress test of how to defend that power.
Retire the peanut-butter increase. Spreading one percentage across every customer and SKU overprices your elastic pockets (donating share) and underprices your inelastic ones (donating margin). Sequence increases by measured elasticity and value delivered: larger moves where retention is strong, offer redesign where it is fragile. Surgical beats simultaneous.
Hold the give-get line when the cycle turns. When demand softens, requests for exceptions tend to increase. Each request that is approved without a corresponding gain sets a new reference price. Concessions should be exchanged for commitments on volume, extended terms, or product mixes. Additionally, freight and rebate policies should have approval thresholds that can withstand the pressures of quarter-end. This type of governance work may not be glamorous, but it is significantly more valuable than the next analytics tool.
Respond to competitor cuts with math, not reflex. Before matching a price cut, compute the breakeven: at 30% margin, matching a 5% cut requires roughly 20% more volume just to hold profit. Usually, the better answer is targeted: defend the genuinely contested accounts, hold price where switching is costly, and let the competitor buy the unprofitable volume. Matching everywhere is how one aggressive quarter becomes a permanently cheaper category.
Communicate value, not cost, when increasing. Cost-justified increases invite audits of your costs and get clawed back when inputs ease. Value-justified increases, anchored to outcomes delivered and reinforced at renewal, hold. Dolan and Simon push this further with their sunk-cost rule: fixed and sunk costs have no place in setting the optimal price at all, which is why full cost-plus pricing keeps producing prices that are wrong in both directions. The sequencing of the conversation is a pricing power act in itself.
Pricing Power in Practice: What Good Looks Like
A global dental technology group came to us with the classic profile: strong products, real external power, and realized prices that said otherwise. Discount dispersion was wide for similar customers, freight waivers and rebates were ad hoc, and the field had no practical tools or approval rules, so every quote was an improvisation.
The work was execution-side, lever four through seven. A standardized pocket-price waterfall made the leakage visible by region, product family, and rep.
Pocket-price waterfall from list price to pocket price, showing where discounts, rebates, and freight erode realized price
Executive and field dashboards present net revenue and margin drivers to decision-makers on a weekly basis. A discount matrix with clearly defined delegation-of-authority thresholds specifies who is authorized to approve what. Additionally, established freight and rebate policies help eliminate unauthorized adjustments. There will be no significant list price increase, no new product introductions, and no market shifts.
The outcome was a approximately 5% improvement in net price realization during the first year. There was also a significant reduction in discount variability and quicker, more regulated quoting processes that the sales team embraced because these changes alleviated obstacles in closing deals instead of introducing new ones. On the scorecard, the first metric increased by five points, which in turn positively influenced the fifth metric. This is what building pricing power looks like from within: it’s not merely a bold strategy, but rather the result of numerous controlled decisions aligning in the same direction.
FAQ: Pricing Power
What is pricing power?
Pricing power is a company’s ability to raise or hold prices without losing enough volume to hurt profit. It combines external position (differentiation, switching costs, competitive structure) with internal execution (realization, discount governance, contract terms).
How do you measure pricing power?
Five metrics, read together: net price realization on increases, relative price index versus substitutes over time, measured price elasticity by segment, volume retention after past increases, and gross margin durability against input costs. Each is computable from data most companies already hold.
What is an example of pricing power?
Sustaining a price index of 105 or better against close competitors while holding share, or pocketing 70%+ of an announced increase with volume retention above 95%. At the company level, P&G extracting 13 points of price-driven growth over four years is pricing power; needing that engine to go quiet in 2026 shows even strong power has limits that must be re-earned.
What gives a company pricing power?
Verifiable differentiated value, segment-level willingness-to-pay knowledge, offer architecture that creates trade-up and trade-down paths, contracts with escalation rights, and the governance to execute increases without leakage. Brand, switching costs, and supply position help, but execution converts them into realized price.
Is pricing power the same as price elasticity?
No. Elasticity is one measurement input: how demand responds to price at current levels. Pricing power is the full commercial position, including competitive standing and execution discipline. Inelastic demand with weak discount governance still produces weak realized pricing.
How do companies increase pricing power?
Work the seven levers in sequence: prove value quantitatively, deepen willingness-to-pay insight by segment, engineer price-pack architecture, fix contracts and escalation rights, manage mix deliberately, charge for cost-to-serve, and stand up an owned pricing capability with real decision rights. Start where your scorecard shows the largest gap.
Key Takeaways
- Pricing power is measurable: net price realization, relative price index, elasticity, volume retention, and margin durability form a five-metric scorecard you can run quarterly from existing data.
- The profit math is documented: per Revology’s analysis of 2,000 global companies, 1% better price realization lifts operating profit 6–7% (10–11% outside regulated industries).
- The inflation-era free ride is over; P&G’s four-year, 13-point pricing run ending at zero marks the shift from harvesting increases to earning them.
- External power (value, segmentation, architecture) and internal execution (contracts, mix, cost-to-serve, capability) are different problems; most companies lose more to the second.
- Defense is governance: sequenced increases by elasticity, give-get discipline, and breakeven math before matching any competitor cut.
Where to Start
You don’t need a formal transformation program to assess your current position. Simply take the last two price increases, create a waterfall chart, and evaluate five key metrics. Typically, this initial assessment takes weeks rather than quarters, and it often pays for itself with the first exception it identifies. For those interested in a deeper exploration of this approach, I recommend reading Dolan and Simon’s “Power Pricing” and the Meehan team’s work on Pricing and Profitability Management; those are two essential resources to own.
If you want a partner who has run this play across CPG, med-tech, pharma, distribution, and industrial businesses, Revology’s end-to-end pricing and Revenue Growth Management (RGM) advisory stands up the scorecard, the elasticity models, and the governance inside your team over a 30-to-120-day engagement, so the capability and the pricing power it builds stays yours.