


Table of Contents
A Good, Better, Best approach
Most know customer price sensitivity as an important concept, especially for sales and marketing teams. It helps us understand how price changes affect demand, profitability, or market share of our products or services. It is also a helpful signaling tool to determine whether a product or product family behaves like a premium product as brand managers and marketers intended it or a below-premium one as an example.
Quantitatively, companies express customer (either B2B or B2C) price sensitivity with price elasticity, and the modeling of accurate price elasticity coefficients is still one of the most popular data science use cases in sales and marketing (and, of course, revenue management) domains. At its most basic level, price elasticity tells us what percentage of unit sales (the demand for our products or services) will change given a specific percentage change in price points.
In this article, I will describe the most popular analytical methods that help you measure your product or service price elasticities, including a few simple and proven ML-based approaches that your analytics or data science teams can easily do.
Why is it essential for me to know price elasticities?
We can use price elasticities as key inputs for strategy, product, and customer segmentation and clustering, what-if scenario analyses, and optimization exercises. They are essential for quick managerial decision-making around pricing actions.
The estimation of price elasticities will never be 100% accurate. Too many internal and external factors influence customers’ price sensitivities, including personal incomes, product switching costs, competitor prices and competitive density, anchor/reference prices, or your company’s inventory position.
Below are some key reasons why it is foundational for companies to know their product and customer segment-level price elasticities:
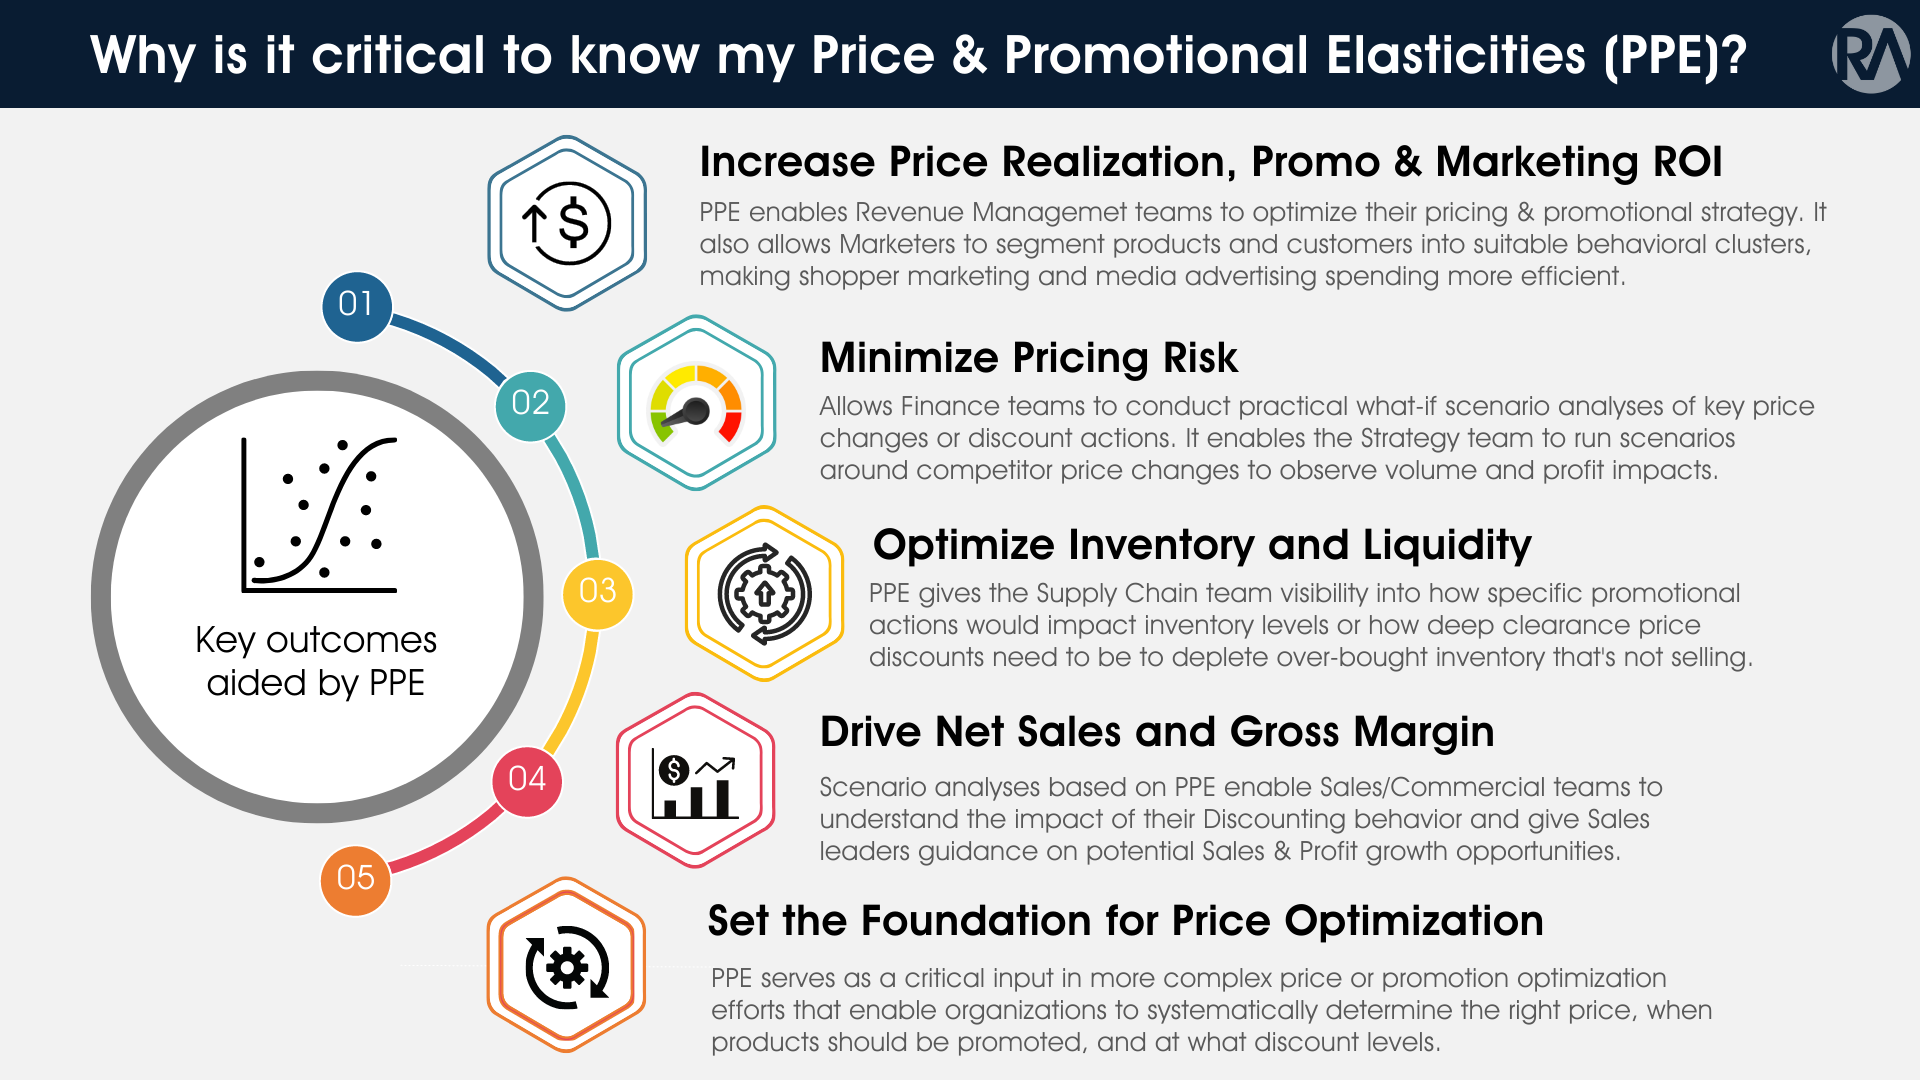
It enables revenue management teams to create more impactful pricing and promotional strategies.
It allows marketers to segment products and consumers into suitable behavioral clusters.
Allows finance teams to conduct more sophisticated what-if analyses of specific price changes or discount actions.
It lets sales operations or management know to what extent they can discount and still make more profit.
Cross-price elasticities, including competitive price elasticities, let the strategy team know how business is impacted if other products in the overall portfolio change prices or if a substitute or complementary products from the competition change prices.
It gives the supply chain team visibility into how inventory levels would be impacted by specific promotional actions or how deep clearance pricing discounts need to be to deplete over-bought inventory that’s been gathering dust on warehouse shelves.
It serves as a critical input in more complex price or trade promotional optimization efforts that enables organizations to systematically determine the right price for each product and when and how those products should be discounted to maximize a particular financial objective. That objective is typically gross profit, although I’ve seen companies wanting to maximize market share, sales dollars, and even unit sales (which I strongly recommend against unless there is a solid strategic reason for it).
So how do I estimate price elasticities?
Modeling price elasticities can be a straightforward or complex exercise, depending on several elements, including the level of predictive accuracy you are seeking and what you intend to do with the price elasticity information.
Directional estimates with more straightforward analytical methods will suffice if you want to cluster products or customers based on pricing behavior that you’ll confirm later with in-market tests.
However, if you need to decide how much promotional funding you will give to your entire distribution or retail channel, being as accurate as possible is essential.
ML-based approaches work well if you want to understand price elasticities for well-established products with at least 2-3 years of sales history, including competitive pricing trends. Most ML-based approaches rely on creating predictive models for unit sales, with price (and competitor prices) being one of many variables. For traditional regression models, please pay attention to the multi-collinearity of predictors (I.e., price highly correlated with promotional periods or display advertising) and be sure to control for them. You can do this through feature engineering, sometimes through regularization, although my favorite is to use tree-based ensemble models that are naturally good at handling highly correlated predictors.
Survey-based approaches are used for new product pricing or during product or brand repositioning exercises. In-market price tests can be done with new and existing products and provide the most reliable results overall.
The three general approaches to estimating price elasticities that I’ve found helpful in the past:
Regression/machine learning models: linear regressions using a mid-point method, log-log regressions, or ensemble models (e.g., random forest or gradient boosting). The mid-point method is a simple mathematical formula based on the price coefficient of a multi-linear regression model and the ratio of average prices and units in the modeling period (typically two years of weekly data). The log-log regression is still the most popular method for estimating price elasticities in most traditional industries, with the log of units regressed on the log of price and other variables – the price coefficient, in this case, is roughly the price elasticity. More robust models like ensemble models (or deep learning, if your data and use case justifies it) typically work better, given their natural ability to handle multi-collinearity and relative predictive power.
Customer survey-based methods: Van Westendorp, Gabor Granger, and Conjoint Analyses. These three survey methods have different intents, with Van Westendorp typically (albeit contentiously) used to estimate acceptable price ranges for new products and Gabor Granger to estimate consumer willingness to pay and optimal price points. Conjoint analysis is a more comprehensive research approach that lets us understand consumer preferences to optimize product features, including pricing. Regardless of the intent, all three methods can calculate price elasticities at varying degrees of accuracy and relevance.
In-market price tests: A/B price tests are done either through traditional channels (I.e., brick & mortar retail, distribution, etc.) or through digital delivery. Digital micro-testing is preferable as the number of testing permutations can be significantly more significant and the cost of mistakes lower (generally).
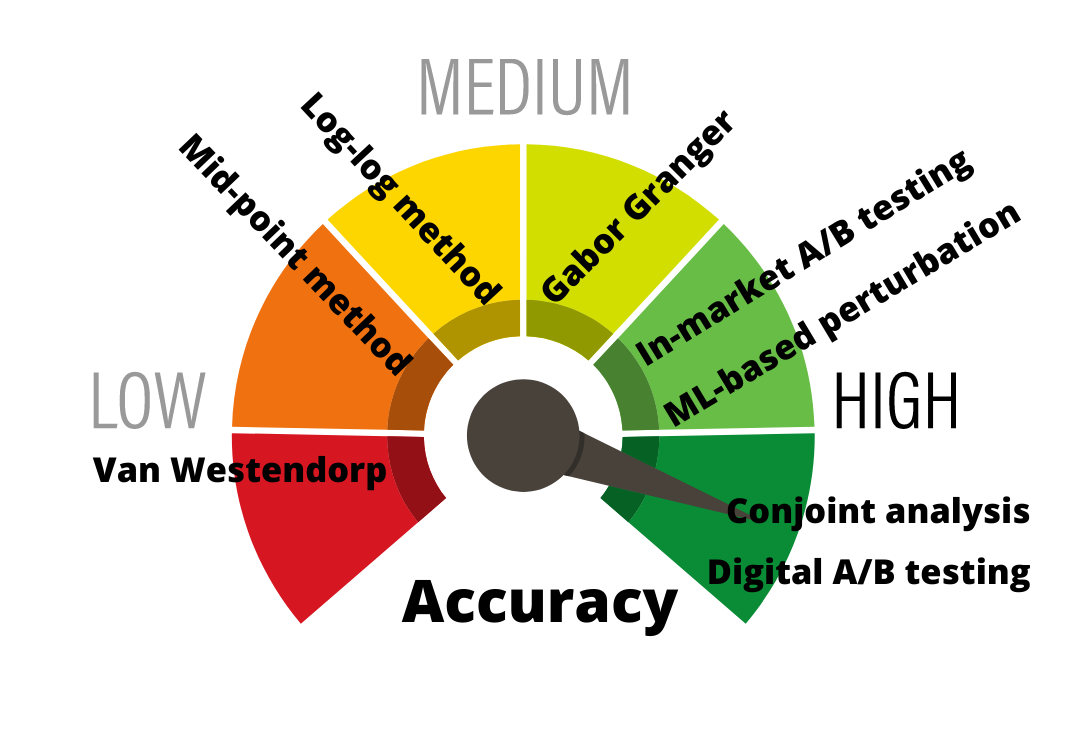
The below depicts the various analytical methods for estimating price elasticities based on their predictive accuracy relative to reality – at least based on my experience.
What are the best modeling approaches to estimate Price Elasticity in my industry?
Learn how customers react to price changes
Our free 50-page guide, Mastering Price Elasticity Modeling, shows step by step how to measure the way your customers respond when prices go up or down.
Grocery / Mass Merch Retail and Consumer Products
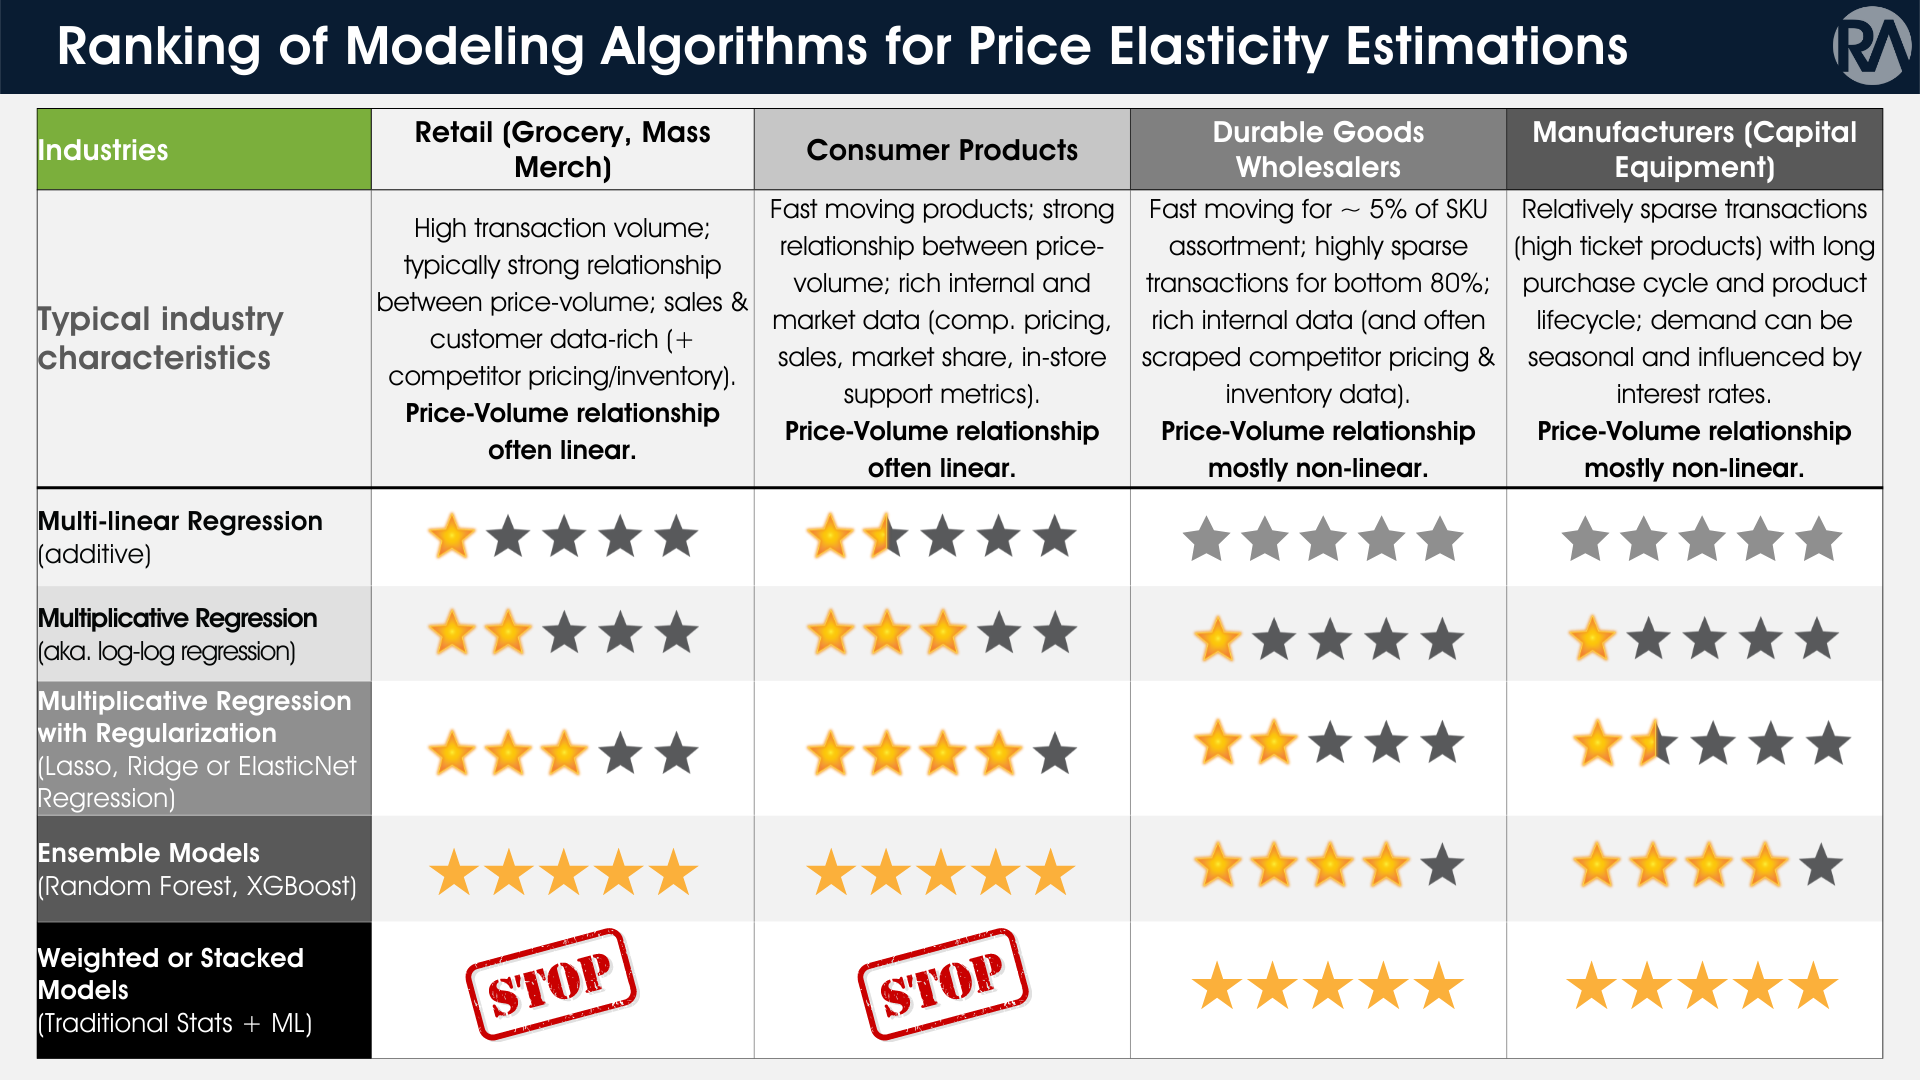
Log-log regressions are a good baseline for P/E estimations since there’s often a linear relationship between Prices and Volume (at least for the top ~ 25-50% of assortment products). But, given the high collinearity of several predictors (think Price & Competitor Prices; Seasonality & Promotional Events), I recommend you at least apply some Regularization.
Ensemble Models allow you to quickly estimate Elasticities across various Price Ranges and Customer Segments – since we know that P/E slopes often vary. You can do it with Linear models, but they’re usually highly inaccurate (too many dummy variables, and you’ll run into issues).
The choice of Ensemble Models is yours and depends on several factors, including sparsity of data, the amount of training data available, and how much time you have on your hands.
XGBoost can yield highly accurate demand predictions at the risk of overfitting and taking too long.
Random Forest is always a safe choice if you want a Demand Model that’s often substantially more accurate than Linear models and can parallelize the calculations for fast results.
Durable Goods Wholesale and Capital Equipment Manufacturing
In contrast with Retail or CPG, the Durable Goods Wholesale and Capital Equipment Manufacturing industry has products with much higher prices and often with long purchase cycles. Since end customers finance most capital equipment, they tend to be less price elastic and demand primarily non-linear.
Combining multiple algorithms to form a super-model almost always produces the most accurate Price Elasticities, but it is overkill for industries like Grocery Retail or CPG.
When in doubt, use price perturbations
While this may alienate statisticians, my recommendation is to use foundational ML-based approaches when in doubt about what predictors to use, are concerned about collinearity, and want to have more accurate price elasticities than what traditional regression approaches can produce.
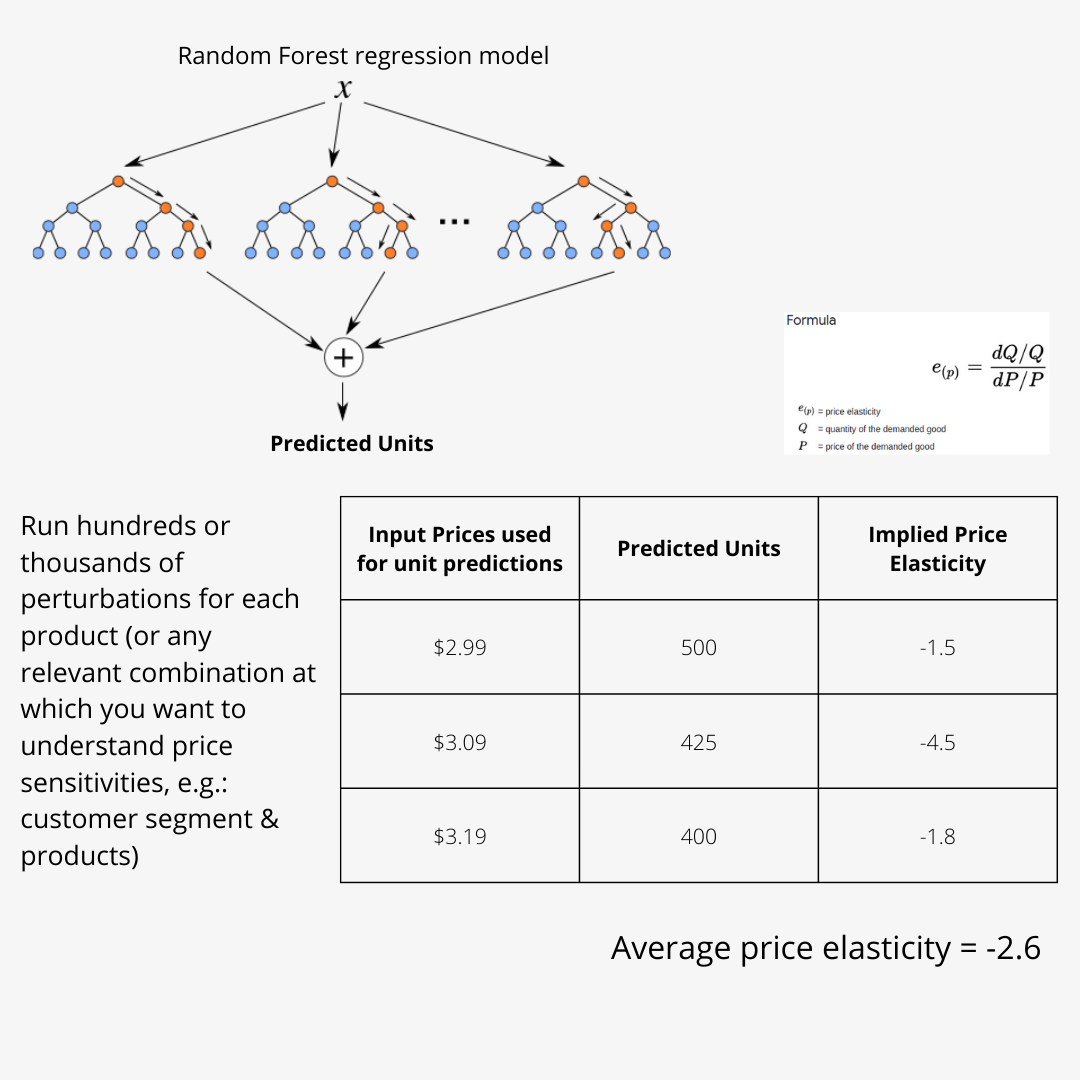
A simple but well-proven process is to build a highly predictive demand model for unit sales. Then we run hundreds or thousands of predictions using smaller, sequential iterations of price points (aka. perturbations) or a large matrix in combination with other relevant predictors like competitive prices (while holding all other predictors constant).
This method will enable you to generate price elasticities at various price points and ranges, which will be critical to your scenario analyses. The reality is that your products may be more or less price sensitive, depending on the price ranges you operate in. Price elasticity will likely differ between changing prices from $4 to $6 vs. $2 to 4. It would help if you accounted for that in your pricing scenario analyses.
More accurate price elasticities could mean breaking even on a multi-million-dollar promotional campaign or losing substantial $$$ due to wrong promotional price elasticity estimates.
Below is a simple example of using price perturbations to measure price elasticities using a random forest regression.
Advice for practitioners
Regardless of the analytical method you choose, I advise using price elasticities (including cross-elasticities and competitive price elasticities) with sound judgment and updating your models as often as it makes sense. Market dynamics and the competitive landscape can change quickly depending on your industry. If you use ML-based customer survey approaches, confirm those price elasticity estimates with well-designed in-market tests to understand price changes’ real, empirical impacts. Whenever possible, use online price testing to maximize business impact – be sure to design price experiments carefully so as not to alienate consumers or drive adverse price perception.
Once you’ve mastered the art of modeling price elasticities for your company, you can take the next steps to estimate competitive price elasticities, the impact of promotions by promotion type, clearance pricing impacts, or cross-portfolio price elasticities. These will be essential to your ultimate goal of implementing an effective pricing and promotional optimization capability that will differentiate your company in the industry.
Frequently asked questions about price elasticities
What is price elasticity?
Price elasticity is the quantitative measure of customer price sensitivity. At its most basic level, it tells you what percentage change in unit sales to expect from a given percentage change in price. It shows how price moves affect demand, profitability, and market share, and it signals whether a product behaves like the premium product its brand managers intended.
How are price elasticities used in a business?
Revenue management teams use them to build pricing and promotional strategies, and marketers use them to group products and consumers into behavioral clusters. Finance runs what-if analyses on price changes, sales operations learns how far it can discount and still make more profit, and supply chain sees how promotions and clearance discounts will move inventory. They are also a critical input to price and trade promotion optimization.
What methods can you use to estimate price elasticity?
There are three general approaches. Regression and machine learning models include linear regression with the mid-point method, log-log regression, and ensemble models such as random forest or gradient boosting. Survey methods include Van Westendorp, Gabor Granger, and conjoint analysis, and they suit new product pricing and repositioning. In-market A/B price tests work for new and existing products and give the most reliable results overall.
Which price elasticity model works best for retail and consumer products?
Log-log regression is a good baseline in grocery, mass merchandise, and consumer products, because price and volume are often linearly related for the top 25% to 50% of the assortment. Apply regularization, since price, competitor prices, seasonality, and promotions are highly correlated. Ensemble models estimate elasticities across price ranges and customer segments: XGBoost can be very accurate but risks overfitting and long run times, while random forest is a safe, fast choice.
How do price perturbations measure price elasticity?
First build a highly predictive demand model for unit sales. Then run hundreds or thousands of predictions while changing price in small sequential steps, or across a large matrix with predictors such as competitor prices, holding everything else constant. The result is a set of elasticities at different price points and ranges, which matters because a move from $4 to $6 can behave differently from a move from $2 to $4.
What are common mistakes when estimating price elasticities?
Ignoring multicollinearity is the classic one: price often moves with promotional periods or display advertising, so control for it with feature engineering, regularization, or tree-based ensemble models. Other mistakes are treating estimates as exact, when incomes, switching costs, competitor prices, and inventory position all shift price sensitivity, and leaving models unrefreshed while markets change. Confirm model and survey estimates with well-designed in-market tests.
Do capital equipment makers need different elasticity models?
Yes. Durable goods wholesale and capital equipment carry much higher prices and long purchase cycles, and because end customers finance most capital equipment, demand tends to be less price elastic and mostly non-linear. Combining multiple algorithms into a single super-model almost always produces the most accurate elasticities in these industries, although that approach is overkill for grocery retail or consumer packaged goods.
Related Reading
- Is too much discounting preventing you from meeting profitability targets?
- Pricing Strategies to Counter Tariff Impacts
For broader industry perspective on pricing analytics and revenue growth management, see McKinsey’s Growth, Marketing & Sales insights.
Want a second opinion on your pricing?
Tell us what’s going on with your pricing. One of our partners will get back to you the same day or the next.






