

Overview: Promotion effectiveness in Practice
This article from Revology Analytics explains promotion effectiveness in the context of modern pricing analytics and revenue growth management. It draws on real engagements with mid-market and enterprise clients to turn promotion effectiveness from a buzzword into a measurable commercial capability. Read on for the full perspective, and see our related reading for additional depth.
Table of Contents
Five steps to build in-house, best-in-class Promotion Optimization capabilities to drive your Operating Profit.
If you are a ~$1B Manufacturer or Distributor that spends ~ 15% of its Gross Revenues on Promotions & Rebates, every 50bps improvement in your Promo ROIs will drive +$0.75MM to your EBITDA. Let me describe the steps to take to enable these capabilities for your organization.
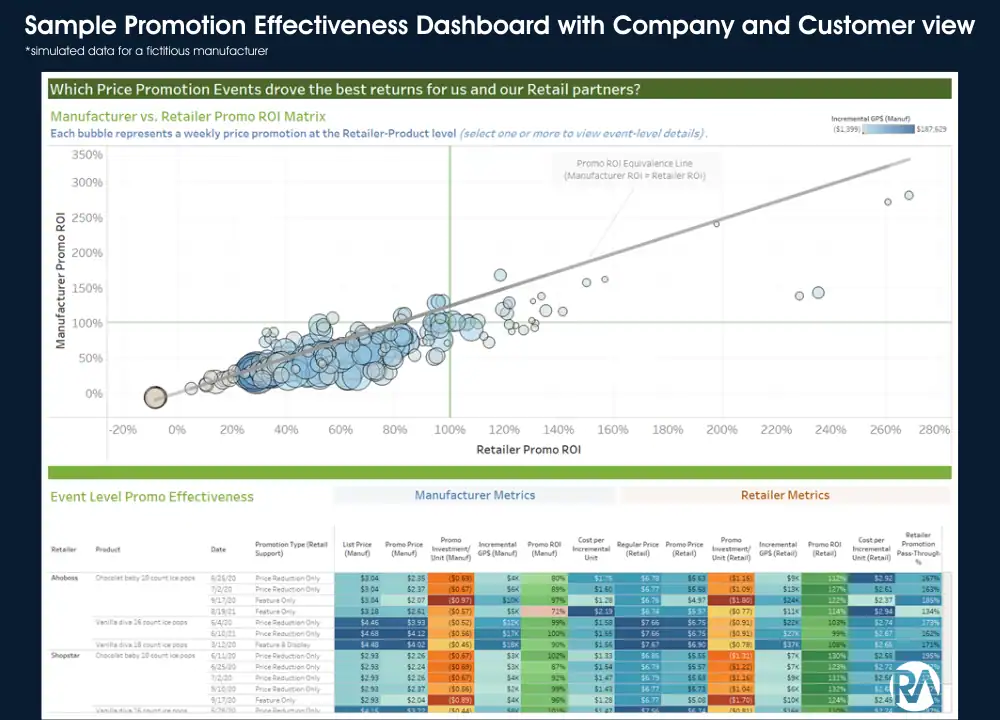
If I asked you how much Incremental Gross Profit $ you’re getting for each $1 invested in Price Promotions, you probably wouldn’t know the answer.
Outside of mid-to large-scale Consumer Products companies, most Manufacturers (Consumer Durables, Medical Devices, Auto Parts, etc.) don’t have robust (or any) Promotion Effectiveness & Optimization solutions in place.
Most CFOs, Heads of Sales, and Pricing Leaders of companies that spend 10%+ of their Gross Revenues on Price Promotions can’t quantify the ROI of their Promotional Investments. Their teams are relegated to looking at basic sales and pricing reports to judge historical effectiveness and plan for the next period’s promotional calendar.
A common misconception among executives is that building Promotion Effectiveness & Optimization capabilities is an expensive investment with 6-12 month development times, only to see it fail ~ 60-80% of the time due to implementation flaws or lack of adoption.
Indeed, most turnkey solutions are expensive, difficult to use, lack customization, and are often ineffective.
Fortunately, most manufacturers have the proper data assets to build actionable Promotion Effectiveness & Optimization solutions in-house, using methods and technologies they are already familiar with.
Here are the 5 steps to build an in-house Pricing & Promotion Analytics solution in 90-120 days to deliver high-value realization. How? Because you will develop it collaboratively with a Core Team of IT, Finance, Marketing, Merchandising, and Sales leaders, along with a select group of Power Users brought along the journey at each step.
Step 1: Identify the Promo Effectiveness Metrics and Scenario Analytics capabilities you want to build.

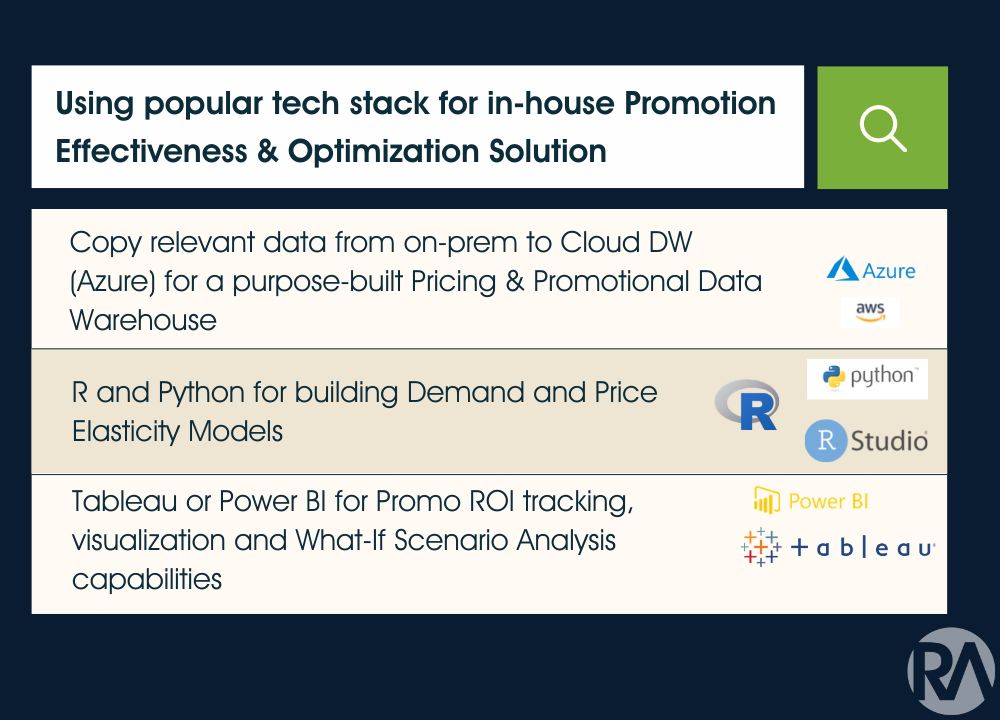
Step 2: Collaborate with business and IT to deploy a purpose-built Pricing & Promotional Data Warehouse (e.g., Azure, GCP, AWS) by bringing in Promotional Spend & Offer Details, Internal Sales Transactions, Distributor Sellout, Market / Competitive Data and Advertising data.

Step 3: Build Unit Demand Models that enable you to quantify Price Elasticities (used for scenario analyses) and delineate Base vs. Incremental Unit sales. Here, I recommend you move beyond Linear Regression and try a more accurate ML approach.

Step 4: Aggregate and harmonize your internal, external, and modeled data (base, incremental, price & promo elasticity coefficients) into a purpose-built Promotion Analytics data set.

Step 5: Connect a popular self-serve BI tool (e.g., Tableau, Power BI) for a highly customized, dynamic, and visual Pricing & Promotion Analytics platform with what-if scenario analysis capabilities.

Frequently asked questions about promotion effectiveness
Why does promotional ROI matter for manufacturers?
For a manufacturer or distributor with about $1B in revenue that spends about 15% of gross revenue on promotions and rebates, every 50 basis point improvement in promotional ROI adds about $0.75MM to EBITDA. Yet most CFOs, heads of sales, and pricing leaders at companies that spend 10% or more of gross revenue on price promotions cannot quantify the return on those investments.
Which companies lack promotion effectiveness solutions?
Outside mid- to large-scale consumer products companies, most manufacturers, in consumer durables, medical devices, auto parts, and similar industries, have few or no robust promotion effectiveness and optimization solutions. Their teams judge past promotions and plan the next promotional calendar from basic sales and pricing reports.
Is building promotion optimization expensive and slow?
That is a common misconception. Executives often expect a costly project with 6 to 12 months of development that fails 60% to 80% of the time because of implementation flaws or poor adoption, and most turnkey solutions are indeed expensive, hard to use, and inflexible. Most manufacturers, however, already have the data to build an effective solution in-house in 90 to 120 days with familiar technology.
What are the steps to build promotion optimization in-house?
Five steps. Define the promotion effectiveness metrics and scenario capabilities you need. Deploy a purpose-built pricing and promotion data warehouse with promotional spend, sales transactions, distributor sellout, market, and advertising data. Build unit demand models. Harmonize internal, external, and modeled data into one promotion analytics data set, then connect a self-serve BI tool such as Tableau or Power BI.
Who should help build a promotion analytics solution?
Build it collaboratively with a core team of IT, finance, marketing, merchandising, and sales leaders, and bring a select group of power users along at each step. That collaboration is what allows an in-house pricing and promotion analytics solution to deliver high value realization.
What should promotion demand models estimate?
Unit demand models should quantify price elasticities, which feed the scenario analyses, and separate base unit sales from incremental unit sales. Move beyond linear regression and try a more accurate machine learning approach. The resulting base, incremental, and price and promotion elasticity coefficients become part of the harmonized promotion analytics data set.
Related Reading
- Supercharge Your Revenue Growth Strategy with Knowledge Graphs
- RA Quick Insights: Optimizing Product Gross Profits with Price-Value Maps – Part 1
For broader industry perspective on pricing analytics and revenue growth management, see McKinsey’s Growth, Marketing & Sales insights.






