This guide outlines six methods for estimating willingness to pay and the governance needed to translate these estimates into effective pricing decisions.
Table of Contents
Many companies set prices without fully understanding what customers are willing to pay. They often add a margin to cost or reference competitors, overlooking the critical factor: customer willingness to pay. Willingness to pay (WTP) is the maximum price a segment will accept before declining to purchase. Accurately measuring WTP is essential to capturing value.
The impact is significant. A 1% improvement in price realization increases operating profit by 6-7% for the median company, according to Revology Analytics’ Pricing Still Packs a Punch study (June 2025) of 2,000 firms. Measuring willingness to pay is essential to achieving this improvement. This guide explains the two main families of WTP measurement, details six estimation methods, provides a worked example, and outlines the governance required to turn estimates into actionable prices.
Key Insight: A 1% improvement in price realization lifts operating profit 6-7% for the median firm, and 10-11% in less-regulated industries (Revology Analytics, Pricing Still Packs a Punch, June 2025, n=2,000). Willingness to pay is how you locate that 1%.
What is willingness to pay?
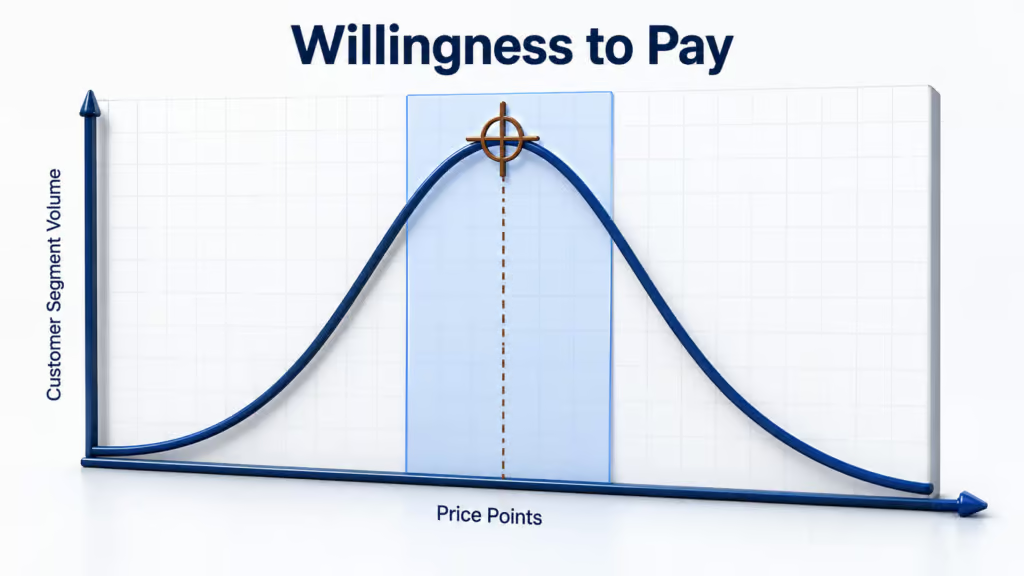
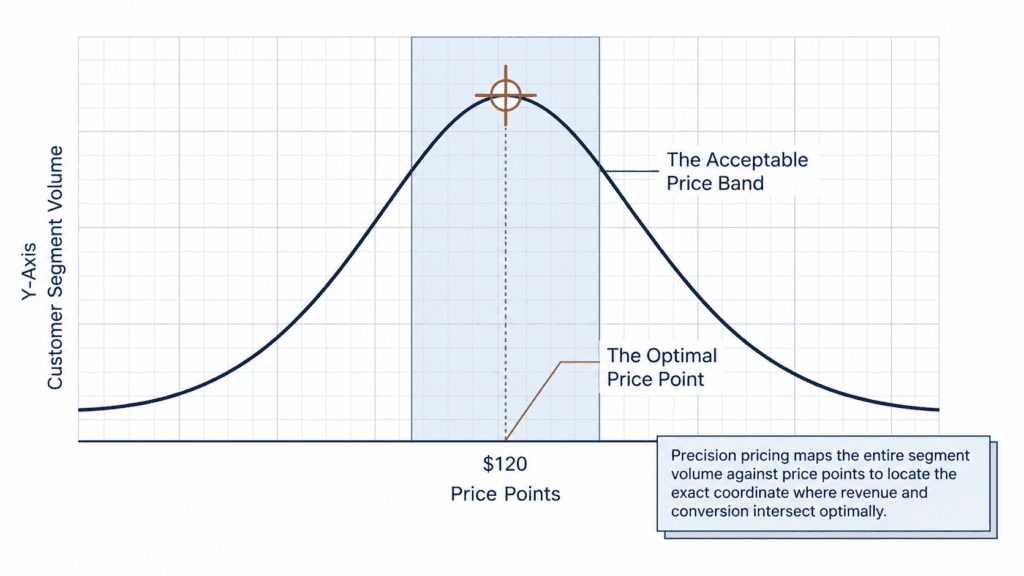
Willingness to pay is the highest price a customer or segment is willing to pay for an offer before declining to buy. It is a distribution across customers, not a single number, and it shifts with context, available alternatives, and perceived value. Economists call the individual ceiling the reservation price.
WTP is valuable for two reasons. First, it is a distribution: some buyers may value your offer at $80, others at $150, so relying on an average can obscure segments where you underprice. Second, WTP is relative: it rises when substitutes are weak and falls when lower-priced alternatives are available.
WTP is also linked to consumer surplus. For example, if a buyer values a tool at $120 but pays $90, their WTP is $120, and the $30 difference is surplus not captured by the seller. Value-based pricing begins with this understanding, as such prices are anchored to WTP rather than cost.
Why willingness to pay beats cost-plus and gut-feel pricing
Cost-plus and gut-feel pricing undermine effective pricing discipline. Cost-plus adds a margin to unit cost, resulting in a price that reflects internal costs rather than customer value. Gut-feel pricing relies on instinct instead of evidence. Both approaches may seem safe but often result in lost margin. The following factors contribute to this margin leakage:
•No value signal. Cost-plus provides no information about what the customer would pay; anchoring the price to cost is guesswork dressed as arithmetic.
•One number for a whole market. A single list price ignores the fact that willingness to pay is a distribution, so you overprice sensitive segments and underprice those that would pay more.
•Instinct drifts. Gut-feel estimates carry the biases of the estimator: last year’s anchor, fear of losing a deal, a loud sales rep. None represents the segment.
•Estimates go stale. A good WTP read decays as competitors launch and perceptions move.
•No decision owner. Without someone accountable for the price, WTP evidence has nowhere to land.
Because price directly impacts the bottom line, small gains in realization can lead to significant profit increases. WTP-based pricing captures this potential, while cost-plus pricing often leaves value unrealized.
WTP-based pricing maintains cost discipline. Cost establishes the floor, willingness to pay sets the ceiling, and pricing within this corridor determines profitability.
Stated vs. revealed preference: the two families of WTP measurement.
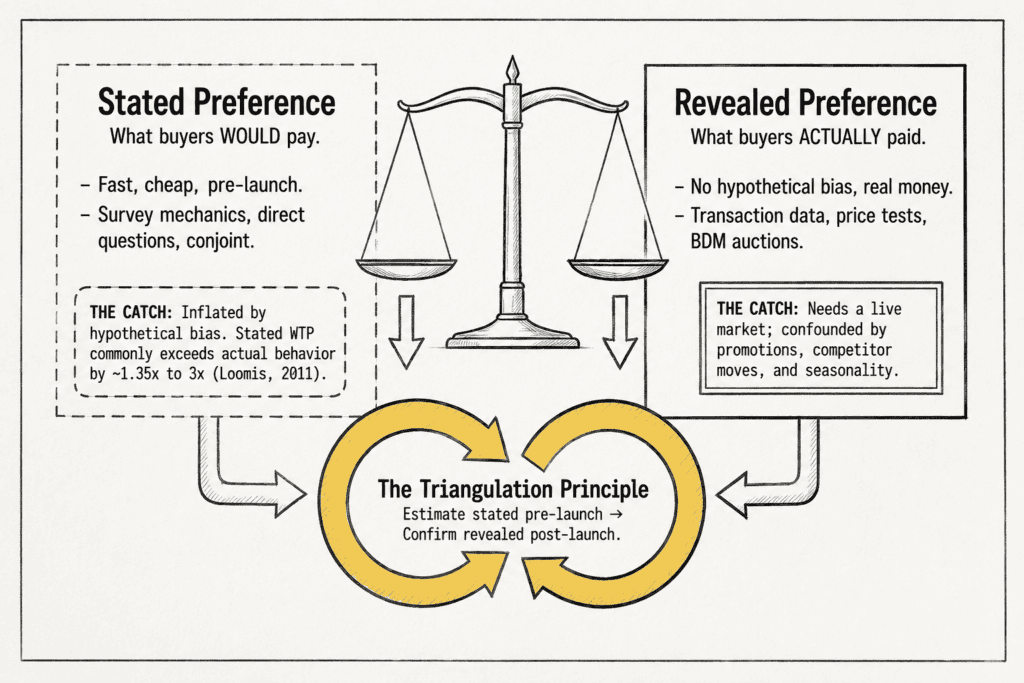
Every WTP method belongs to one of two families. Stated-preference methods (surveys, conjoint, direct pricing questions) ask people what they would pay: fast, cheap, and available before launch, but weakened by hypothetical bias, the tendency to overstate spending when no real money is at stake. Hypothetical WTP commonly exceeds actual WTP by roughly 1.35 to three times (Loomis, *Journal of Economic Surveys*, 2011).
Revealed-preference methods (transaction records, price tests, incentive-compatible experiments) observe what customers actually paid and carry no hypothetical bias. Their weakness is availability: you need a live market or a controlled experiment, neither of which exists before you ship, and the data tangles WTP with promotions, seasonality, and competitor moves.
| Family | What it answers | Data needed | Main bias |
|——–|—————-|————-|———–|
| Stated preference | What customers say they would pay | Survey respondents; a described offer | Hypothetical bias (overstatement) |
| Revealed preference | What customers actually paid | Transactions, price tests, experiments | Confounds; needs a live market |
The practical answer is triangulation: estimate WTP using a stated-preference method before launch, then confirm it with revealed-preference data once transactions occur. No single method is trustworthy on its own, and much of the measurement error stems from ignoring the alternatives a buyer actually weighs, as Kellogg Insight documents.
6 proven methods to measure willingness to pay
Six methods dominate serious WTP work: three stated-preference surveys, one that derives WTP from feature trade-offs, one that reads it from real transactions, and one controlled experiment with real money. Choosing the right willingness-to-pay method means matching the technique to your data, budget, and tolerance for bias.
Van Westendorp Price Sensitivity Meter
The Van Westendorp Price Sensitivity Meter (PSM), developed by Peter van Westendorp in 1976, maps acceptable price ranges by asking four open-ended questions: at what price is the product too expensive, expensive but still worth it, a bargain, and so cheap you’d doubt its quality. Plotting the cumulative curves yields reference points, including a point of marginal cheapness, a point of marginal expensiveness, and an indifference price (SurveyMonkey PSM guide).
•When to use it: Early-stage pricing for a new or repositioned product; its strength is a defensible range fast and cheaply, without anchor prices that bias responses.
•Watch out: It measures price perception, not purchase intent. The “optimal” point is a perception artifact, not a revenue-maximizing price.
Gabor-Granger direct pricing
The Gabor-Granger method estimates a demand curve by testing purchase intent at discrete price points. It shows a price, asks whether the respondent would buy, then raises or lowers the next price until it reaches the respondent’s highest acceptable price. Aggregated, the “would you buy?” responses trace a demand curve and reveal the revenue- or margin-maximizing price (Sawtooth Software).
•When to use it: When you have a defensible range and need the specific revenue- or margin-optimal point; its strength is a direct demand curve and price elasticity of demand estimate with modest samples.
•Watch out: It tests prices in isolation, so it tends to overstate acceptance for offers that face strong substitutes.
Choice-based conjoint (CBC)
Choice-based conjoint shows respondents realistic product profiles, combining features, brand, service level, and price, and asks which they would buy. A statistical model (multinomial logit, hierarchical Bayes) then recovers the part-worth utility of each attribute plus a price coefficient. Willingness to pay for a feature equals its part-worth utility divided by the negative of the price coefficient (Sawtooth Software conjoint reference).
•When to use it: When you are pricing a portfolio, bundle, or feature-differentiated line; its strength is capturing trade-offs the way real purchases do, yielding WTP for individual features rather than the whole product.
•Watch out: It is the most complex and costly method to design, and poor attribute design quietly corrupts every downstream number.
Direct and open-ended surveys
The simplest stated-preference approach asks buyers directly what they would pay, open-ended or against a scale. It is the cheapest, fastest signal you can collect, and the most abused method in pricing. Direct questions maximize hypothetical bias: respondents face no consequence for an inflated answer and often anchor on whatever number the survey implies.
•When to use it: Exploratory sizing, or as one triangulation input among several. Never as the sole basis for a price.
•Watch out: It carries the highest hypothetical bias of any method; treat the raw number as an upper bound, not a price.
Transaction and market data (revealed preference)
Transaction data reads willingness to pay from what customers actually paid: invoices, win/loss records, discount-approval logs, and price-test results reveal the prices at which real buyers said yes and no. Its strength: because the money was real, there is no hypothetical bias, the central advantage of revealed preference over every stated method.
•When to use it: Any time a live market exists; essential for confirming or correcting a pre-launch stated estimate.
•Watch out: Promotions, seasonality, and competitor moves are baked into the price, so isolating true WTP requires controls and clean price sensitivity analysis.
Incentive-compatible experiments (BDM auctions)
The Becker-DeGroot-Marschak (BDM) mechanism forces honesty with real money. A participant submits a bid, and then a random price is drawn; if the bid meets or exceeds that price, the participant buys at the random price. Because the bid cannot change the price paid, stating the true WTP is the dominant strategy, which is why the BDM method is called incentive-compatible (BDM method, Wikipedia).
•When to use it: High-stakes decisions where hypothetical bias is unacceptable; its strength is approximating true WTP with real financial consequences, the closest a controlled setting gets to revealed preference.
•Watch out: Results are sensitive to the random price distribution, and the setup is demanding, so it does not scale to routine pricing.
Understanding the methods is straightforward. Applying at least two methods to real decisions is where effective pricing discipline is demonstrated.
A worked example: estimating willingness to pay for a new B2B SKU
These methods are valuable only when applied to real decisions. The following example demonstrates how to estimate willingness to pay for a new industrial product with no price history.
Scenario setup
A manufacturer is launching a mid-tier diagnostic module for existing accounts. Unit cost is $60, and sales wants to price it “around $90 like the last one.” Because the product is new, no revealed-preference read exists yet, so the team runs a stated-preference estimate and plans a revealed-preference correction after launch.
The estimation steps
- Define the segment and the offer. Scope the study to mid-tier industrial accounts and write one precise product description, because willingness to pay shifts with context.
- Run a Van Westendorp PSM. Field the four price-perception questions to 220 buyers; the curves return an acceptable range of $78-$104 and an indifference price near $92.
- Layer a Gabor-Granger ladder. Test purchase intent from $80 to $120; acceptance holds near 68% at $100 and drops above $110, placing the margin-optimal point around $102.
- Discount for hypothetical bias. Both methods are stated-preference, so a conservative correction brings the working ceiling to roughly $96-$98.
- Set a launch price and a corridor. Price at $95 with a floor of $88 and a ceiling of $100, inside the bias-adjusted band and above the $60 cost floor.
- Confirm with transaction data. After 90 days, review win rates and realized prices by segment; if deals close at $95 with low discount pressure, test moving toward $98.
The decision and its impact
The team launches at $95 instead of the initial $90 estimate. Sales receives the full price corridor and the rationale behind it, as a lack of trust in the estimate often leads to unnecessary discounting. Building trust in the estimate is a governance issue.
Practitioner Note: Van Westendorp plus Gabor-Granger, triangulated and bias-adjusted, turned a $90 gut-feel guess into a defensible $95 launch price. For 12,000 first-year units, the extra $5 per unit represents $60,000 in profit that the old process would have missed.
From estimate to priced decision: the governance layer
A willingness-to-pay estimate is evidence, not a final price. The key differentiator between companies that capture value and those that do not is governance that translates evidence into an owned decision. A governance-first approach to WTP relies on four elements:
•A named decision owner. One accountable role sets the price using the WTP evidence. Diffuse ownership means the estimate loses every argument to the loudest voice in the room.
•A confidence threshold. Define how strong the evidence must be before it moves a price. A single survey number is not enough; two triangulated methods might be.
•A price corridor, not a point. Publish a floor and ceiling per segment. The corridor operationalizes the WTP distribution and gives sales-governed room to negotiate.
•A review cadence. Re-read WTP on a schedule, quarterly for volatile categories and annually for stable ones. Staleness is a silent margin leak.
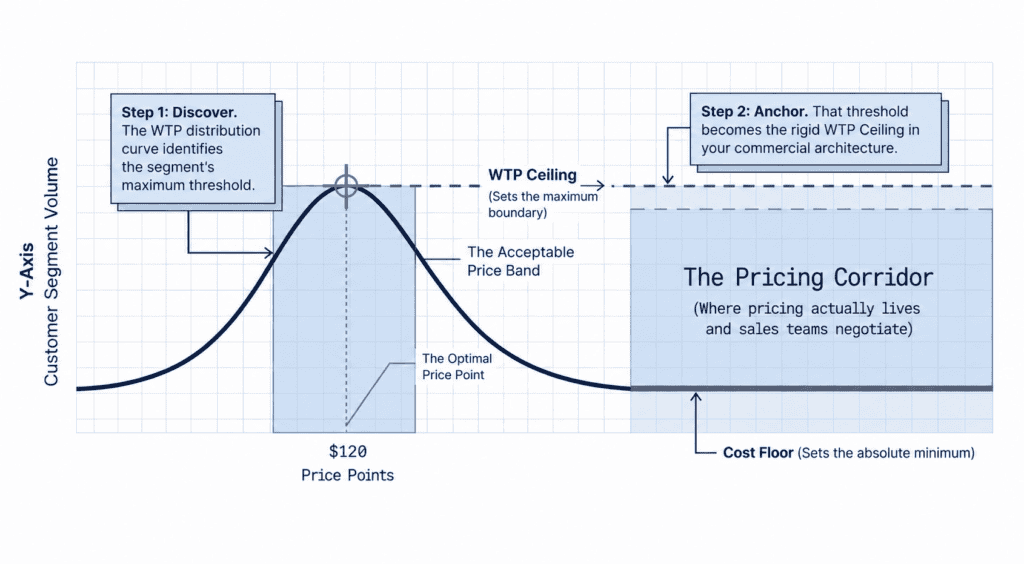
Technology supports each element but is scaffolding, not strategy. A conjoint platform computes part-worths; it does not decide your confidence threshold. A pricing engine enforces a corridor; it does not decide where the corridor sits. Those are governance judgments. This is the discipline behind mature Revenue Growth Management (RGM): decision authority and measurement precede tool deployment.
Common mistakes when measuring willingness to pay
Even well-resourced teams produce willingness-to-pay estimates that mislead. The failures are predictable, so they are detectable if you know the symptoms. Here is how to spot each one before it corrupts a pricing decision.
• Hypothetical bias, ignored. A stated-preference number used as a price with no downward adjustment. Detect it by comparing the estimate against the first real win/loss data.
• One number for the whole market. A single WTP figure for a diverse base. Detect it by splitting the dataset by segment; meaningful variance means one number is wrong.
• Unrepresentative samples. WTP from whoever answered the survey rather than the buyers who matter. Detect it by profiling respondents against your actual buyer mix.
• Segment blindness. Treating price sensitivity as uniform when price elasticity varies. Detect it by estimating elasticity per segment.
• Stale estimates. A price anchored to a study nobody has refreshed since a competitor launched. Detect it by checking your last read against the last material market change.
Tradeoffs, objections, and when each method fits
The main trade-offs are between cost and rigor, and between speed and data availability. Van Westendorp and direct surveys are fast and inexpensive but have higher bias; conjoint and BDM are rigorous but costly; transaction data is most credible but only available post-launch. The best approach is to use at least two methods in combination.
A common objection is, “Our market is too complex to measure WTP.” In reality, complexity increases the need for measurement. More segments and substitutes make gut-feel pricing less effective. Complexity influences method selection, not whether to measure.
CPG and beverage
A beverage brand pricing a new premium line has short purchase cycles, many buyers, and rich scanner data, so revealed-preference transaction analysis and in-market price tests dominate. A quick Van Westendorp study can set the initial shelf-price range, but scanner data and elasticity curves quickly become the authority. This is where disciplined value-based pricing strategies and examples pay off.
Industrial distribution
An industrial distributor with many SKUs and account-specific pricing relies on complex revealed data. Willingness to pay is found in win/loss records, discount-approval logs, and quote-to-order conversions by segment. Analyze transaction history to establish segment-level WTP corridors and manage them closely.
Medtech and pharma
A medtech firm launching a novel device faces long sales cycles, few buyers, high stakes, and significant regulatory price constraints. Rigorous stated-preference methods are essential, such as choice-based conjoint to value clinical and economic attributes, sometimes supplemented by a small incentive-compatible test. Given the high value of each decision and limited pre-launch data, rigorous methods are justified.
Across all three cases, the method varies, but the discipline remains: triangulate, adjust for bias, and govern the outcome.
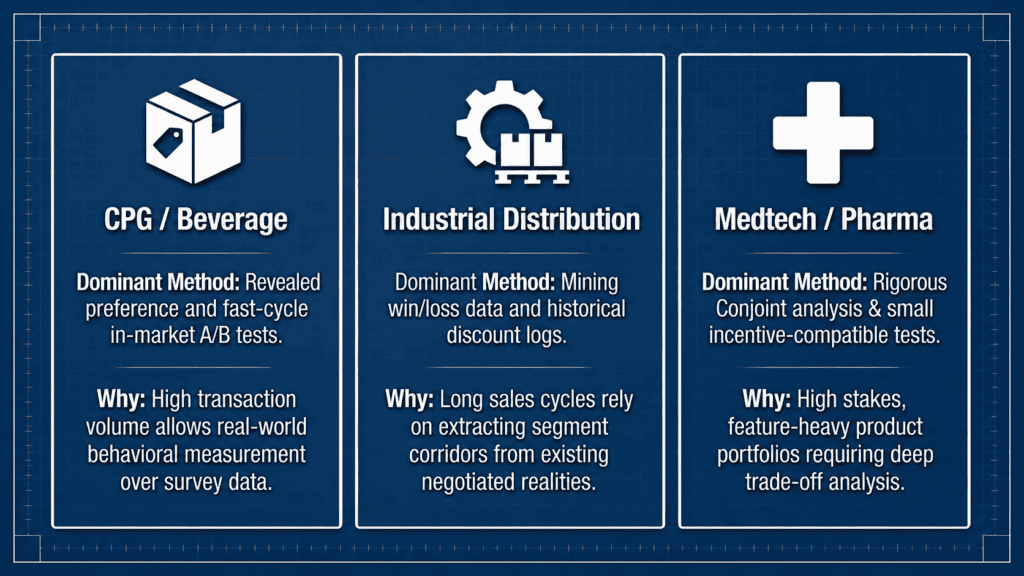
Industry context, rather than personal preference, determines the appropriate method. Data-rich markets favor revealed-preference approaches, while launches with limited data require rigorous stated-preference methods.
Field evidence shows the payoff is tangible. A fast-growing beverage manufacturer that aligned net price realization with segment willingness to pay, rather than discounting reflexively, increased realization by about 0.5% (approximately $3M) and improved trade-spend efficiency by $2M. A global technology division that replaced cost-plus with elasticity-based pricing added one to two points of EBITDA margin. A mid-market plant-based CPG brand maintained prices closer to willingness to pay using elasticity-informed guardrails, saving about $1.4M. Different methods, one discipline: measure willingness to pay and apply it.
Frequently asked questions about willingness to pay
What is the meaning of willingness to pay?
Willingness to pay is the maximum price a customer will accept for a product before declining to buy. It is best understood as a distribution across a segment rather than a single number, because different buyers value the same offer differently. The individual ceiling is the reservation price.
How do you calculate willingness to pay?
You estimate it rather than calculate it from a formula. Use stated-preference methods (Van Westendorp, Gabor-Granger, or conjoint) before launch, then confirm with revealed-preference transaction data once real sales are available. Triangulate at least two methods.
What is the formula for willingness to pay?
There is no single universal formula. Conceptually, WTP equals the price paid plus consumer surplus. In choice-based conjoint, WTP for a feature is its part-worth utility divided by the negative of the price coefficient. In Van Westendorp, reference prices are determined by where the price-perception curves intersect.
What is an example of willingness to pay?
A buyer values a software tool at $120 but pays the $90 list price. Their willingness to pay is $120, and the $30 difference is consumer surplus the seller left on the table. Measuring that $120 ceiling would have let the seller price closer to it.
What factors influence willingness to pay?
Perceived value is the largest driver, followed by the availability and price of alternatives, switching costs, budget, urgency, and brand strength. The same buyer’s WTP rises when substitutes are weak and falls when a comparable option is easy to reach, which is why WTP is relative, never fixed.
How is willingness to pay used in pricing?
Companies use WTP to set value-based prices and per-segment price corridors, replacing cost-plus with prices anchored to measured customer value. A decision owner prices inside that corridor and reviews it as the market shifts.
Diagnostic checklist and next steps
Before your next pricing decision, ask five questions:
- Can you state willingness to pay by segment, or only as one company-wide number?
- When did you last refresh your WTP estimate against current competitive conditions?
- Are your prices anchored to measured customer value, or to cost plus a target margin?
- Does one accountable owner set the price using WTP evidence, or is it decided by committee?
- Do you triangulate at least two measurement methods, or rely on one survey?
If these questions reveal gaps, start with a focused approach. Select one high-volume product, conduct a Van Westendorp study or analyze your transaction history, and establish a per-segment price corridor with a single owner and quarterly review. One measured decision is more effective than relying on gut instinct.
Turning willingness to pay into realized margin is the work our pricing practice does every day. Book a pricing diagnostic with Revology Analytics’ Pricing & RGM Advisory to pressure-test your prices against what your customers will actually pay.