Master retail data and governance to boost margins, competitiveness, and revenue.
Many retailers use the traditional cost-plus method: calculate cost, add a markup, and distribute merchandise. Though familiar, this approach gradually erodes margins by ignoring demand and competition.
Uniform cost-plus rules are often applied across thousands of SKUs, disregarding demand, competition, or customer perception. Leading competitors use elasticity modeling and cross-category analysis to improve market share and margin, widening the gap with cost-plus users.
A 1% improvement in price realization results in a 6.4% increase in operating profit for the median firm. Pricing is therefore the most impactful P&L lever available, provided it is approached as a strategic function rather than a routine accounting task.
This guide bridges foundational concepts with actionable tools. It outlines the frameworks, data inputs, KPIs, and governance models that distinguish effective retail pricing from exceptional execution. In the next section, we clarify what retailer pricing really means and how it differs from related terms, laying the groundwork for your pricing strategy.
What Retailer Pricing Means
Definition of Retailer Pricing vs Selling Price vs Wholesale Price
Retail pricing sets the price at which merchandise is sold directly to consumers. It’s where cost, demand, competition, and strategic positioning collide. It differs from wholesale pricing (what you pay your supplier) and from selling price (what customers actually pay after discounts, markdowns, and promotions).
Here’s the distinction in practice: you buy a shirt at $15 from a supplier (wholesale price). You decide to sell it for $45 (retail price). During a sale, you mark it down to $30 (selling price). A pricing strategy determines which levers to pull and when to pull them.
Core Terminology in Retail Pricing
Vocabulary matters in pricing. List price is your standard retail asking price, the anchor customers see. Regular price is your baseline when no promotion is running. A promotional price is a temporarily discounted price during a sale. Markdowns are permanent price reductions, usually to clear aging inventory or fill gaps in the assortment. Gross margin is your profit as a percentage of retail price: (retail price − unit cost) / retail price. Contribution margin is what’s left after variable costs (costs that change with sales volume); it covers overhead and profit.
Precision is essential. When stating a “20% discount,” clarify the reference point. Discount depth, duration, and frequency all influence cannibalization, brand perception, and promotional ROI.
Where Pricing Decisions Sit Across Functions
Pricing decisions are distributed across the organization. Merchants manage category strategy and promotional calendars. Finance sets margin targets and EBIT goals. Merchandising oversees inventory and markdown timing. E-commerce teams test localized and personalized pricing. Pricing analysts develop elasticity models and identify exceptions. Leading retailers establish a pricing council—a cross-functional group that aligns perspectives and ensures consistency.
Why Retailer Pricing Matters

Revenue, Gross Margin, and Price Perception Impacts
Price simultaneously affects volume sold and profit per unit. Excessive price increases can reduce volume more quickly than they improve margin. Conversely, frequent price reductions may encourage customers to seek discounts, undermining brand equity and future pricing power.
A European non-food retailer found that 40% of promotional lift on appliances came from cannibalization, not incremental sales. By adjusting the discount strategy, the category margin improved by 5.6% in three months.
Pricing communicates brand positioning. Significant price reductions by premium brands may signal a lack of confidence. Psychological pricing, such as $4.99 versus $5.00 or tiered pricing models, is effective because customers interpret price as a positioning statement rather than performing detailed calculations.
Competitive Positioning and Customer Response
Customers maintain reference prices for frequently purchased items. For example, grocery shoppers are aware of typical milk and egg prices, while apparel buyers recognize the quality implications of $79 versus $99. Effective pricing aligns with these established anchors.
Price index measures your position by dividing your price by the competitor’s average price for the same item. For example, if your bread price index is 1.10 (meaning your price is 10% above competitors’), you must justify this higher price through factors like having exclusive supply, superior quality, convenience, or strong brand positioning. Without a clear rationale, customers may leave or stay only if you reduce your margins.
Store-level localized pricing increases gross profit by 3.46% compared to chain-wide uniform pricing. This is due to variations in competitive density, income, and assortment options by neighborhood. Wealthier areas can sustain higher prices, while price-sensitive neighborhoods require more competitive pricing. Uniform pricing across all locations often results in missed revenue opportunities.
Inventory Health, Markdown Risk, and Cash Flow Effects
Pricing affects inventory turnover. Slow sellers often require clearance, which reduces margins and ties up capital. This leads to steep markdowns, which may signal to customers that items were overpriced and harm brand perception.
A European apparel retailer reduced markdown loss by 2% and increased sell-through 6.9% using AI for markdown optimization. The system predicted price elasticity by item, accounting for seasonality and events, lowering risk and freeing cash.

Key Insight: Improving price realization by just 1% can drive a 6.4% increase in operating profit. The main takeaway: Strategic pricing is the single highest-leverage P&L action available to retailers. Prioritize disciplined pricing to maximize profit impact.
The Main Retailer Pricing Models and Strategies

Cost-Plus, Competitive, Value-Based, and Dynamic Pricing
Cost-plus pricing is commonly used: calculate the cost, apply a markup (e.g., 2.5x for a 60% margin), and set the price. While simple and defensible, this method is fundamentally flawed as it overlooks demand, customer willingness to pay, and competitor pricing. Cost-plus should serve as a minimum threshold and a strategic ceiling, rather than the sole pricing method.
Competitive pricing is based on competitor pricing. Monitor 3–5 key competitors for high-traffic items and maintain prices within 2–5% of their levels. The drawback is a reactive approach: if competitors misprice or margins decline across the category, your pricing follows suit. However, for items where price image is critical, such as milk, bread, or seasonal products, maintaining competitive parity is essential.
Value-based pricing sets prices according to perceived customer value. This approach requires elasticity estimates, strong brand positioning, and often A/B testing. For example, a premium coffee brand may charge 30% more than commodity coffee due to perceived quality. While value-based pricing can deliver the highest profit, it demands rigorous data analysis and deep category expertise.
Dynamic pricing adjusts prices in real time based on demand, inventory, competition, or customer attributes. Retailers running AI-driven dynamic pricing report 2–5% sales growth and 5–10% margin increases (BCG). For details on how pricing tools and software for retail enable this, see our implementation guide. The tradeoff: operational complexity, customer resentment (they hate knowing others paid less), and governance overhead.

Everyday Low Price vs High-Low Promotional Pricing
Everyday low pricing (EDLP) maintains consistent prices, encouraging customers to shop for value rather than deals. Retailers such as Aldi and Costco demonstrate the effectiveness of this approach, as consistency builds trust and reduces promotional complexity. However, margins are typically tighter due to price-based competition, and the ability to use promotions to drive traffic during slow periods is limited.
High-low pricing establishes a regular price and uses periodic sales events—time-limited discounts used to attract more shoppers and sell off extra products—to drive traffic and clear inventory. This approach, common in grocery and general merchandise, offers flexibility by maintaining margins (profit per item sold) on regular prices and strategically using promotions (temporary price reductions). However, excessive promotions can make the sale price the de facto, or usual, price. A Finnish retailer found that, across 140,000 promotions, gross sales increased by 130% on average, but 40% of this increase was due to cannibalization: customers bought promoted items instead of non-promoted ones within the same category.
Most retailers blend both: EDLP on traffic drivers, high-low on discretionary items.
Psychological Pricing, Price Lining, Bundles, and Markdowns
Psychological pricing exploits perception: Psychological pricing leverages customer perception; for example, $9.99 appears less expensive than $10.00 despite the minimal difference. Price lining uses distinct price points, such as $29.99, $49.99, and $79.99, to segment assortments and guide customer choices. The good-better-best model, with approximately 40% price gaps, is standard in the industry as it clearly communicates quality tiers without overwhelming the assortment. Received value and grow the basket size. A printer bundled with ink and paper at a discount moves faster than separate sales. Markdown is your exit hatch: when inventory ages, colors break, or seasons end, markdown and clear. Timing is critical. Too early and you’ve taught customers to wait; too late and you’ve turned cash into garbage.

A Practical Framework for Setting Retail Prices
Define Pricing Objectives by Category and Channel
Begin by clearly defining the role of each category. Traffic drivers, such as milk, eggs, and bread, attract customers through competitive pricing and may require lower margins to increase store visits. Margin drivers, including discretionary items and less-competitive brands, generate profit and should be optimized for margin. Seasonal items follow demand and clearance cycles, with higher initial pricing and more aggressive markdowns as the season ends.
Channel selection influences pricing strategy. Store pricing reflects local competition and customer demographics. E-commerce pricing is often 2–5% higher due to lower theft risk and reduced loss-leader pressure, and can be tested at the customer or zip-code level. Private-label products are typically priced 8–15% below national-brand equivalents to signal value and capture additional margin.
Develop a decision matrix that includes category, role (traffic, margin, or seasonal), target margin floor (cost of goods sold plus a percentage), and competitive win rate (percentage of items at or below competitor prices). This matrix serves as a governance tool for pricing decisions.
Segment Products by Role: Traffic Drivers, Margin Drivers, Seasonal Items
SKUs vary in importance and performance. Retailers with large assortments cannot optimize every item identically. Segment products based on sales volume, margin contribution, and price sensitivity.
•Tier 1: Traffic Drivers (500–1000 SKUs) — High volume, high visibility, typically thin margin. Price for competitiveness. Accept 35–45% gross margin to drive store visits and basket growth.
•Tier 2: Margin Drivers (5,000–20,000 SKUs) — Medium volume, medium visibility. This tier has optimization upside. Target 50–60% gross margin. Use elasticity data and competitive overlap analysis. Value-based pricing has the highest ROI here.
•Tier 3: Long Tail (1.9M+ SKUs) — Low volume, low visibility. Apply rules-based automation, using cost-plus with guardrails: set a floor at cost of goods sold plus 25%, and a maximum escalation of 15% above cost. Automate these processes and allocate analyst resources to Tier 1 and Tier 2.
A US retailer implemented this segmentation and discovered that 3% of SKUs accounted for 70% of margin dollars. By focusing pricing analysts on Tier 1 and Tier 2, and automating Tier 3, the retailer improved overall margins by 1.7% within 6 months.
Set Guardrails for Floors, Ceilings, and Exception Handling
Build a Four-Tier Pricing Architecture: (1) List Price (your standard retail price), (2) Target Price (the price you want for margin optimization), (3) Guidance Floor (lowest recommended price, accounting for competition and margin), and (4) Absolute Floor (the lowest you’ll go, typically COGS plus minimum acceptable margin).
For a $12 item with $8 landed cost and 40% target margin:
•List Price: $12 (60% margin)
•Target Price: $12 (optimized for elasticity and competitive position)
•Guidance Floor: $10.50 (match competitor on price image)
•Absolute Floor: $9.20 (achieve minimum 23% margin)
Merchants’ price within the band. But dropping below the floor requires a pricing manager sign-off. This blocks exception sprawl: one buyer cuts price to close a deal, another follows to keep share, and before you know it, 20% of the category is at the floor.
Implement a guardrail matrix to automatically flag exceptions. For each SKU, identify whether the price falls below the guidance floor, whether the markup exceeds the competitive ceiling by more than 5%, or whether there are more than 3 price changes within 90 days. Route these outliers to analysts for review.
The Data Inputs Required for Better Pricing Decisions
Cost Data, Vendor Terms, and Landed Cost Components
Good pricing starts with accurate cost. Landed cost includes unit cost, freight, tariffs, duties, damage, and shrinkage. A $10 item with $2 per-unit freight you don’t account for is really $12, not $10. That error cascades across thousands of SKUs.
Many retailers encounter issues due to outdated or incomplete cost data, such as relying on old supplier contracts or omitting freight costs. Establish a monthly reconciliation process comparing posted costs to actual finance payments, and flag variances greater than 2%. This discipline can improve margin forecasting by 150–200 basis points.
Competitor Prices, Assortment Overlap, and Known Value Items
Monitor traffic item prices weekly. Known Value Items (KVIs)—categories such as produce, milk, eggs, and key seasonal items—shape price image. Being 10% higher than competitors on these means customers see you as expensive and shop elsewhere. Track your price index (your price ÷ competitor average) on 30–50 KVIs. Target: 0.98 to 1.02. Our guide to competitive pricing strategies shows how to build this into operational rhythm.
Assortment overlap matters. Three competitors with different premium apparel brands let one carry the mass-market option and sustain a premium. But if all three carry identical assortments, price transparency is perfect, and differentiation requires margin sacrifice or service.
Apply Known Value Item (KVI) scoring by rating items from 0 to 100 based on their impact on price perception. For example, milk may score 95 due to high customer awareness, while a niche paper product may score 15. Allocate analyst resources to items with the highest scores.
Demand Signals, Elasticity, Inventory, and Seasonality
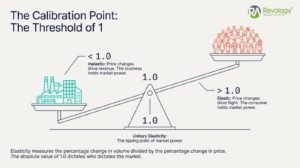
Price elasticity measures the volume response to a price change. A -1.5 elasticity: 1% price increase = 1.5% volume drop (elastic; volume-sensitive). A -0.5 elasticity: 1% price increase = 0.5% volume drop (inelastic; less price-sensitive). Grocery staples run -0.3 to -0.6; discretionary apparel runs -1.0 to -2.0.
Estimate elasticity two ways: historical data (how volume changed when you last repriced) and A/B tests (price item X at $9.99 in Store A and $11.99 in Store B, measure the difference). A/B testing is precise but slow. Regression on transaction data gives 70–80% accuracy and scales faster. For structured price testing for retailers and distributors, we’ve published a quick framework.
Inventory position influences pricing strategy. With high seasonal inventory and limited time before the season end, it is advisable to accept lower margins to clear stock and avoid emergency markdowns. Conversely, low inventory with strong sell-through supports maintaining price to protect margin and allow demand to exceed supply.
Seasonality is a fundamental consideration. For example, October pricing should reflect that Halloween items are three weeks away. Pricing for Black Friday three weeks in advance demonstrates confidence in inventory, while discounting after the event may indicate excess stock. Develop a seasonal calendar that outlines pre-season, peak, and clearance phases for each category, along with corresponding margin targets.

How to Calculate a Retail Price
Markup and Margin Formulas with Examples
Two formulas. Gross margin % = (Retail Price − Unit Cost) / Retail Price. Markup % on cost = (Retail Price − Unit Cost) / Unit Cost. They’re linked but not interchangeable.
With an $8 cost and a $12 retail price:
•Gross margin % = ($12 − $8) / $12 = 33.3%
•Markup % on cost = ($12 − $8) / $8 = 50%
Retailers typically focus on margin, while vendors focus on markup. Understanding both perspectives helps prevent miscommunication.
To calculate retail price from cost and target margin: Retail Price = Unit Cost / (1 − Target Gross Margin %). At an $8 cost and a 40% target, the retail price is $8/(1 − 0.40) = $13.33.
Incorporating Discounts, Promotions, and Markdown Cadence
List price and selling price differ when you run promotions and markdowns. If you promote 40% of the year at 20% off, your average selling price is 88% of the list: (0.60 × list) + (0.40 × 0.80 × list) = 0.88 × list. Bake this into your pricing strategy from the start.
Many retailers set list prices without accounting for promotions, resulting in margin loss when promotions are applied. A more effective approach is to set list prices based on the actual promotional calendar. For example, if a 20% discount is offered 30% of the year, set the list price high enough to ensure the blended margin meets your target.
Markdown math is different. Buy seasonal items at $100 cost, price at $200 (50% margin), and clear 40% of stock at $100 (cost). Blended margin: (0.60 × 50%) + (0.40 × 0%) = 30%. Factor markdown risk into buying decisions.
Key Insight: A major distributor reduced discounts from $25M to $4M through real-time pricing transparency and deal-guidance platforms, making pricing 6 times more efficient while protecting margins.
When to Use Rules-Based Pricing vs Optimization Models
For Tier 3 (long tail) items, implement rules-based pricing using simple formulas and guardrails, with monthly exception reviews. This approach is scalable and requires minimal analyst oversight.
Tier 2 (margin drivers): Use optimization models. Elasticity-informed algorithms recommend prices based on cost, competition, inventory, and demand. These need clean data and governance rigor but deliver measurable margin lift (1–2% typically).
For Tier 1 (traffic drivers), models provide pricing recommendations, but final decisions are made by merchants. Traffic-driving items require consideration of brand positioning and customer perception, which algorithms may not fully capture.
KPIs That Should Guide Retailer Pricing
Gross Margin, Contribution Margin, and Realized Price
Monitor the weekly gross margin percentage by category as a key performance indicator. If margins decline without planned promotions, investigate potential issues such as price exceptions, invoice errors, or shrinkage.
Contribution margin is revenue minus variable costs. For many retailers, this matters more than gross margin because fixed costs don’t move per item. Use contribution to decide whether long-tail items are worth carrying.
Monitor realized price—the blended average selling price after all discounts and markdowns. If the list price is $10 but the realized price drops to $8.50 due to unmeasured promotions and exceptions, you’re leaking margin blind.
Price Index, Win Rate, Conversion, and Basket Metrics
The traffic driver price index serves as a daily benchmark. A value below 0.95 (5% below competitors) positions you as a price leader but may result in margin sacrifice.
Win rate (the percentage of traffic items at or below the competitor’s price) indicates competitive positioning. A 60% win rate means you’re lower on 60%, higher on 40%. Below 50% on KVIs? Your price image suffers.
Conversion rate and basket size provide insight into the downstream effects of pricing. If a favorable price index coincides with lower conversion and smaller baskets, pricing may be below customer acceptance, or profitable items may have been removed. Monitor price index, conversion, and basket size collectively.
Markdown Rate, Sell-Through, and Inventory Turns
Markdown rate, the percentage of full-price retail inventory sold at clearance, indicates pricing and purchasing accuracy. An apparel markdown rate above 8–10% suggests overbuying or overpricing, while a rate below 3% may indicate conservative buying or strong demand. Both extremes can negatively affect profitability.
Sell-through (percentage of starting inventory sold at full price) is your health metric. 60% sell-through is solid. 40% signals that the full price is too high or that the item falls short of customer expectations. Use sell-through by item and by attribute (color, size, brand) to refine pricing and sourcing.
Inventory turns, calculated as cost of goods sold divided by average inventory, measure capital efficiency. Higher inventory turns reduce markdown risk, minimize tied-up capital, and decrease obsolescence. Pricing adjustments can be used to accelerate inventory turnover when needed.

Worked Example: Pricing a Category End-to-End
Scenario Setup
You run the beverage department at a regional grocer. The mix: national brands (Coke, Sprite, Fanta), private label house-brand cola, and regional brands. Three competitors within 5 miles. You have 18 months of transaction data, supplier cost sheets, and secret shopper competitive intelligence. Finance targets 40% gross margin. Merchandising forecasts 10% of weeks running 20% promotions.
Your task: set recommended retail prices for five items that represent the category structure.
Demand Analysis and Elasticity Estimation
You regress 18 months of transaction data on five items, controlling for seasonality and events. Results:
•2L Coke (traffic driver): Elasticity -0.85 (inelastic, price-sticky)
•6-pack Coke (secondary pack): Elasticity -1.35 (more elastic, higher switching)
•2L Private Label Cola: Elasticity -1.8 (very elastic, price-sensitive)
•Sprite 12-pack (growing brand): Elasticity -0.95
•Regional 6-pack: Elasticity -2.1 (highly elastic, small-brand penalty)
Inelastic demand (Coke 2L) lets you hold the price despite competition. Elastic demand (private label, regional) makes volume price-sensitive. The price is high, and you lose volume.
Cost and Competitive Setup
| Item | Landed Cost | Competitor Avg Price | Margin Target | Notes |
|---|---|---|---|---|
| 2L Coke | $3.50 | $4.29 | 40% (traffic driver) | KVI; set list price at or within 2% of competition |
| 6-pack Coke | $4.20 | $5.99 | 40% | Secondary size; price at parity |
| 2L Private Label | $2.10 | $2.59 | 42% (higher margin on elastic item) | KVI: set list price at or within 2% of competition |
| Sprite 12-pack | $3.80 | $6.49 | 38% (margin sacrifice for growing brand) | Growing demand warrants investment in price |
| Regional 6-pack | $2.50 | $3.99 | 45% (margin premium to sustain specialty item) | Niche brand; lower volume requires higher unit margin |
Price Recommendation by Item Role and Elasticity
Using Retail Price = Cost / (1 − Target Margin %), adjusted for elasticity and competitive position:
2L Coke (Traffic Driver, Inelastic):
•Base: $3.50 / 0.60 = $5.83
•Competitor is $4.29. Price at $4.39 (within 2% above) to maintain price image.
•Margin at $4.39: ($4.39 − $3.50) / $4.39 = 20.3% (below target, but traffic positioning requires it)
•List price: $4.39
6-pack Coke (Secondary Pack, Moderately Elastic):
•Base: $4.20 / 0.60 = $7.00
•Competitor is $5.99. Price at parity.
•Margin at $5.99: ($5.99 − $4.20) / $5.99 = 29.9% (below target due to pack dynamics)
•List price: $5.99
2L Private Label (Price-Sensitive, Elastic):
•Base: $2.10 / 0.58 = $3.62
•Competitor is $2.59. Elasticity is high (-1.8); price is $3.49 (35% above the competitor).
•Margin at $3.49: ($3.49 − $2.10) / $3.49 = 39.8% (near target despite elasticity)
•List price: $3.49
Sprite 12-pack (Growing Brand, Below-Average Elasticity):
•Base: $3.80 / 0.62 = $6.13
•Competitor is $6.49. The price is $5.99 to win a share.
•Margin at $5.99: ($5.99 − $3.80) / $5.99 = 36.6% (below target; growth investment)
•List price: $5.99
Regional 6-pack (Niche, High Elasticity, Specialty Positioning):
•Base: $2.50 / 0.55 = $4.55
•Competitor is $3.99. But this is specialty positioning, so brand matters more than parity. Price at $4.49 (within 12% above).
•Margin at $4.49: ($4.49 − $2.50) / $4.49 = 44.3% (near target; specialty margin)
•List price: $4.49
Promotional and Markdown Overlay
You’ve set list prices. Now apply your 10% promotional calendar. Two SKUs (2L Coke and 6-pack Coke, the traffic drivers) will run 20% off in 10% of weeks. Expected average selling prices:
•2L Coke: (0.90 × $4.39) + (0.10 × 0.80 × $4.39) = $4.15 (average realized price)
•6-pack Coke: (0.90 × $5.99) + (0.10 × 0.80 × $5.99) = $5.67 (average realized price)
Blended category margin across all five items, factoring promotions and an estimated 5% markdown (on slower-moving regional items):
•2L Coke margin contribution: 20.3% × volume (low margin; traffic driver)
•6-pack Coke margin contribution: 22.9% × volume (after promotional blending)
•2L Private Label margin contribution: 39.8% × volume (high margin driver)
•Sprite 12-pack margin contribution: 32.1% × volume (after promotional blending)
•Regional 6-pack margin contribution: 38.2% × volume (high margin despite niche status)
Outcome: Blended category margin is 32.1% (below the 40% target, but appropriate given the traffic-driver strategy on Coke and the promotional calendar). Revenue uplift vs previous uniform markup approach: 8–12% because you’re properly pricing elastic and inelastic items, not applying a uniform markup.
What to Communicate Internally and Externally
To finance: “We’ve repriced to align with customer elasticity and competitive positioning. Traffic drivers are priced to maintain price image (lower margin, higher volume). Margin drivers are optimized. Blended margin is 32% vs. the 40% target—that reflects promotional strategy and traffic-driving philosophy. Expected outcome: category volume up 8–12%, category profit dollars up 6–10%.”
To merchandising: “Attached is the recommended price set effective [date]. Coke anchors price image. Private label and regional drive margin. Promotional plan: weeks [dates] run 20% off on traffic drivers. Markdown plan: regional items clear at 25% off if sell-through falls below 50% by [date].”
To store managers: “New pricing reflects customer expectations. Traffic items (milk, bread, 2L Coke) are competitively positioned so we feel fair. Other items are priced for margin. Promotions target traffic items in weeks [dates]. Questions to [pricing contact].”
Retailer Pricing by Channel and Operating Model
Store vs. E-commerce Pricing Considerations
Stores face shrinkage, overhead, and localized competition. E-commerce faces fulfillment, returns, and national competition. These economics justify different prices.
Store pricing may be lower on traffic items, as in-store visits often lead to larger basket sizes and additional purchases. For example, a customer may visit for a 2L Coke at $4.39 and ultimately purchase a $40 basket. The margin loss on the traffic item is offset by the overall basket margin.
E-commerce pricing for commodities can be higher, as customers often choose online retailers for convenience, selection, or loyalty rather than price alone. A 5–10% ecommerce premium on commodities is common and justifiable.
For multi-channel operations, our guide to dynamic pricing for B2B and wholesale covers nuances of channel alignment. Omnichannel consistency is a governance issue. Store and e-commerce prices are too far apart, and customers get angry. Simple rule: ecommerce = store + 2–5%, clearly disclosed. Use this band only for commodity traffic items; keep discretionary items at parity.
Localized Pricing Decisions
Store-level localization increases gross profit by 3.46% compared to uniform pricing. Geographic factors are important: wealthier suburbs can support higher discretionary prices, while price-sensitive neighborhoods require competitive pricing on traffic items.
Build a local competitive density model: identify 3–5 key competitors within 5 miles per store, monitor prices weekly, adjust price floors. Three nearby competitors demand tighter competitiveness than a store with no nearby rivals.
Use income-based clustering for discretionary margins: higher-income areas take higher margins on apparel and home goods; lower-income areas need competitive parity.
Private Label vs National Brand Pricing Approaches
Private label products are typically priced 8–15% below comparable national brands, capturing additional margin while providing a clear value signal to customers. This approach avoids commoditizing the category.
Below 3–5%? Customers don’t see the value difference. Above 20%? You commoditize the category and erode margins on both. The 8–15% band is the sweet spot. For related guidance on retail discount optimization strategies, we’ve outlined a framework for balancing depth with margin protection.
For private label, invest in packaging and shelf placement — non-price signals that raise perceived quality. Premium packaging at eye level next to a national brand? Sustains a narrower price gap than plain packaging on the bottom shelf.
Common Pitfalls in Retailer Pricing
Overreliance on Cost-Plus and Blanket Markup Rules
Cost-plus pricing is quick and appears reliable, but it often results in mispricing. A 50% markup may be suitable for some branded items, but can underprice commodities, which may support a 60% margin, and overprice traffic drivers, which may require a 30% margin to remain competitive.
Replace uniform pricing rules with segmentation. Assign analyst attention to Tier 1, apply elasticity-informed models to Tier 2, and use rules-based automation with guardrails for Tier 3. Although this approach requires more initial effort, it typically yields returns within a few months.
Ignoring Competitor Overlap and Customer Price Perception
Many retailers skip competitor monitoring on traffic items. They assume they’re in the ballpark and move on. Then surveys reveal: “I think [Retailer X] is expensive.” Pricing image problem, not product problem. Monitor 30–50 traffic items weekly. A 3–5% price index drift erodes brand perception faster than you’ll notice.
Customer price perception lags reality 4–6 weeks. Cut prices aggressively in week 1, and customers won’t see you as cheaper until week 5. Raise prices, and they complain immediately. Pricing decisions have long-term consequences that one-off promotions won’t fix.
Poor Promo Governance, Data Quality Gaps, and Exception Sprawl
Without proper governance, promotional activity can become uncoordinated. One buyer may offer a 30% discount to clear inventory, another may use a 15% discount to protect market share, and a third may implement bundling. This lack of coordination can reduce category margin by 10 percentage points, with no clear accountability.
Establish a pricing council responsible for approving promotions, exceptions, and significant price changes. Clearly define decision rights, including who approves exceptions, the dollar limits, and required supporting data. Clear governance helps prevent margin erosion.
Data quality is essential. Outdated cost data leads to inaccurate pricing, delayed competitor data causes slow responses, and incorrect sales data (such as missing shrinkage or incorrect invoice prices) results in inaccurate elasticity estimates. Invest in data quality as a prerequisite for effective pricing.
Exception sprawl happens when guardrails are ignored. Price drops below the floor for a customer deal. Then another. Then 5% of items are below the floor, and the margin erodes silently. Enforce guardrails monthly: find all below-floor prices, understand why, and reset if unjustified.
Implementation Roadmap for Pricing Improvement

Phase 1: Baseline Diagnostic and Opportunity Sizing
Conduct a pricing diagnostic by auditing current prices, costs, and competitor prices for your top 500–1000 items. Compare retail prices to the theoretical optimal price, which incorporates cost, elasticity, and competitive position. Calculate the potential margin improvement from repricing.
Large retailers often identify 150–200 basis points (1.5–2% of current gross margin) in margin improvement through repricing alone, without changes to volume or promotions. Additional gains of 50–100 basis points can be achieved through promotional optimization and exception management.
Quantify the opportunity in dollar terms. For example, a category with $50 million in revenue and a 30% gross margin would realize $1 million in incremental profit from a 200-basis-point improvement. This financial impact supports proceeding to subsequent phases.

Phase 2: Pilot in One Category or Region
Don’t reprice 100% of SKUs at once. Pick one category (beverages) or one region where the data is clean and merchants are supportive. Reprice using the methodology (cost + elasticity + competitive + guardrails) and measure after 8–12 weeks.
Monitor three key metrics: gross margin (primary objective), price perception (via surveys or secret shoppers), and volume (to ensure margin improvements do not reduce sales). A successful pilot typically achieves a 75–150 basis point margin improvement, price perception within 2% of competitors on traffic items, and volume within 1–2% of forecast.
If the pilot is successful, expand to adjacent categories. If results are below expectations, diagnose potential issues such as data quality, merchant execution, or incorrect elasticity modeling. Refine the approach and conduct another pilot as needed.
Phase 3: Governance, Tooling, and Rollout Cadence
After pilot validation, build scale. Set up a pricing council (merchant lead, category manager, analyst, finance) with monthly meetings. Define decision rights and guardrails. Deploy tooling: a spreadsheet or simple software to track costs, competitor prices, recommendations, and guardrails. Automate Tier 3 updates, flag exceptions.
Train merchants and managers on the pricing framework. Emphasize that pricing is a strategic function, not a remedy for poor purchasing decisions. Merchants with excess inventory should use demand signals to inform future buying, rather than relying on aggressive pricing to resolve overstock.
Roll out the initiative to 1–2 categories per month, achieving full coverage within six months. Review performance metrics (margin, volume, exception rate) monthly and adjust guardrails or training as needed.
How Analytics and AI Support Retailer Pricing (and Where Human Judgment Remains Critical)
Elasticity Estimation and Scenario Modeling
Elasticity estimation quantifies how volume responds to price changes. This cannot be reliably estimated intuitively. Regression models using at least 12 months of transaction data, adjusted for seasonality and events, can estimate elasticity with 70–85% accuracy. This serves as the foundation for data-driven pricing.
Scenario modeling leverages elasticity estimates to evaluate the impact of price changes on volume, revenue, and margin. Models can test hundreds of scenarios in minutes, whereas manual analysis is significantly slower.
However, models have limitations, as they assume historical data predicts future outcomes. Changes in competition, consumer preferences, or new categories without historical data can reduce model reliability. Use models as decision-support tools rather than as replacements for human judgment. For price optimization strategies and best practices, consult our resource library.
Price Optimization, Recommendation Engines, and Human Review
Price optimization algorithms use elasticity, costs, inventory, and competition to recommend prices that maximize an objective (e.g., gross profit dollars, margin %, revenue). Algorithms recommend; humans review, adjust, approve.
An effective recommendation engine flags items that fall below guardrails (red), within guardrails (green), or present cannibalization risk (orange). This system enables human reviewers to focus on trade-off cases rather than reviewing every item.
Leading retailers follow this process: the algorithm generates recommendations, merchants or analysts review 10–20% of outliers or high-revenue items, merchants adjust as needed (such as for promotional alignment), guardrails prevent deviations beyond set thresholds without escalation, and the pricing council conducts quarterly trend reviews.
Where AI Helps Most and Where Judgment Still Matters
AI excels at: (1) Elasticity from large datasets (humans can’t reliably estimate intuitively). (2) Scenario modeling at scale (testing thousands of price combos). (3) Flagging exceptions and guardrail breaches (automating mundane checking). (4) Markdown optimization for long tail (low individual revenue, high aggregate margin).
Judgment is critical for: (1) Traffic-driver pricing (brand positioning and perception matter as much as math). (2) Promotional strategy (which items, when—requires category knowledge and customer insight). (3) Exception decisions (low-volume item with poor elasticity data may need judgment, not algorithm). (4) Competitive response (competitor cuts price—should you follow? That’s strategy, not math).
Retailers that rely solely on algorithms without human review are less successful. Successful retailers use algorithms to identify key decision points and review criteria, then apply human judgment to finalize pricing.
Governance, Testing, and Change Management
Pricing Councils, Approval Workflows, and Decision Rights
A pricing council meets monthly, includes merchandising, finance, analytics, and ecommerce, and approves all reprices and major promotions. Define decision rights: a merchandiser approves price exceptions up to $5,000 annual impact; above that, council review. Finance can block if the margin impact exceeds the threshold.
The workflow should proceed as follows: generate recommendations, conduct merchant review, escalate to council review if necessary, implement approved changes, and measure post-implementation results. Document all decisions and their rationale to build institutional knowledge and identify patterns, such as repeated rejection of certain recommendations, which may indicate a need to refine the model.
A/B Testing and Holdout Measurement
Strongest pricing insights come from controlled experiments. Run an A/B test: price item X at $9.99 in Store Set A and $11.99 in Store Set B, hold everything else constant, and measure the difference. Ground truth on customer response.
Maintain a testing cadence of 2–3 small A/B tests per month on medium- to high-volume items. After eight weeks, elasticity will be validated for an increasing number of items. Incorporate test results into models to refine elasticity estimates.
When repricing, use holdout measurement by keeping one store or region unchanged and comparing results to the repriced regions. This approach isolates the impact of pricing changes from other variables such as seasonality, promotions, or competitive actions.
Communication with Merchants, Stores, and Digital Teams
Repricing initiatives often prompt questions and concerns, some of which may be valid. Establish a comprehensive communication plan:
•30 days before rollout: Present repricing rationale, expected margin, and volume impact to all stakeholders. Show the diagnostic data.
•Day 1: Confirm prices updated correctly in all systems. Alert stores for customer questions.
•Weeks 2–4: Monitor for outliers (unexpected swings, complaints) and respond in real-time.
•Week 8: Post-implementation review. Actual vs. expected margin, volume, and price perception. Diagnose underperformers.
•Quarterly: Pricing council reviews trends, test results, and exception patterns. Adjust guardrails or strategy.
Transparency builds adoption. Merchants who understand methodology and see data execute recommendations accurately and advocate for the approach.
FAQ About Retailer Pricing
What Does Retail Pricing Mean?
Every price tag on a shelf is the output of a decision system — whether that system is deliberate or accidental. Retail pricing combines cost data, demand elasticity, competitive positioning, and strategic goals to determine the selling price of merchandise sold directly to consumers. It differs from wholesale pricing (what retailers pay suppliers) and from selling price (what customers actually pay after discounts and promotions). The discipline spans psychological pricing, promotional strategy, and inventory management.
What Are the 4 Types of Pricing?
Cost-plus pricing sets the price as a markup over unit cost. Competitive pricing is anchored to competitors’ prices to maintain positioning. Value-based pricing sets the price based on perceived customer value. Dynamic pricing adjusts prices in real-time based on demand, inventory, and competition. Most retailers use a blend: cost-plus as a floor, competitive input on traffic items, value-based optimization on discretionary items, and dynamic elements on seasonal or low-inventory items.
What Are the 5 C’s of Pricing?
The 5 C’s framework includes: Cost (your landed cost and margin requirements), Competition (prices charged by direct competitors), Customer (price perception and willingness-to-pay), Channel (store vs. ecommerce and localization), and Circumstance (seasonality, inventory, promotional calendar). Each element informs the final price decision.
What Are the 5 P’s of Retail?
The 5 P’s are Product (assortment and quality), Price (the monetary offer), Place (channel and location), Promotion (marketing and discounts), and People (customer service). Pricing is one of five levers; the strongest retailers align all five to reinforce positioning.
What Are Known Value Items in Retail Pricing?
Walk into any grocery store, and you already know what milk, eggs, and bread should cost. Those are Known Value Items (KVIs) — products where customers carry a strong, accurate mental price because they buy them frequently or see them advertised constantly. Gasoline is the ultimate KVI. Customers use these anchor prices to form an overall impression of whether a retailer is cheap or expensive. That’s why pricing KVIs at or near competitor levels is non-negotiable for price image; you recover margin on items where customers have weaker price awareness.
How Do I Calculate the Retail Price?
Three approaches: (1) Cost-plus: Retail Price = Cost × (1 + Markup %), e.g., $8 cost × 1.5 = $12 price (50% markup, 33% margin). (2) Margin-based: Retail Price = Cost / (1 − Target Margin %), e.g., $8 cost / (1 − 0.40) = $13.33 for a 40% margin. (3) Competitive-anchored: Set price within a band of competitor prices, then verify margin is acceptable. Method 2 (margin-based) is preferred because it ensures you hit your margin target while maintaining flexibility on competitive positioning.
What Is the Difference Between Retail Price and Selling Price?
Retail price (or list price) is your standard, full asking price. The selling price is the price the customer pays after any discounts, markdowns, or promotions. If the list price is $12 and you run a 20% promotion, the selling price is $9.60. Tracking the gap between retail and selling price (the “realization”) reveals how much margin is lost to discounts and markdowns vs. your list-price plans.
When Should Retailers Use Dynamic Pricing?
Use dynamic pricing when: (1) You have real-time or near-real-time demand and inventory data. (2) Customer backlash to perceived price discrimination is low (e-commerce, B2B, and luxury retail tolerate dynamic pricing better than grocery). (3) Your SKU count is large enough that manual repricing is infeasible. (4) Margin opportunity (from elasticity modeling) justifies the operational complexity. Most grocery and general merchandise retailers start with static prices and guardrail-based repricing, then graduate to dynamic pricing on Tier 2 items as operational maturity increases. Dynamic pricing for Fortune 500 retailers offers a detailed case study of when the investment pays off.
Diagnostic Checklist and Next Steps
Self-Assessment: Is Your Pricing System Costing You Margin?
Ask yourself honestly:
•Cost Accuracy: Product costs updated monthly, including landed cost (unit + freight + duties + shrink)?
•Competitor Awareness: Monitor competitor prices weekly on the top 50 traffic items? Price index within 2% on KVIs?
•Segmentation: Segmented assortment by role (traffic/margin/long tail) or uniform rule across all SKUs?
•Elasticity: Measured or estimated price elasticity for the top 500 items, or relying on gut?
•Governance: Single decision-making body (pricing council) for major reprices, or ad hoc decisions?
•Exception Management: Track items below the cost-plus guideline, or exceptions accumulate silently?
•Promotional Discipline: Promotional calendar planned 6+ weeks ahead with margin targets, or week-to-week tactical?
Three or more “no” answers? You have a significant repricing opportunity. A 1–2% margin uplift is typical. Larger gains if you’ve relied on blanket markups and lacked competitive discipline.
For Resource-Constrained Situations
If the budget is tight, start lean:
1. Month 1: Audit costs and segment the top 1,000 SKUs by role. Identify traffic drivers (low-margin, high-volume) and margin drivers (optimization opportunities).
2. Month 2–3: Monitor competitor prices on 50 traffic items weekly. Calculate price index. Flag gaps >5%, reset to parity.
3. Month 4–6: Pick one category (beverages) and reprice using the framework: cost + elasticity (from history or surveys) + competitive. Measure margin impact.
4.Month 7+: Pilot succeeds? Roll to adjacent categories and build your pricing council.
Minimal spend (mostly internal time), delivers 50–75% of the maximum uplift a full repricing would yield.
Measurement Framework: How to Know If Repricing Worked
After implementation, measure three metrics weekly for 12 weeks:
•Gross Margin % by category. Target: plan or higher.
•Price Index on traffic items. Target: within 2% of the competition.
•Volume vs. Forecast. Target: within 2% (items vary; category near plan).
All three hit the target? Repricing works. Margin up but volume down >2%? You overpriced. Margin flat? You underpriced, or the competition shifted. Diagnose and adjust.
After 12 weeks: incremental margin dollars minus repricing cost. Well-executed repricings pay for themselves in 4–6 weeks and deliver 12–18 months of benefit before competitive moves or cost changes require adjustment.
Ready to audit your pricing and unlock margin opportunity? Book a pricing and revenue growth management diagnostic call with Revology Analytics. We’ll review your current pricing, identify margin leaks, and build a roadmap tailored to your category mix and constraints.