

Pricing policy strategies bridge the gap between strategy and execution. For example, your company targets a 42% gross margin, while competitors undercut you by 8-12% on certain SKUs. Recently, your sales team closed a $2.3M contract with a 28% discount that was not approved until the deal closed.
This is where pricing policy strategies are essential. They are not bureaucratic obstacles, but mechanisms to protect margins while enabling efficient deal flow.
The average B2B business loses over 6% of revenue to hidden off-invoice discounts, unrecovered freight, and rebates — a $60 million profit opportunity for a $1 billion company, according to Revology’s 2025 Maturity Report. That same research shows that companies that improve realized price by just 1% see median operating profit gains of 6.4%. In Automotive, a 1% price improvement yields a 17.4% operating profit gain; in Industrials, 9.4%; in Consumer Staples, 9.2%. Bain research shows 85% of B2B teams believe pricing needs improvement, yet only 15% have effective governance. McKinsey confirms that pricing transformations sustain gross margin improvements of 2-7 percentage points over three years.
What “Pricing Policy Strategies” Means (and How It Differs from Pricing Strategy)

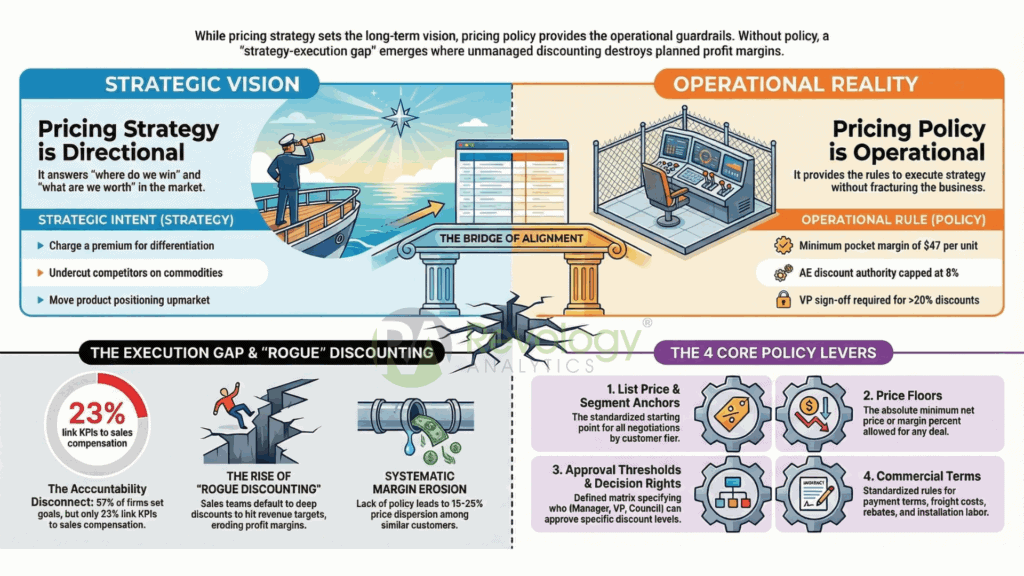
Pricing strategy is directional: Charge a premium for differentiation. Undercut competitors on commodities. Move upmarket.
Pricing policy is operational: Minimum pocket margin of $47 per unit. Discount authority: 8% for AE, 15% for manager, and >20% requires VP sign-off.
Strategy answers: Where do we win and what are we worth?
Policy answers: What rules let us execute that strategy without fracturing?
Price setting relies on CPQ logic, while discounting rules serve as guardrails. Pricing policy provides the full operating framework: it defines approval requirements, compliance measurement, responses to rule violations, and policy adaptation. Discounting rules are tactical; pricing policy strategies are strategic infrastructure.
Every policy has four core levers: list price and segment anchors (your starting point before negotiation), price floors (absolute minimum net price or margin percent), approval thresholds and decision rights (who approves what), and commercial terms (payment, freight, installation, rebates).
Why Pricing Policy Strategies Matter in B2B
Conduct a simple analysis: review all invoices for a product over 90 days, calculate net price per unit after discounts and rebates, and segment the results. Typically, you will find 15-25% price dispersion among similar customers. While some variation reflects true differences in cost-to-serve or competition, much of it does not.
Revology’s 2025 RGA Maturity Report shows the core barriers to profitability. Only 16% of organizations have automated guardrails; 61% still manage discounting manually. More critically, 51% of organizations don’t use a price waterfall — the fundamental tool for tracking where dollars leak through discounts, rebates, and commercial terms. Without it, companies operate in the dark about margin erosion.
Beyond tooling, the strategy-execution gap is systemic: 57% of organizations have established segment-level pricing goals, yet only 23% link pricing KPIs to sales compensation. This mismatch guarantees “rogue discounting.” Sales teams rewarded on revenue (not margin) default to deep discounts to close deals, bleeding away the very margin that pricing strategy is meant to protect.
A clear policy accelerates deals rather than delaying them. When pricing decisions lack clarity, each deal prompts unnecessary negotiation and delays. Transparent floors and tiers ensure that sales representatives understand their authority, approvals are streamlined, and escalation paths are well-defined.
Consistency builds trust. When customers discover peers paid less, they either demand a retroactive adjustment or churn. With a clear, defensible policy (“We price by contract value, segment, and commitment term”), you win the conversation.
The Core Types of Pricing Policy Strategies (and When to Use Each)
Guardrail-based policies work best for established product portfolios. Define floor and discount bands (rep: 0-8%; manager: 8-15%; council:>15%).
Value/segment-based policies acknowledge that customers have different willingness-to-pay and cost-to-serve. Set distinct list prices, discount bands, and thresholds for each segment, with a clear rationale for each.
Deal-based governance works for enterprise deals where every scenario differs. Establish an exception process with defined criteria: customer lifetime value, strategic fit, competitive threat, and required give-get.
Step-by-Step Framework to Build a Pricing Policy Strategy
Begin by defining your objective, rather than focusing on tools or data. Ask what you are aiming to protect or achieve. Common objectives include defending margin within a 50 basis point loss, accelerating cash realization by tightening payment terms, reducing price dispersion to a 5% band, improving win rates in specific segments, or managing competitive intensity.
Objectives should ladder to financial targets. “If we improve realized price by 0.8% on $200M revenue at 35% gross margin, that’s $560K incremental gross profit—enough to fund pricing infrastructure.”
Establish decision rights: Who owns the policy? Who modifies it? Who adjudicates exceptions? The typical structure includes a policy owner (Chief Pricing Officer, SVP Finance, VP RevOps), a pricing council (cross-functional, monthly reviews), exception approval tiers by role, and a clear escalation protocol.
Next, map your price waterfall. Pull 90 days of transaction data and calculate the step-by-step conversion from list to cash collected. Track leakage points by segment and geography. A typical finding: “Core product averages 8% invoice discount overall, but 14% in the Northeast and 16% among top-10 customers.”
Translate strategy into rules. If your objective is defending $28-$32 pocket margin per unit: define discount authority by role, segment-specific floors (Enterprise $90, Mid-market $85, SMB $80), commercial term policies (net 30 standard, net 45 = 1.5% discount equivalent, net 60 = 3%), and bundle pricing (A+B together at 4% discount). Each rule needs a rationale so sales can explain and defend to customers.
Data Inputs You Need (and How to Prepare Them)

You need three layers of transaction data. Layer 1: quote-to-cash data from ERP (transaction date, customer ID, product, list price, quoted price, invoice price, discount %, rebates, freight, payment terms). Layer 2: deal context from CRM (deal size, competitive threat noted, competitor names, rep and manager, deal stage, close date, approval flags). Layer 3: customer attributes (segment tier, annual contract value, lifetime value, product concentration).
Export the data into a single analytical table, with one row per transaction. This forms your foundation.
Segmentation requires clean master data: customer size (annual revenue, employee count), industry, geography, strategic importance tier, and relationship age. For products: category, complexity, competitive position, and margin target.
Cost-to-serve is the variable most missed. For each major product line or segment, estimate fulfillment cost (labor, warehousing, shipping), installation and onboarding labor, support and SLA costs, and retention costs (CSM, renewal work). Enterprise support costs 4-5% more than SMB. This should inform your floor-setting logic.
Identify key constraints, including capacity, lead times, and minimum order quantities. For example, aggressive discounting at 95% utilization can erode profitability, and small orders should include price uplifts.
Setting Price Floors and Discount Guidance That Sales Will Follow

You have three floor options. Cost-plus (COGS × markup): easy to understand, ignores cost-to-serve. Contribution margin (COGS × target contribution %). Pocket margin (COGS + cost-to-serve × target profit margin)—most realistic but requires detailed data.
Pocket margin is recommended. Define discount bands as follows: Green (0-5%, sales representative, automatic), Yellow (5-10%, manager, 24-hour SLA), Orange (10-15%, pricing council, 48-hour SLA), and Red (>15%, VP+ with give-get, 72-hour SLA). It is important that your sales team understands why a 12% discount requires approval while an 8% discount does not.
Adjust discount bands based on competitive intensity. In markets with high price pressure, widen the Green band to 0-8%. In less competitive markets, narrow it to 0-3%.
One manufacturer implemented strict price floors on its top products and saw a 2.3% revenue increase in Q1 with zero volume loss — proof that floors protect margin without killing deals. This outcome, drawn from Revology’s 2025 Maturity Report, is typical when governance is clear.
Handle special cases: new logos can earn higher authority (12% vs. 8%) because acquisition economics justify it. Renewals should be lower than new logos (customer is captive).
Governance and Approvals: Designing Exception Paths
Build an approval matrix mapping discount %, deal size, and customer tier to authority and SLA. Example: 0-5% any size = rep approval, immediate. 5-10% under $100K, mid-market/SMB = manager approval, 24 hours. >15% any = VP+ approval, 72 hours.
Establish turnaround SLAs. If a pricing manager cannot respond within 24 hours, automatically escalate the request to the next approval tier. This approach maintains deal momentum while protecting margins.
The accountability gap is real: only 23.1% of organizations link pricing KPIs to sales compensation, even though 56.4% have segment-level pricing goals. This gap between intent and accountability is the #1 systemic problem, per Revology’s 2025 RGA Maturity Report. Without compensation alignment, even the clearest policy will erode.
Without analytical rigor, companies frequently over-discount based on emotional appeals or unfounded volume hopes. Discounting inelastic demand destroys value—lowering prices erodes margins without a meaningful increase in volume. Require documented justification for every exception: competitive threat (with quote comparison), customer strategic value (LTV, expansion, logo prestige), give-get (what do we ask for?), margin impact (below floor by how much?). This creates an audit trail and forces rigor into decision-making.
Commercial Terms Policies That Materially Impact Realized Price
Most organizations focus on list price and invoice discounts, often overlooking commercial terms that can have a greater impact.
Net 30 standard to net 45 offered costs a 0.2% discount equivalent (financing carry). Net 60 costs 0.4%. Build into policy: reps can offer net 45 without approval, net 60 requires manager sign-off.
Free freight to customers under 50 units annually means absorbing $50-200 unit margin. Policy: under 100 units = FOB origin (customer pays), 100-500 = FOB destination with expedited cost, over 500 = free freight.
Implementation labor is big: a week of labor swings 3-7% margin on smaller deals. Policy: standard implementation included for deals ≥$50K; additional labor billable at $/hour; under $50K, go self-serve or purchase separately.
Service add-ons (24/7 support, priority queue, dedicated CAM) are real costs. Policy: standard 8×5 included, premium 24/7 = +5% adder, dedicated CAM = +3%, no mix-and-match stacking discounts.
Rebates and MDF are leakage sources if untracked. Solution: define rebate tiers clearly, show estimated rebates in quotes (pending achievement), set a total discount cap (invoice discount + rebate + MDF cannot exceed X%), and track all three in CPQ, not in Excel files.
On multi-year contracts, the default escalator should be 2% annually. If the customer objects, the floor is 1%. On renewals, target 3-5% increase (inflation, cost creep, usage gains).
KPIs to Monitor Pricing Policy Strategies Effectiveness
Pocket margin = (net price – COGS – cost-to-serve) / list × 100. Target 28-35%. Monthly by product and segment.
Net price realization = actual net price / guidance net price × 100. Target >95%.
Exception rate = (quotes below floor / total quotes) × 100. Target <3%. Spike from 2% to 8%? Something changed.
Approval cycle time = average days from submission to approval. Target 24-48 hours.
Override frequency = (approved exceptions / total exceptions) × 100. Target 60-70%. Above 90% means your floor is too tight.
Win rate by segment. Should not materially change post-policy.
Common Pitfalls (and How to Avoid Them)
Overly complex rules hinder policy compliance. Aim for 5-7 rules that can be explained in a single meeting. Excessively detailed guidelines, such as large matrices with numerous rules, confuse sales teams, increase pricing errors, and encourage unauthorized workarounds.
A global lighting supplier discovered that off-invoice deductions had reduced the pocket price to roughly 50% of the list price, with small buyers receiving massive, unwarranted discounts. After implementing stricter discounting rules and IT systems for net price tracking, average pocket prices rose 3.6% and operating profits jumped 51% within one year. This outcome, from Revology’s case library, illustrates the profit power of disciplined governance.
Rewarding sales on revenue and finance on margin creates structural conflict. To address this, show sales representatives the margin for each deal. Implement tiered incentives (for example, full commission for margins above 30%, 80% for 28-30%, and 60% for 26-28%). Integrate a deal desk so representatives can discuss strategy before meeting with customers.
The biggest mistake: treating all customers the same. A $100 deal mid-market costs $8 to fulfill. Enterprise with 24/7 support costs $18. Different segments need different floors and discount bands.
Worked Example: Building a Pricing Policy for a B2B Manufacturer
Company: $100M revenue, 38% gross margin, three product tiers, three customer segments (OEM 60%, mid-market 30%, SMB 10%).
Baseline waterfall (90 days): List $100, invoice discount -$8, rebates -$3, freight -$2, payment terms -$2, net price $85, COGS -$50, cost-to-serve -$7, pocket margin $28.
Dispersion: OEM averages $86 (14% discount, $78-$95 range), mid-market $84 (16%, $75-$92), SMB $82 (18%, $65-$90). SMB has a 25% range backward. It should have a lower average but a tighter band.
Policy design: OEM list: $100, floor: $88 (cost-to-serve: $9); mid-market list: $100, floor: $85 (cost-to-serve: $7); SMB list: $100, floor: $80 (cost-to-serve: $5).
Discount bands: OEM auto-approves 0-5%; manager 5-10%; pricing council 10-15%; VP+ >15%. Mid-market: rep 0-5%, manager 5-10%, pricing 10-15%, VP+ >15%. SMB: rep 0-5%, manager 5-10%, pricing 10-15%, council >15%.
Commercial terms: OEM >$500K annually gets net 45 + free freight. Mid-market >$100K gets net 45 allowed. SMB standard terms only.
Expected impact: Pocket margin 28% to 30%, net price realization 85% to 87%, discount rate 15% to 13%. Incremental gross margin $2M on $100 base. Expected operating profit gain ~$1.6M.
Implementation Roadmap (30-60-90 Days)

- Weeks 1-2: Export 6-12 months of transaction data. Identify data quality gaps. Calculate price waterfall and dispersion. Interview stakeholders.
- Weeks 2-3: Find the bottom 5% of deals (deepest discounts). Inspect. Spot deals below variable cost. Flag untracked rebates and term expansions. Targeted pricing quick wins typically deliver a 1-3% net price improvement almost immediately, with a 1-2 percentage-point EBITDA boost within months, per Revology’s 2025 Maturity Report.
- Weeks 3-4: Implement soft floor in CPQ: flag (don’t block) quotes below floor. Route flagged quotes to the pricing manager. This is an interim guardrail, buying time for the final policy.
- Weeks 5-6: Finalize segment definitions, list prices, discount bands, and approval matrix. Document in a one-page cheat sheet. Build FAQ.
- Weeks 6-7: Pilot in one region or product line. Daily check-ins. Address pushback in real-time.
- Weeks 7-8: Train sales, deal desk, and finance on policy. 30-minute sales overview repeated 3 times. Deal desk gets exception approval guidance. Finance learns the KPI dashboard.
- Weeks 9-10: Roll out to remaining regions/product lines. Expect a 10-15% exception rate in weeks 1-2; normalizes to 2-3% by week 4.
- Weeks 10-11: Establish monthly pricing council (exceptions, drift, policy adjustments), bi-weekly deal desk office hours, weekly KPI review. A $150M mid-market distributor implemented a “Margin Stabilizer” governance system — deal desk workflow, reason codes, price floors, weekly pricing cadence — and improved gross margin by 120 basis points within 8 weeks.
- Weeks 11-12: Collect sales feedback. Refine policy based on data. Document v2 by quarter-end.
Tools and Operating Cadence to Sustain the Policy
Pricing policy is an operating model, not a one-time project.
Configure your CPQ to enforce policy: hard block or soft-flag discounts below the floor, auto-route approvals (8% → manager, 12% → pricing council), and capture required justification fields.
Build a simple pricing calculator (Google Sheets or Power BI) that displays the segment list price, recommended discount, floor, and authority level. Embed in Slack or shared drive.
Establish a deal desk (even one person). Responsibility: adjudicating exceptions, documenting rationale, escalating to council. Weekly stand-up on Tuesday plus ad-hoc for mega-deals.
Monthly pricing performance review (first Thursday): KPI dashboard, exception trends, win/churn by segment, quarterly policy adjustments. Attendees: CFO, Chief Pricing Officer, VP Sales, VP Finance. 45 minutes.
Exception retrospective (monthly, after close): Was the exception justified? Did the customer deliver on promised value? What did we learn? Prevents policy erosion.
Quarterly training: 30-minute onboarding for new hires, 15-minute refresher if policy changed, 60-minute workshop if major overhaul.
Sales playbook: scenario guides (“Customer asks for 18% discount—what do I do?”), FAQs (“Why can’t I offer 20%?”), competitor playbook.
Monthly communications: post KPI results in Slack, celebrate margin wins, acknowledge tradeoffs. “We tightened OEM bands. Expect a 2-3% short-term impact on win rate. Margin protection is worth it.”
FAQ: Pricing Policy Strategies
1. What are pricing policy strategies? Operational frameworks translating pricing strategy into rules, guardrails, and approval workflows. Define what price you quote, who authorizes discounts, how to handle exceptions, and how to track compliance. Unlike a strategy (directional), policy is executable.
2. What is the difference between strategy and policy? Strategy answers: where to win, what you’re worth, and competitive positioning. Updated annually. Policy answers: what rules let you execute the strategy consistently? Updated monthly or quarterly.
3. What makes a pricing policy enforceable? Four things: clarity (simple enough for reps to understand without ambiguity), system enforcement (encoded in CPQ, not just in PDF), visibility and accountability (every exception logged, approvals transparent), and regular auditing (monthly reviews of exception patterns).
4. How do you set discount authority levels? Start with the current state (what % of deals at each discount level). Set segments (Enterprise vs. SMB different economics). Align authority to role (rep 0-5%, manager 5-10%, council >10%). Run sensitivity (how much faster/slower if you adjust?). Set clear thresholds, not vague criteria.
5. What is a price floor, and how is it used? Absolute minimum price for a product. Defined as cost-plus, contribution margin, or pocket margin. Used in CPQ (hard block or soft flag), deal desk logic (exceptions need give-get), and audit (monitor exception rate for policy drift).
6. How do you handle competitive price matching? Require actual competitor quote (PDF/email, not anecdotal). Validate feature parity. Consider a 75-80% match if the competitor is truly cheaper but less capable. Create a competitive match band (one-level authority bump for documented threat). Set frequency threshold (if >30% of deals claim threat, you have a bigger problem).
7. Which KPIs best measure compliance? Exception rate (% outside policy, target 2-5%), approval cycle time (target <2 days), realized price compliance (% hitting guidance net price, target >90%). Bonus: override frequency (60-70% healthy, >85% too lenient, <40% too tight).
8. How do you prevent “exception creep” over time? Monthly exception review (spot patterns), quarterly policy audit (check realized net price drift), declining exception budgets (5 in Q1, 4 in Q2, 3 in Q3), visibility (publish weekly exception counts), escalating justification (first exception brief email, fifth requires formal case), and compensation clawbacks.
9. Should policies differ by channel (direct, distributors, e-commerce)? Yes. Direct: You set floors and authority. Distributors: specify the distributor list price (30-40% off your list), the distributor margin floors (e.g., never below 25%), and the rules on who absorbs end-user discounts. E-commerce: fixed tiered pricing, no bespoke negotiation, minimum order values. Each channel has different economics—policy should reflect.
10. What is the fastest way to implement pricing policies without a new tool? You don’t need tools. You need a process. Data audit, quick policy design, soft enforcement, validation, and monthly auditing using Google Sheets, Slack, and email.
Pricing policy is the operating system for pricing execution. To start your diagnostic, assess data, governance, guardrail, and KPI maturity. Most organizations score 2 of 4.
Revology’s proprietary RGA Maturity Scorecard evaluates your capabilities across four core pillars using a four-tier assessment. The Outcome-Based Analytics™ Framework delivers a minimum viable analytics product within 30-120 days, while the Pricing Council governance model establishes cross-functional discipline.
For help designing your pricing policy, see our pricing and revenue growth management approach. We’ve helped dozens recover 150-400bps of margin.
For deeper context, explore implementing value-based pricing strategies, pricing strategies to counter tariff impacts, competitive analysis, and 2026 pricing best practices, smart pricing and revenue growth management, and price optimization strategies, tools, and best practices.
Pricing policy is the operating system for pricing execution. Done well, it protects margins (3-5% improvement), accelerates deals (fewer negotiations), and aligns your organization (sales, finance, ops) toward shared KPIs.
Companies that win pricing are not those with the most sophisticated AI or analytics platform. They’re those with clear policies, transparent decision-making, and monthly margin accountability.
Start now. You don’t need perfect data or new tools. You need clarity on where you compete, what margin you need, and rules that let your team execute with speed and discipline.
Your margin is there. The policy is how you keep it.