A practical guide to pricing B2B solutions based on quantified customer outcomes—with worked examples, formulas, and an implementation roadmap.
What does customer value-based pricing mean

If your analytics solution helps a distributor reduce margin leakage and improve annual gross profit by $500,000, you have something quantifiable to work with. Instead of cost-plus markup, you can anchor a defensible price to that verified value, adjusted for risk, alternatives, and implementation costs. The usual B2B path: identify the economic impact for the buyer, quantify the value drivers, compare against their next-best option, and set a price that lets them keep a meaningful share of the benefit.
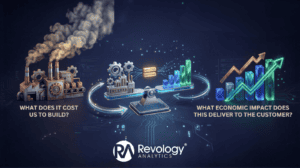
This flips the traditional pricing question on its head. Instead of “What does it cost us to deliver?” or “What are competitors charging?” you start with “What is this customer worth to us?” The answer lives in measurable outcomes: revenue gained, costs avoided, risks reduced, time freed up, working capital released. When you tie price to these outcomes, it becomes defensible. It’s no longer a number on an invoice—it’s a fair share of value created.
Definition and plain-English explanation
DEFINITION: Customer Value-Based Pricing
Customer value-based pricing starts with what customers perceive and can quantify as value, then converts that into a price corridor that’s defensible. In B2B, the process typically involves: 1. Identifying the economic impact for the buyer, 2. Quantifying the value drivers (revenue, margin, time, risk, working capital) 3. Comparing against their next-best alternative 4. Setting a price that lets the customer retain a clear share of the upside
Unlike cost-plus pricing (supplier cost plus margin), value-based pricing starts with buyer benefit. Unlike competition-based pricing (matching competitor prices), it anchors to the customer’s specific economics.
Here’s the straightforward case for it: if you can quantify the economic benefit a customer gets, you can defend a price that captures part of that benefit while leaving them with clear ROI. This works in B2B because business buyers understand financial justification. They speak margin improvement, revenue lift, payback period. A CFO or procurement leader approving a $150,000 software investment will ask for the financial return. Value-based pricing gives you the numbers to answer that.
How it differs from cost-plus and competition-based pricing
Cost-plus pricing is simple: calculate supplier cost, add a margin percentage, and done. If it costs $60,000 to build and support a solution, add 50% margin and price it at $90,000. The customer’s actual benefit is irrelevant.
Competition-based pricing mirrors what competitors charge. If three rivals price at $95,000, you price at $95,000 or undercut to $85,000. The customer’s specific situation doesn’t matter.
Value-based pricing inverts this. You ask: “What are this customer’s actual economics?” A distributor losing $500,000 annually to pricing leakage has a much different willingness to pay than one losing $50,000. A manufacturer facing a supply-chain crisis has a different urgency than one with stable suppliers.
Operationally, this matters. Cost-plus answers “Can we profit?” Value-based pricing answers “Can we defend this price?” The second is harder. It requires evidence, segmentation, and discipline.
When value-based pricing actually works in B2B
Value-based pricing works when three things line up: the economic impact is measurable, the customer can perceive and quantify it, and the problem is material enough to drive buying behavior.
In B2B, this covers a lot of ground. Enterprise software, managed services, consulting engagements, industrial equipment, SaaS platforms—all create measurable value. The key difference from consumer markets: B2B buyers demand proof. They want case studies, ROI calculators, and transparent assumptions. A consumer buys on brand or feeling. A procurement leader has to justify the spend internally, so your pricing needs to be anchored in data they can defend.
Value-based pricing falls apart when the impact is speculative, the buyer can’t measure it, or the problem isn’t significant enough to warrant attention. Selling a $2,000 feature to a customer managing thousands of features? The value is real but too small to measure. Selling to a buyer who doesn’t control the financial outcome (like a coordinator buying on behalf of someone else)? The value is abstract.
Why customer value-based pricing matters

Here’s what’s at stake: most B2B companies leave money on the table because they price conservatively, chase volume over margin, or fail to enforce price discipline across the organization. Value-based pricing isn’t a tactic for luxury brands. It’s an operational necessity if you want to grow profit.
Margin expansion without raising prices across the board
Blanket price increases create risk: customer backlash, competitive vulnerability, potential volume loss. Value-based pricing sidesteps this by grounding prices in customer-specific benefit. A customer who values your solution at $500,000 in benefit won’t feel gouged at $150,000. A customer seeing minimal benefit doesn’t need to pay high. You’re capturing different value from different customers—defensible segmentation, not arbitrary increases.
This precision matters operationally. You hold price where value is high, adjust packaging for lower-value customers, and focus sales effort on high-value segments. You grow margin per customer, not just margin per unit sold.
Better price realization and discount control
Price realization is the gap between the list price and what you actually capture after discounts, rebates, and concessions. Many companies list at $100,000 but net $85,000 because sales teams discount to close deals. According to Revology’s research of 2,000 global companies, a 1% improvement in price realization produces a 6–7% lift in operating profit. Excluding highly regulated industries, that figure jumps to 10–11%. (Source: “Pricing Still Packs a Punch,” Revology Analytics, June 2025.)
Value-based pricing strengthens price realization by giving your sales team defensible talking points. (For a deeper dive into implementing value-based pricing strategies, see our companion guide.) When a customer asks for a discount, the salesperson shows the ROI model, the quantified value created, and why the price is fair. The conversation shifts from “Your price is too high” to “Here’s why this is fair.” Not every customer will accept it, but more will. Those who can’t see the value will self-select out.
Governance matters too. Without a structured pricing framework, discounts happen ad hoc, exceptions pile up, and no one’s accountable. (See also: recapturing value through strategic price customization.) Value-based pricing creates room for guardrails: “We discount below $X only when the value driver changes or risk profile shifts.” That protects the deal economics and your bottom line.
Stronger alignment between product, sales, and finance
Most companies suffer from misalignment. Product wants to launch features. Sales wants flexibility to close deals. Finance wants to protect the margin. Each team optimizes for different KPIs and pulls in different directions. Value-based pricing creates a shared language and shared incentive: quantified customer value.
When a product understands which economic drivers matter to customers, they prioritize features that move those drivers. When sales understands the link between value quantification and price defensibility, they focus on customers where value is real and talk about economics, not feature counts. When finance sees price anchored to customer benefit, they can approve discounts with confidence. The framework creates alignment.
The core terminology leaders should know

Willingness to pay, economic value, and perceived value
Willingness to pay (WTP) is the ceiling—the maximum price a customer will accept. It’s not what they prefer to pay; it’s the point beyond which they walk away. WTP reflects perceived benefit, alternatives, and budget constraints.
Customer economic value is the quantified financial benefit from choosing your offer over the next-best alternative. If your solution saves a customer $500,000 per year and their current workaround saves $0, you create $500,000 in economic value. This is objective. It’s the difference in outcome.
Perceived value is what the customer believes the benefit is, whether they’ve quantified it or not. They may think your solution is “much better” without attaching a dollar figure. Perceived value is subjective; economic value is measured in business impact.
A strong pricing strategy translates perceived value into economic value. You move the customer from “This seems useful” to “This will save us $500,000 per year, so we recover our investment in 2.4 months.” That translation is where pricing power lives.
Price metric, value metric, and packaging
A price metric is how you bill: per license, per year, per transaction, per unit of usage. A value metric is the unit the customer cares about—the outcome they’re optimizing for. For a pricing analytics solution, it’s margin improvement or profit recovery. For a logistics platform, it’s the cost per mile or shipments handled.
The best business models align price metric with value metric. If the customer values margin improvement, price on margin improvement (or at least on the volume that drives margin). If they value shipments handled, price per shipment. When these are misaligned, customers resist because they feel overcharged relative to the benefit.
Packaging is bundling features and value into tiers. A basic tier might capture 40% of value at 60% of price. A premium tier captures 80% of value at 85% of price. Tiering lets you segment customers by how much value they can extract—sophisticated teams can implement more features and will pay more.
Segmentation, fences, and price corridors
Segmentation divides customers into groups with distinct willingness to pay and value realization. A $2 billion enterprise has different economics and value extraction capability than a $200 million mid-market firm. Segmentation lets you price differently across these groups defensibly.
Fences are the features or terms that prevent low-willingness-to-pay customers from buying the high-value package. A basic tier might have usage limits, lower support SLA, or delayed features. These aren’t arbitrary gatekeeping; they’re honest representations of different values. A customer with 10,000 SKUs values inventory management differently than one with 500 SKUs.
A price corridor is the range from floor to ceiling. The floor is your cost (below which you don’t survive). The ceiling is the economic value to the customer (above which they won’t buy). The defensible corridor sits in the middle: above cost but below ceiling, justified by customer economics. A typical B2B value-based pricing corridor captures 20–30% of quantified economic value, leaving customers with 70–80% of the benefit.
Worked example: A distributor’s pricing problem and solution

Let’s walk through a realistic scenario: a mid-market specialty chemicals distributor with a pricing and margin problem.
The setup
Company profile: Acme Specialty Chemicals distributes industrial chemicals to 200+ manufacturing customers. Annual revenue: $120M. Gross margin: 18% (baseline).
The problem: Sales teams discount heavily to win deals. The company lists at a standard margin (cost × 1.5 on average). Sales reps frequently discount 10–25% to close. Results:
- List price average: $50,000 per contract
- Average selling price (ASP): $42,000 (16% discount on average)
- Estimated annual discount leakage: $1.6M across 400+ deals
Pricing is also a by-product, not by the customer. Similar volume customers pay similar prices, regardless of whether one has sophisticated procurement (less work, less cost to serve) or not.
Quantifying the problem
Acme conducted 10 customer interviews across large, mid-sized, and small accounts. Key findings:
Time and effort savings: Large customers with procurement teams estimated that Acme’s on-demand, pre-negotiated pricing (versus calling three competing suppliers) saves 5–10 hours per month. At $60/hour blended rate, that’s $3,000–$6,000 annually per large account.
Margin improvement: Switching to Acme from a less reliable supplier means avoiding stockouts and emergency sourcing costs. Estimated value: 0.5–1.5% of annual chemical spend. For a $5M annual spend customer, that’s $25,000–$75,000 in avoided costs per year.
Reliability and risk reduction: Acme’s 98% on-time delivery beats competitors’ 85–90%. One prevented delay per year, at 10% probability, is worth $2,500–$5,000 in risk reduction per customer (depending on production size).
Total quantified value per large account: $30,500–$86,000 per year.
Acme’s cost to serve a large account (dedicated support, logistics, inventory) is roughly $8,000 per year. A defensible price might be $20,000–$45,000 per year (capturing 25–50% of $86,000), compared to their current $18,000–$22,000.
Mid-size accounts have lower complexity but still represent $15,000–$30,000 in quantified value. Small accounts: $5,000–$15,000.
Building the pricing model
Acme built a simple model:
| Customer Segment | Annual Spend | Quantified Value | Cost to Serve | Recommended Price | Current Price | Upside |
| Large (>$4M/yr) | $5M | $86,000 | $8,000 | $32,000–$40,000 | $20,000 | $12,000–$20,000 |
| Mid ($1M–$4M/yr) | $2.5M | $35,000 | $5,000 | $12,000–$18,000 | $13,000 | $0–$5,000 |
| Small (<$1M/yr) | $300K | $8,000 | $2,000 | $3,500–$5,000 | $4,000 | $0–$1,000 |
Large accounts were significantly under-priced. Acme was capturing only 20–30% of value instead of the defensible 40–50%.
Pilot and rollout
Acme piloted with 5 large accounts:
- 2 existing customers: Re-negotiated at new price points ($35K and $32K). Both were accepted after Acme walked through the value analysis and showed they were still saving $40K+ annually.
- 2 prospects: New value-based pricing quotes. Both responded positively, with one noting, “Your price is fair because I can see exactly where the value comes from.”
- 1 existing customer: Resisted higher pricing due to budget constraints. Acme held firm. The customer didn’t renew. Post-sale research showed this was a low-value account anyway (small spend, high support needs). Loss was acceptable.
Pilot win rate: 80% (4 of 5). ASP on closed deals: $34,000 (versus baseline $20,000). Price realization improved significantly.
Over the next 3 months, Acme rolled out tiered pricing across all segments. After 6 months:
- ASP: $24,000 (up from $18,000; +33%)
- Discount leakage: Down to 8% from 16%
- Win rate: 72% across all segments (slight decline from prior 78%, but acceptable given higher prices)
- Gross margin recovered: ~$2.1M annually from price increases and discount reduction
- Retention: 94% (up from 91%), suggesting customers see the value
Lessons from the example
Acme moved from arbitrary discounting to defensible, customer-specific pricing anchored in real economics. The pilot proved the value of the story before rolling out organization-wide. Results show that capturing a defensible share of quantified value is possible and profitable without damaging customer relationships.
The pricing playbook: how to quantify value

The most critical skill in value-based pricing is identifying and quantifying customer value. Here’s how.
Quantifying the 5 main value drivers
Value creation in B2B typically comes from five sources. Identify and quantify each:
1. Revenue uplift: The solution helps customers sell more, enter new markets, or increase wallet share. Quantify in dollars of incremental revenue. Example: “An e-commerce platform lets a retailer launch a new channel, driving $2M in new revenue year one.”
2. Cost reduction: The solution reduces the cost of goods sold, operating expense, or customer acquisition cost. Quantify as dollars saved annually. Example: “A logistics optimization tool cuts shipping cost by 8%, saving $400K per year for a mid-size distributor.”
3. Risk reduction: The solution reduces financial or operational risk. Estimate the probability of a negative outcome and its cost, then multiply. Example: “A supply-chain visibility platform prevents one $5M disruption at 20% probability = $1M risk value.”
4. Time savings and working capital release: The solution frees up cash or staff capacity. Quantify time as labor cost or cash as a percentage of working capital. Example: “A procurement platform cuts invoice-processing time by 30%, freeing $200K in FTE capacity annually.”
5. Strategic value: The solution enables a capability that competitors lack. Harder to quantify but still important. Example: “A customer-analytics tool lets a company move from reactive to proactive pricing, creating competitive advantage.”
Estimate across all five drivers for each customer. Sum them for the total quantified value.
Using financial metrics to build credibility
Prove value, don’t just state it. Use financial metrics buyers understand:
Payback period: (Total implementation + first-year cost) ÷ First-year benefit = X months. Example: ($150K implementation + $100K annual fee) ÷ $500K benefit = 5 months. Fast payback is credible.
Return on investment (ROI): (Annual benefit − Annual cost) ÷ Annual cost = X%. Example: ($500K benefit − $100K cost) ÷ $100K = 400% ROI. Buyers respond to strong ROI numbers.
Net present value (NPV): The present value of all future cash flows minus upfront cost. Positive NPV means it’s worth doing. Calculating over five years captures long-term value.
Total cost of ownership (TCO): All costs of your solution plus the customer’s implementation and operational costs, summed over a time horizon (usually 3–5 years). Example: If implementation is $200K, annual costs are $100K, and training is $50K per year, then three-year TCO is $200K + (3 × $100K) + (3 × $50K) = $650K.
Use these metrics to show that your price isn’t a cost—it’s an investment with measurable returns.
Discount leakage and exception rate
*Discount Leakage = (List Price − Average Selling Price) / List Price × 100%*
If the list price is $125K and the ASP is $106K, the leakage is 15%. Track it closely. It should decline over time as your value story strengthens and your team gains confidence.
*Exception Rate = Discounts Below Approval Threshold / Total Deals × 100%*
Set a guardrail (e.g., “no discounts below $110K without VP approval”). Track how often it’s breached. High exception rates signal weak governance. Low rates signal your team is holding discipline.
Both metrics should improve within 6–12 months of launch. If they’re flat or worse, your value story isn’t working or your sales incentives aren’t aligned.
Revenue, gross margin, and retention impact
Ultimately, pricing changes must improve P&L. Track:
- Total contract value (TCV) by segment
- Gross margin per customer (is margin actually improving, or are discounts offsetting gains?)
- Customer retention rate (are customers happy with the value delivered?)
- Net revenue retention (are customers expanding or contracting?)
A pricing change that improves ASP but tanks retention is a failure. A change that holds win rate, improves margin, and increases retention is a success. Use these metrics to calibrate your corridor over time.
Common pitfalls and how to avoid them

Confusing internal cost with customer value
The mistake: A vendor calculates $60K to build and support the solution, adds 50% margin, and prices at $90K. The customer’s economic benefit is $500K. The vendor just left $410K on the table.
How to avoid it: Calculate cost to serve (use it as a floor). Calculate customer economic value (use it as a ceiling). Price in the middle. Cost informs sustainability; customer value informs defensibility. Low customer value? The deal may not be worth pursuing. High cost relative to value? You need to reduce cost or expand value, not erode pricing.
Using one price for all segments
The mistake: You set a single price of $125K that works for your target segment (mid-market distributors, $50M–$200M revenue). A larger distributor with $500M revenue and 15 times the value extraction capability pays the same. A smaller distributor with $20M revenue and half the benefit also pays the same.
The large distributor gets a bargain; you leave money on the table. The small distributor feels overpriced and doesn’t buy. You’ve optimized for your target but sub-optimized overall.
How to avoid it: Segment by willingness to pay and value realization. Create tiered pricing that reflects different economic benefits. Use value metrics that scale with the customer (e.g., pricing based on margin improvement percentage, not fixed price). Test pricing with small cohorts before rolling out across your full market.
Ignoring discount management and sales incentives
The mistake: You establish a value-based price of $125K. But your sales compensation is based on revenue, not profit or price realization. Sales finds it easier to close at $100K than to justify $125K. Over time, ASP declines to $105K, and your initiative becomes irrelevant.
How to avoid it: Align incentives before launch. Compensate sales on ASP and deal margin, not just revenue. Build approval guardrails (e.g., no discounts below $110K without VP sign-off). Provide sales with tools (value calculator, case studies, ROI models) that make value-based selling easier. Celebrate wins at full price; don’t celebrate discounted deals.
Overcomplicating the model before proving adoption
The mistake: You build a complex, multi-variable model accounting for 47 customer attributes, implementation factors, and competitive scenarios. You spend 6 months on it, then launch with rules your sales team doesn’t understand and can’t explain to customers.
Result: Sales ignores the model, prices on gut feel, and your initiative fails.
How to avoid it: Start simple. Use a single value driver (e.g., “margin recovery in thousands of dollars”). Create a simple formula: Price = Value ÷ 4. Test with 5–10 customers. Gather feedback. Refine. Add complexity only after proving the basic model works.
Overestimating the value that customers will actually realize
The mistake: You build projections assuming perfect execution. The customer implements all recommendations perfectly, trains all staff, and achieves 100% of the estimated value. Reality: Implementation is messy, adoption is partial, and only 70% of the estimated value is realized.
Customers feel the gap. They paid for $500K of value but got $350K. They churn or demand credit.
How to avoid it: Model the most likely scenario, not the best case. Include implementation friction (ramp time, change management, data quality issues) in your value model. Tie pricing to outcomes where possible (success-based pricing). Track actual customer outcomes post-sale so you can calibrate your estimates with real data.
Value-based pricing vs other pricing methods

Understanding how value-based pricing compares to other approaches clarifies when to use each.
Cost-based pricing example and trade-offs
Cost-plus pricing is simple because you know your cost, you add a margin, and you have a price. Done in an afternoon.
Example: A manufacturer builds software. Development cost: $2M. Annual support: $500K. They have 20 enterprise customers, so $125K cost per customer annually. Add 50% margin. Price: $187,500.
Advantage: Simple to implement, ensures profitability, reduces internal debate.
Disadvantage: Ignores customer value. A customer saving $5M annually and one saving $500K annually pay the same price. You leave money on the table with the first and overprice the second. You may lose deals to more aggressive competitors, even with a better value proposition.
When to use: Early-stage companies with unknown customer value, or commodity products where customers are price-insensitive.
When to avoid: B2B solutions with measurable economic impact, software, or services where willingness to pay varies widely.
Competition-based pricing and when it helps
Competition-based pricing mirrors or undercuts competitor prices. If three competitors price at $150K, you price at $145K to be cheaper or $155K to signal quality.
Advantage: Pricing is anchored in market reality. You’re unlikely to be wildly out of line. Fast to implement (check competitor pricing, price accordingly).
Disadvantage: Ignores your unique value. If your solution is fundamentally better, you underprice. If inferior, you should be cheaper, but might not be. This works only if you and your competitors have equivalent value propositions (they often don’t).
When to use: Commodities, mature markets with transparent pricing, or situations where customer value is hard to quantify and customers use competitor pricing as a proxy.
When to avoid: When you have a differentiated value that competitors lack. You should capture that difference in price, not match their price.
Where dynamic pricing and discount strategy fit
Dynamic pricing adjusts price based on demand, supply, or customer attributes in real time. Airlines, hotels, and ride-sharing use it routinely (higher during peak demand, lower during off-peak). (For a real-world case study, see how a Fortune 500 retailer applied dynamic pricing.)
A discount strategy establishes rules for when you will/won’t discount and to whom. Examples: “10% off for annual prepayment” or “15% off for case study participation.”
Both complement value-based pricing, not replace it.
Dynamic pricing example: You’ve set a value-based price at $125K for mid-market distributors. Q4 (peak season)? Raise to $145K. Q2 (slow period)? Drop to $110K. Still anchored to value, but adjusted for demand elasticity.
Discount strategy example: Your list price is $125K. You offer:
- 15% discount for multi-year commitment (annual: $106K)
- 10% discount for case study participation
- 5% discount for early renewal
- Rare exceptions below $110K only with CFO approval
These discounts are rule-based and governable, not reactive ad-hoc cuts.
Implementation roadmap for commercial teams

Value-based pricing doesn’t happen overnight. It requires diagnosis, pilot, rollout, and ongoing governance. Here’s a pragmatic 90-day roadmap.
30-day diagnostic and hypothesis building
Week 1–2: Value hypothesis
- Identify your target segment (e.g., “mid-market distributors, $50M–$200M revenue”)
- Identify the key economic driver (e.g., “margin leakage from poor price realization”)
- Estimate: how much are customers losing annually? ($500K? $1M? $100K?)
- Document the estimate and your assumptions
Week 2–3: Customer research
- Conduct 5–10 customer interviews in your target segment
- Ask them to walk through the problem and quantify its cost (don’t lead; let them calculate)
- Collect pricing data from win-loss interviews: What did they pay competitors? What ROI did they expect?
- Gather data on current price realization and discount leakage
Week 4: Hypothesis refinement
- Synthesize interviews and data
- Refine your value estimate (is it $500K–$750K or different?)
- Identify the next-best alternative and its cost
- Estimate your share of value (15–30%?)
- Draft three price scenarios (conservative, target, stretch)
- Socialize with leadership and sales team
Deliverable: 2–3 page hypothesis document with value estimate, target segment, price scenarios, and evidence
60-day pilot with selected segments or offers
Week 5–6: Pilot design and enablement
- Select 3–5 customers (ideally: 1 closed deal, 1 in active negotiation, 1–2 prospects)
- Brief sales on the value-based pricing approach and talking points
- Create a one-page “value story” for your target segment (problem, economic impact, solution)
- Build a simple ROI calculator or value worksheet
- Draft customer presentation with value drivers and price options
Week 7–8: Pilot execution
- Introduce value-based pricing to pilot customers
- Document their reaction: Do they understand the value? Pushback on price? Why?
- Track win/loss: Did they buy? At what price? What decided it?
- Gather sales team feedback: Was messaging clear? Did the value story resonate?
Week 9: Pilot analysis and pivot
- Synthesize results: What worked? What didn’t?
- Did win rates meet expectations? Did customers validate your value estimate?
- Win rate >60%? You’re ready to scale. <40%? You need to refine (messaging, price, segment, or value hypothesis)
- Make final adjustments to messaging, pricing, or segment definition
Deliverable: Pilot summary (win/loss, customer feedback, price realization, refined pricing model)
90-day rollout across pricing, sales, and approvals
Week 10–11: Organization alignment
- Brief the entire sales team, sales leadership, customer success, and operations
- Establish pricing guardrails: What approvals are needed for discounts? What exceptions are allowed?
- Document approval workflow (e.g., “Discounts below $110K require VP Sales approval, below $100K require CFO approval”)
- Identify a pricing owner accountable for pricing discipline and the monthly review
Week 12: Sales tool rollout
- Equip sales with a value calculator, case studies (from pilot customers), and ROI templates
- Create sales training: How to discover customer value? How to present the value story? How to justify the price?
- Role-play pricing conversations with the sales team
- Establish a “war room” or Slack channel for real-time pricing questions
Week 13: Launch and monitoring
- Begin selling at new price points
- Track weekly: ASP, discount rate, win rate, price realization
- Hold weekly “pricing huddles” with sales leadership to review and troubleshoot
- Celebrate full-price wins; investigate discounts >15%
Deliverable: Completed rollout with trained sales team, approval processes, and first 30 days of live pricing data
Governance for ongoing price reviews
Monthly (ongoing):
- Review price realization and ASP by segment and rep
- Investigate unexpected discounts or exceptions
- Gather customer feedback on value and pricing
- Adjust guardrails as needed (if discounts are high, lower the escalation threshold)
Quarterly:
- Review win rate by segment and package
- Analyze churn: Are discounted customers churning more?
- Review actual customer value realization: Did customers achieve the value promised?
- Benchmark against external data (competitor pricing, market dynamics)
- Decide: Hold price, adjust up, or adjust down?
Annually:
- Conduct a full pricing strategy review
- Refresh customer research and value estimates
- Evaluate new segments or use cases
- Decide on next year’s pricing strategy
Governance owner: Establish a pricing committee (VP Sales, CFO, Head of Sales Operations) that meets monthly to review metrics and make decisions.
Tools, templates, and operating model considerations
Interview guide for customer value discovery
Use a structured approach to uncover economic value:
- Current state: “Walk me through your pricing process today. How do you make pricing decisions? Who’s involved? What systems do you use?”
- Pain points: “What’s not working well in your current process? Where do you lose time or margin?”
- Financial impact: “Can you estimate the cost? If you lost 1% of margin annually due to poor pricing, what would that be in dollars? $500K? More?”
- Alternatives: “How are you addressing this now? If we didn’t exist, what would you do?”
- Success metric: “How would you measure success if you solved this? Revenue increase? Margin improvement? Time savings?”
- Buying process: “Who would approve this investment? What ROI would they require? What payback period?”
Don’t ask “Would you pay $125K?” That’s a yes/no that doesn’t surface value. Instead, ask open-ended questions and let them describe the problem and cost. Then propose a solution and price anchored to their value.
Pricing calculator and quote guardrails
Build a simple calculator with three inputs:
- Annual revenue: $50M
- Current gross margin %: 20%
- Estimated margin improvement %: 1.2%
Output:
- Estimated margin recovery: $600K (= $50M × 20% × 1.2%)
- Estimated price range: $100K–$150K (assuming 17–25% share of value)
This is your sales tool. It transforms abstract value into quantified dollars. When customers enter their revenue and margin, they see “I could recover $600K.” That’s motivating. Suddenly $125K doesn’t seem like cost—it seems like a bargain.
Quote guardrails: Set boundaries on when discounts are allowed:
| Discount Range | Approval Required | Exception Conditions |
| List to 5% off | Sales rep (automated) | Standard discount for annual prepay |
| 5–10% off | Regional VP Sales | Multi-year commitment or case study |
| 10–15% off | VP Sales | Strategic account or pilot discount |
| >15% off | CFO | Rare; documented business case required |
These guardrails prevent margin erosion while giving sales flexibility for legitimate situations.
Approval workflows and exception management
Establish a formal pricing decision process:
*Approval workflow:*
- Sales rep enters deal in CRM with proposed price and discount (if any)
- System flags if discount exceeds rep’s authority
- Flagged deals route to approval queue (VP Sales, CFO, or both)
- Approver reviews: value story, customer segment, competitive context, customer lifetime value
- Approver approves or suggests a lower discount
- Deal proceeds or the sales rep follows up with the customer
*Exception management:*
- Document every exception (>15% discount)
- Categorize: strategic account, competitive loss prevention, pilot customer, price-sensitive segment
- Monthly review of exceptions with the pricing committee
- Adjust guardrails if exceptions are frequent (if 20% of deals need CFO approval, lower the threshold to reduce friction)
Without this process, pricing becomes ad hoc and unaccountable. With it, you balance flexibility with discipline.
Frequently asked questions
What is an example of customer value-based pricing?
A B2B supplier estimates that its solution creates $500,000 in annual profit improvement for a customer (through improved discount discipline and price realization) and prices the offer at $100,000 to $175,000 per year, leaving the customer with most of the value created ($325,000–$400,000 net benefit). This is defensible because the price is anchored to quantified customer economics, supported by data, and leaves the buyer with a clear ROI.
How would you explain value-based pricing?
Value-based pricing means setting the price based on the value the customer expects to receive, not from cost or competitor price. It requires three steps: (1) quantify what the customer will gain financially by choosing your solution over their next-best alternative, (2) decide what share of that value you will capture as price, and (3) communicate that value story clearly so the buyer understands why the price is defensible.
What is the formula for value-based pricing?
A simple formula: Price = Customer Economic Value × Supplier Share of Value, adjusted for risk, competition, and implementation costs. For example, if the customer’s economic value is $500,000 and you target 20% of that value, the base price is $100,000. If the implementation cost to serve is $40,000, you may adjust upward. This formula is more art than science because you must estimate the share that is both defensible and competitive.
What is customer economic value in B2B pricing?
Customer economic value is the quantified financial benefit a buyer gets from choosing one offer over the next-best alternative. For example, if a buyer can either implement your pricing analytics solution for $150,000/year or stick with Excel and lose $500,000/year to margin leakage, the economic value you create is $350,000 net benefit ($500,000 leakage minus your $150,000 price). This quantified difference is the starting point for a defensible value-based price.
How is value-based pricing different from cost-plus pricing?
Cost-plus pricing starts with the supplier cost and adds a margin (e.g., $60,000 cost + 50% margin = $90,000 price). Value-based pricing ignores cost as the starting point and asks: “What is the customer willing to pay based on the value they receive?” If that value is $500,000 in profit improvement, the supplier may charge $100,000–$200,000, regardless of whether the cost to serve is $20,000 or $80,000. Cost still matters for ensuring profitable margins, but it’s not the price anchor.
What evidence supports a value-based price?
Useful evidence includes: pilot results from early customers showing actual uplift, before-and-after economics comparing outcomes, case examples from peer companies, ROI models with explicit assumptions, win-loss insights revealing what customers paid competitors, and competitive comparisons showing how your value stands against the next-best alternative. Without evidence, a value story is just a claim.
What are the 4 types of pricing?
A common framework includes: (1) Cost-based pricing, which starts with supplier cost and adds margin; (2) Competition-based pricing, which mirrors or undercuts rival prices; (3) Value-based pricing, which anchors to quantified customer benefit; and (4) Dynamic pricing, which adjusts price in real time based on demand, supply, or customer attributes. Most sophisticated B2B companies blend all four, using cost as a floor, competition as a ceiling, and customer value as the anchor.
Does Coca-Cola use value-based pricing?
Yes. Coca-Cola prices are based on perceived brand value rather than production cost. The cost to manufacture a can of Coke is a fraction of the retail price; the premium reflects brand equity, distribution reach, and consumer willingness to pay. In B2B terms, Coca-Cola applies value-based pricing through channel-specific pricing tiers (convenience store vs. grocery vs. fountain), occasion-based packaging (single-serve at higher per-ounce price than multipacks), and promotional strategy that protects brand value. The principle is the same as B2B value-based pricing: anchor to what the buyer values, not what it costs to produce.
Does Starbucks use value-based pricing?
Yes. Starbucks charges a premium because customers value the experience, brand consistency, and convenience—not because the coffee beans cost more. A grande latte at Starbucks is priced well above the ingredient cost because the company understands its customers’ willingness to pay for ambiance, reliability, and customization. In B2B parallels, this is equivalent to pricing a consulting engagement based on the strategic outcomes it delivers rather than the hours invested. Starbucks also uses price segmentation (different prices by location, size, and customization), which mirrors the tiered value-based pricing approach we recommend for B2B.
Does value-based pricing work in B2B?
Yes, especially when the offer has a measurable economic impact, and the supplier can quantify and communicate that clearly. B2B customers buy on ROI and total cost of ownership, making value-based pricing effective for software, services, managed solutions, and equipment. The challenge is that B2B sales cycles are longer and require stronger evidence, so value-based pricing demands customer research, case studies, calculators, and sales discipline.
Key takeaways for executives
KEY TAKEAWAYS: Customer Value-Based Pricing
– Value-based pricing uses customer outcomes, not supplier cost, as the price anchor. – A defensible B2B price usually sits below the total quantified value created, so customers keep a measurable economic benefit. – The strongest value drivers are revenue lift, cost reduction, risk reduction, working-capital improvement, and time savings. – Practical implementation requires segmentation, value hypotheses, proof points, sales enablement, and discount governance. – Value-based pricing isn’t guesswork; it should be supported by customer economics, willingness-to-pay evidence, and competitive context. – **Revology research:** A 1% improvement in price realization produces a 6–7% lift in operating profit (10–11% in non-regulated industries). (Source: “Pricing Still Packs a Punch,” Revology Analytics, June 2025.)
Start with measurable customer outcomes
Don’t ask “What should we charge?” Ask instead, “What measurable outcome do we create?” Margin improvement, revenue gain, time savings, risk reduction. Then quantify it. Interview customers, analyze their financials, and build an evidence base. The number you arrive at—$500K in recovered margin, $2M in avoided costs—becomes your price anchor. It’s defensible because it’s real.
Build price architecture before broad rollout
Don’t use one price for all customers. Segment by value realization and willingness to pay. Create tiered offerings reflecting different customer economics. Pilot with a small cohort (3–5 customers) before rolling out organization-wide. Use real pilot results to refine messaging, pricing, and segment targeting. This discipline prevents costly mistakes.
Use KPIs to improve pricing over time
Track price realization, win rate, and customer outcome realization. Review monthly, adjust quarterly. If price realization is declining, sales is discounting too aggressively; strengthen guardrails or improve your value story. If win rate is low in a segment, you may be over-priced, or your value hypothesis may be wrong; test both. If customers aren’t achieving the promised value, your estimate is too optimistic; recalibrate and document the learning.
Value-based pricing is an operating discipline, not a one-time project. Your first pricing model will be 60% right. After six months of real-world data, 80–85% right. After a year, 90%+ right. Each quarter, you refine, learn, and improve.
Schedule Your Pricing Diagnostic
Value-based pricing is powerful, but implementation requires the right people, tools, and discipline. If you’re ready to move from cost-plus or competitive guessing to quantified, defensible pricing, Revology’s pricing diagnostic will help you assess your current state, identify your highest-value opportunities, and build a 90-day implementation roadmap.
Book a pricing & revenue management diagnostic call to get started today.