
A practical guide for pricing, revenue, and risk leaders on how demand responsiveness shapes price increases, discounting, promotion design, and margin management.
What Price Elastic and Inelastic Demand Means
Understanding price elastic and inelastic demand answers the question every pricing leader faces: when we change price, how much will volume respond? That answer determines whether a 5% price increase grows profit or kills margin. It shapes how you design discounts, run promotions, and forecast revenue. Yet many organizations make pricing decisions without a clear grasp of this concept, relying instead on intuition or competitor moves. That gap between understanding and action is where value sits.

Price elasticity of demand measures how much quantity demanded changes in response to a price change. Expressed as a coefficient, it quantifies the percentage change in quantity divided by the percentage change in price. An elastic product means quantity swings sharply when price moves. An inelastic product means quantity stays relatively stable. Think of elasticity as a sensitivity dial.
Three categories exist:
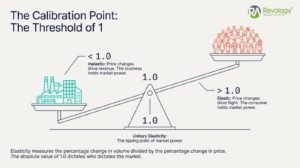
- Elastic demand (|elasticity| > 1): A 1% price increase triggers a quantity drop greater than 1%, so revenue falls. Customers care about price and will switch, reduce usage, or wait.
- Inelastic demand (|elasticity| < 1): A 1% price increase causes quantity to drop less than 1%, so revenue rises. Customers tolerate increases because substitutes are scarce, switching costs are high, or the product is essential.
- Unit elastic demand (|elasticity| = 1): A 1% price change produces a 1% quantity change in the opposite direction, leaving revenue flat.
Elasticity transforms how you think about trade-offs. If your product has inelastic demand, a 3% price increase could deliver 9% or 10% profit growth far outpacing the revenue bump. Conversely, elastic demand means that same 3% increase might shrink volume 4-5%, eroding both revenue and profit. For regulated industries and price-sensitive B2B markets, elasticity estimates can be the difference between sustainable pricing and destroying value or triggering regulatory pushback.
The Core Difference Between Elastic and Inelastic Demand
When price rises, quantity demanded falls. The question is by how much. Imagine two products: a premium branded beverage and a generic industrial chemical. Raise the beverage price by 10%, and customers might drop purchases by 15% because they shift to cheaper alternatives. That’s elastic behavior: quantity response outpaces the price change. Raise the chemical price by 10%, and industrial buyers might reduce orders by only 2% because the chemical is essential to their production process and switching suppliers is costly. That’s inelastic behavior: quantity is sticky.

The elasticity coefficient carries sign and magnitude. Since quantity moves opposite to price, the coefficient is negative (price up, quantity down). Analysts often report absolute value to simplify discussion: an elasticity of -1.2 becomes “elasticity of 1.2.” The threshold is 1. Exceed 1, demand is elastic. Fall below 1, demand is inelastic.
These thresholds have direct revenue implications. In elastic demand, raising price shrinks total revenue. Lowering price grows it. In inelastic demand, raising price grows revenue. Lowering price shrinks it. For a pricing leader, this is non-negotiable logic. A CFO who doesn’t internalize this boundary is making pricing moves in the dark.
The Price Elasticity of Demand Formula and How to Calculate It Correctly
The basic formula is simple:
Elasticity = (% Change in Quantity Demanded) / (% Change in Price)
If price rises from $100 to $105 (5% increase) and quantity falls from 1,000 to 950 units (5% decrease), elasticity is -1.0 (unit elastic). If quantity falls to 900 units (10% decrease), elasticity is -2.0 (elastic). If it falls to 975 units (2.5% decrease), elasticity is -0.5 (inelastic).

The formula is simple. The tricky part is gathering clean data and controlling for confounding factors so your number represents true price sensitivity, not market noise.
Use the midpoint method for accuracy. Two approaches exist: simple percentage change and the midpoint method. The midpoint method uses the average of the two points as the base, yielding the same elasticity whether price moves up or down. For small price changes (under 5%), both converge. For larger swings, use the midpoint method.
The biggest mistake is confusing correlation with causation. You observe higher prices coinciding with lower sales and conclude demand is elastic. But what if a competitor launched a product the same month? What if the company raised prices when demand was cooling? Properly estimated elasticity requires econometric discipline: controlling for competitor actions, seasonality, marketing spend, and supply-side shocks. A simple regression of price on quantity will mislead you almost every time.
Another critical error: using list price instead of realized price. If your list price is $100 but 40% of sales are discounted to $75, your realized price is $85. Customers respond to realized price. Running elasticity on list price inflates apparent inelasticity because you’re not capturing the full price variation customers actually face. Build a realized price waterfall before any elasticity analysis.
Why Price Elasticity Matters for Revenue and Margin
When a price increase grows profit:
If demand is inelastic, a price increase grows revenue and profit. A 5% price increase with only 2% volume loss grows revenue 3%. Margin per unit typically expands as well, so profit impact is even stronger. Research on 2,000 public companies by Revology Analytics shows that companies improving realized price by just 1% see a median 6–7% operating-profit gain, climbing to 10–11% in regulated industries.

A pharmaceutical company with a branded, on-patent drug faces inelastic demand. A 2% price increase drove 12%+ profit growth because volume barely budged. A software company with a sticky, mission-critical application can raise annual subscription fees 8% and retain 98% of the base because renewal elasticity is low. These wins are inelastic demand in action.
When a price cut destroys margin without lifting volume:
In an inelastic market, a 5% price cut might grow volume by only 2%, meaning revenue falls 3.3%. Your per-unit margin shrinks 5%, so profit falls faster. Many organizations fall into this trap during competitive pressure. A sales leader says, “We’re losing deals. Let’s cut price 10%.” In an inelastic market, that cut might grow volume 3%, eroding revenue 7% and profit far more.
We see this in the trenches repeatedly. Six months later, organizations realize they’ve lost 8% gross margin on a 2% volume lift. The damage is hard to reverse because customers anchor on the new lower price. This is why understanding elasticity before you act is not academic. It’s survival.
Portfolio effects matter too. If you offer Product A and Product B, raising the price of A might shift demand to B rather than destroying total volume. A software company prices the basic tier competitively (higher elasticity) to attract customers, then drives them upmarket to the premium tier (lower elasticity). Cross elasticity is the lever for portfolio architecture.
What Drives Demand Elasticity
Substitutes and switching costs. If your customer can easily switch to a competitor’s product, demand is elastic. If substitutes are scarce, demand is inelastic. A branded pain reliever with strong marketing faces lower elasticity than a generic because switching friction is higher. An enterprise software platform with deep integration has lower elasticity than point-solution software because the cost of switching—in time, training, and operational disruption—is prohibitive.

Necessity versus discretionary. Necessity products tend toward inelasticity. Food, medications, and utilities are needs. A 10% milk price increase doesn’t cause consumers to stop buying milk; they might buy less or switch brands, but quantity response is modest. Discretionary products tend toward elasticity.
Time horizon, budget share, and frequency. Short-term elasticity often differs from long-term elasticity. Customers may tolerate a short-term increase because switching takes time. Long-term, they adapt: they switch vendors, reduce usage, or find substitutes. Products consuming a large portion of the customer’s budget tend toward higher elasticity.
Brand strength, differentiation, and contract structure. Strong brands reduce elasticity. A beloved consumer brand can raise price without proportional volume loss because customers value the brand itself. Products with strong differentiation show lower elasticity. Contract structure shapes elasticity too.
Segment-Level Elasticity and Why Averages Mislead
Elasticity varies by segment. A company with an “average elasticity” of -0.85 might have elasticity of -0.4 for enterprise customers (low price sensitivity, switching costs high) and -1.5 for SMB customers (high price sensitivity, many alternatives). Using the company-wide average to price the enterprise segment leads to underpricing; using it for SMB leads to overpricing and volume loss.

Customer size drives elasticity differences. Larger customers have lower elasticity because they’re invested (workflows, training, integration) and switching is costly. Smaller customers have higher elasticity because they’re more nimble. Industry differences matter: financial services customers may be price-inelastic because regulatory compliance is tight; discretionary retail is price-elastic.
Contract versus spot purchases also vary: customers entering multi-year contracts face lower elasticity (they’re committing) than those making single purchases (they can easily try a competitor next time). Bundled, long-term agreements tend toward lower elasticity; modular, transactional purchases toward higher elasticity.
Practical Framework: Three Real Case Studies
Case 1 — Consumer Electronics (figures are illustrative):
A consumer electronics company analyzed 55 SKUs across 12 product families using 156 weeks of sellout data. They employed an ensemble of methods: Bayesian Ridge, Double ML, ElasticNet, and XGBoost, with empirical Bayes shrinkage. Results revealed stark segment differences:
- Consumer products (elastic, many substitutes): own-price elasticity -1.25 to -1.55. Promo response strong: +1.75 to +1.97.
- Prosumer products (unit elastic, fewer substitutes): -0.95 to -1.01. Promo response moderate: +1.25 to +1.55.
- Enterprise/specialty (inelastic, unique features): -0.92. Promo response weak: +0.62.
- Cross-price: a 1% competitor price increase lifted their sales 0.3-0.8%.
The insight: prosumer and specialty products could support higher prices, while consumer products required carefully targeted promotions to move volume. They increased prices on prosumer SKUs by 8-12% and saw volume decline only 4-6%, growing profit by 15%+.
Case 2 — Global Pharmaceutical:
A global pharma company analyzed 75 brand-channel combinations across 5 emerging markets using mixed-effects random slope, Double ML, and first-difference OLS. They uncovered a critical pitfall:
- OTC products (moderately elastic): median elasticity -0.7
- Prescription products (inelastic): median elasticity -0.4
But naive analysis revealed a danger: companies that didn’t control for confounding variables saw WRONG-SIGN elasticities. Why? Price increases had coincided with marketing and sales pushes. Without econometric controls, the models detected the marketing effect, not the true price effect.
Pitfalls That Lead to Bad Pricing Decisions
Confusing correlation with causation. A hospital supplies company noticed that when they raised prices, volume fell 8%. They concluded elasticity was -0.8 (inelastic, price increases justified). They missed a competing facility opening 20 miles away that same week. The volume drop was competitor-driven, not price-driven. Elasticity was actually -0.3 (highly inelastic).
Ignoring competitor moves and market shocks. Elasticity is conditional on market structure. If you have one major competitor, elasticity under symmetric price moves is different from elasticity under asymmetric moves.
Using stale estimates. A product that was commodity-like (elastic) can become differentiated (inelastic) through marketing or product improvement, or vice versa. A ten-year-old elasticity estimate is likely obsolete if the market has consolidated, fragmented, or been disrupted. Best practice: refresh estimates annually at minimum, quarterly in fast-moving categories.
Applying company-wide averages to customer decisions. If your overall elasticity is -0.7, that’s useful directionally but useless for individual pricing decisions. Some segments have elasticity -0.3; others -1.4. Applying -0.7 to both is wrong for both.
Implementation Roadmap for Pricing Teams
Start with a baseline estimate. Don’t pursue perfection. Gather your transaction data, define the product and customer segment, and estimate elasticity using standard methods. Document assumptions and confidence levels. Share with leadership so everyone understands price sensitivity dynamics.
Pair the baseline with a decision hypothesis: “We believe demand for Product X in Segment Y is inelastic (elasticity -0.6 to -0.8) because [reasons]. If true, a 5% increase will grow revenue and profit. We will test this by piloting on a segment.” Framing elasticity as a hypothesis, not fact, disciplines thinking and opens the door to validation.
Prioritize segments where pricing changes matter most. A 5% increase on a $100 annual product affects one target; a 5% increase on a $5 million annual contract affects another. Prioritize segments where pricing creates material profit impact.
Run controlled changes and monitor outcomes. Don’t implement across the entire customer base on day one. Run a controlled test: pilot the new price on a subset, keep a control group at the old price, and measure the difference.
Build elasticity into revenue management governance. Assign ownership. Embed elasticity into a quarterly or semi-annual review. Create an elasticity dashboard for leadership so they see trends and pricing implications.
FAQ About Price Elastic and Inelastic Demand
What is the difference between price elastic and price inelastic demand?
Price elastic demand means quantity changes by a larger percentage than price changes (|elasticity| > 1). Customers are price-sensitive. Price inelastic demand means quantity changes by a smaller percentage than price changes (|elasticity| < 1). Customers are not price-sensitive. Raising price in elastic demand shrinks revenue; raising price in inelastic demand grows revenue.
Is 1.75 elastic or inelastic?
Elastic (greater than 1). A 1% price increase produces a 1.75% quantity decrease, so revenue falls.
Is 0.5 elastic or inelastic?
Inelastic (less than 1). A 1% price increase produces only a 0.5% quantity decrease, so revenue grows.
How do I know if demand is elastic or inelastic?
Estimate elasticity using historical transaction data and econometric methods, or run controlled tests. Compare the coefficient to 1: greater than 1 is elastic, less than 1 is inelastic.
Key Takeaways for Pricing Leaders
Trust elasticity when it’s based on substantial data (thousands of transactions, multiple time periods), rigorous methods (econometric controls), and validated against tests. Be skeptical of estimates based on small samples, simplistic correlations, or a single method.
Combine elasticity with business judgment. Elasticity provides the quantitative anchor. Business judgment provides the qualitative overlay. A price increase might be elasticity-justified but strategically wrong if it invites competitive retaliation.
Start with your highest-impact segments. Document assumptions and confidence levels. Run a controlled pilot based on elasticity logic, then validate the estimate. Build elasticity reviews into your revenue management process, refreshing as data accumulates.
For deeper guidance on implementing elasticity modeling, explore Revology Analytics’ price elasticity modeling guide and resources on modeling price elasticity. Our advanced elasticity modeling framework provides additional practical depth, and our analysis of the merits of aggregated data for demand and price elasticity modeling explains when aggregation outperforms granular approaches. Our price elasticity modeling best practices for 2024 guide walks through implementation discipline. For B2B teams, see our B2B price elasticity model in under 90 minutes accelerated framework. Use break-even price elasticities as a sanity check for your assumptions. Our price optimization strategies guide ties elasticity into your overall pricing architecture, and for research context, see the importance of knowing your price elasticities.
Ready to Sharpen Your Pricing Decisions?
Understanding price elastic and inelastic demand is table stakes for serious pricing strategy. The math is straightforward; the execution is where most organizations stumble. The distance between knowing elasticity matters and actually using it to inform decisions is where value hides.
Revology Analytics helps pricing, revenue, and finance leaders quantify elasticity, validate estimates, and build it into operational pricing decisions. If you’re ready to move elasticity from concept to decision-making tool, book a pricing and revenue management diagnostic call with Revology Analytics and let’s assess where your pricing sits and where precision creates value.