

Overview: Price elasticities in Practice
This article from Revology Analytics explains price elasticities in the context of modern pricing analytics and revenue growth management. It draws on real engagements with mid-market and enterprise clients to turn price elasticities from a buzzword into a measurable commercial capability. Read on for the full perspective, and see our related reading for additional depth.
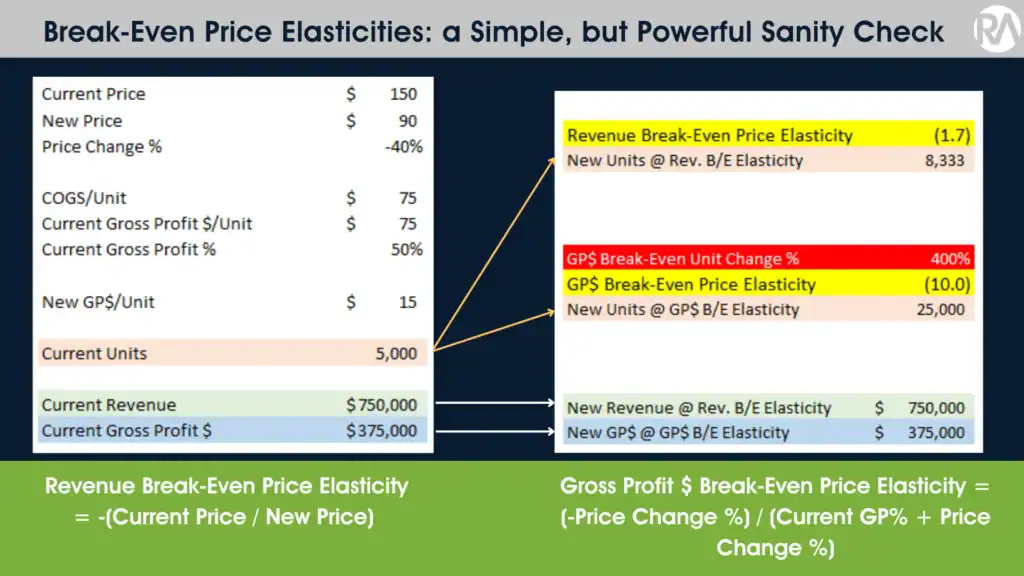
Have you ever offered a deep Price Discount in December in hopes of accelerating 4Q and YE target achievement, only to drive Unit Sales but suffer huge Gross Profit losses?
You proposed a -40% Price Investment in one of your anchor products, along with an accompanying sales blitz and marketing materials.
The -40% YE promotion is not unheard of, and you’ve seen End-of-Quarter and End-of-Year Discounts north of -50% occasionally – primarily to meet Competitive price points.
After all, your Gross Profit % is still at a healthy ~ 20% after the deep discount (down from a GP% of 50%).
You meet with your finance and pricing counterparts, who begrudgingly support the December price promotion.
Break-Even Price Elasticity (B/E P/E) is a simple but often underutilized concept outside the Consumer Products industry. There are two versions of B/E P/E that the Pricing and Commercial teams anchor to:
Revenue Break-Even Price Elasticity: what would the product’s Price Elasticity have to be to remain Revenue-neutral with my Price Investment? (in other words, generate the same Revenue $ at the new Price compared to the old Price).
Gross Profit Break-Even Elasticity: what would Price Elasticity have to be to remain Gross Profit neutral? I.e., generate the same Gross Profit $ at the new Price as we did at the old Price.
It’s a powerful concept because it serves as a quick sanity check of our Pricing Decisions. It can quickly tell us whether our proposed Price Investment is reasonable or if it’s wildly aggressive and has a substantial adverse impact on our Operating Profit.
Take a look at our fictional, -40% Price Investment example below:
To break even on Revenue $, our Price Elasticity would have to be -1.7 or higher (i.e. “more elastic”). If our historical Price Elasticities have ranged from -4 to -0.5 in our industry, this number seems reasonable, and we can feel comfortable making this price investment.
To break even on Gross Profit $, our Price Elasticity would have to be -10 or higher. In contrast to our Revenue-neutral P/E number, this one seems highly improbable, especially if our max Elasticity has been -4.
Stated differently, to make the same Gross Profit $ during our December promotion as we would under the current Price, our Units would have to increase by 10% for every 1% Price Investment (-10 P/E x -40% Price Investment = 400% Unit Change to break-even on GP$).

To express these two necessary Break-Even calculations mathematically:
Revenue Break-Even Price Elasticity = -(Current Price / New Price)
Gross Profit $ Break-Even Price Elasticity = -1 / (Current GP% + Price Change %)
If you are a Pricing, Finance, or Sales Ops/Analytics practitioner, please add the B/E Price Elasticity sanity check to your Price Investment evaluation toolkit. It’s a simple concept that can reaffirm a pricing decision or prevent you from doing something damaging to your Operating Profits.
Related Reading
- RA Quick Insights: Using Discount Curve Analysis to Evaluate Pricing Behavior
- Retailer Pricing: Frameworks, KPIs & Examples
For broader industry perspective on pricing analytics and revenue growth management, see McKinsey’s Growth, Marketing & Sales insights.