This guide is designed for pricing, revenue management, and finance leaders evaluating pricing analytics software in 2026. It outlines key selection criteria, common pitfalls, and how to estimate potential value before making a commitment.
The most effective pricing analysis platforms for FMCG and durable goods align with a company’s use case, data maturity, and decision cadence, rather than simply offering the most features. Prioritize platforms that support promotion and assortment complexity, elasticity, scenario modeling, workflow adoption, and deliver measurable revenue or margin impact from implemented decisions.
Many selection processes are misaligned. Procurement often compiles an extensive vendor list, commercial leadership requests demonstrations, and creates a scorecard in Excel. Frequently, the vendor with the most compelling machine-learning narrative is chosen. Months later, sales teams may still rely on spreadsheets, trade spend remains opaque, and finance cannot link pricing changes to P&L outcomes. The issue is not the platform itself, but the lack of fit.
This guide explains how FMCG and durable goods manufacturers should evaluate pricing analytics software, outlines necessary data inputs for vendor success, provides a framework for comparing options, and identifies where consulting support can accelerate results.
Table of Contents
What pricing analysis platforms are in FMCG and durable goods
A pricing analysis platform is software that analyzes price, promotion, discount, pack architecture, competitive position, and demand response data to enable more informed pricing decisions. This category includes three related tool types that are often conflated in RFPs.

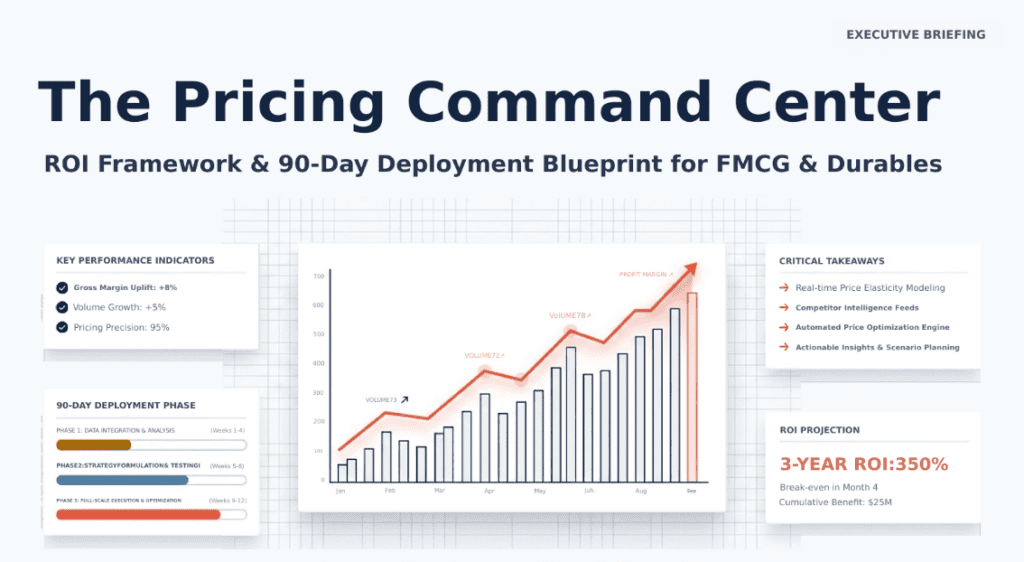
Best pricing analysis platforms for FMCG and durable goods: ROI snapshot indicates a 350% three-year return and break-even by month four.
A pricing analysis platform for FMCG and durable goods enables commercial teams to analyze prices, promotions, discounts, pack architecture, competitive positioning, and demand response to support better pricing decisions. The optimal platform depends on whether the business requires promotion optimization, dynamic pricing, net price realization, trade investment analysis, competitive price monitoring, or margin governance across channels and customers.
Analytics platforms explain past performance, such as price waterfalls, promotion effectiveness, and elasticity estimation. Optimization platforms recommend future actions, including list prices, promotional calendars, and customer-specific quotes. Execution platforms implement decisions in transactional systems such as quote-to-cash, TPM, and e-commerce pricing engines. While some vendors claim to offer all three capabilities, few excel in each area.
FMCG businesses require support for high SKU counts, pack-price architecture, trade promotion analysis, and weekly shelf dynamics across multiple retailers. Durable goods businesses prioritize quote-level discount governance, longer purchase cycles, competitive price monitoring, channel margin management, and configuration complexity. Platforms designed for one sector rarely meet the needs of the other without significant customization.
Why pricing platform selection matters
According to Revology’s research of 2,000 global companies, a 1% improvement in price realization produces a 6–7% lift in operating profit. Excluding highly regulated industries, this figure is in the 10–11% range. — Pricing Still Packs a Punch (Revology Analytics, June 2025)
For a $500M FMCG manufacturer, 1% of net price realization is roughly $5M of topline and, at typical operating margins, $3M–$4M of incremental EBITDA. For a $200M durable goods business, the same move is $2M of revenue and $600K–$1.2M of EBITDA. Neither number happens by accident. Both require a pricing platform that can see the leakage, attribute the cause, and route the decision to someone accountable for the fix.
Margin leakage is a significant challenge, often occurring through invoice discounts, off-invoice trade spend, customer rebates, freight absorption, and unplanned promotions. These are the top five pricing pain points for mid-market CPGs. Without a platform that integrates transaction, list, invoice, and discount data into a unified waterfall, commercial teams lack visibility into financial flows and cannot assess whether concessions drive incremental volume.
Selecting a platform involves balancing speed and complexity. A lightweight BI and elasticity solution can be deployed quickly but is limited to descriptive analytics. An enterprise suite offers broader capabilities but requires 12 to 18 months and substantial internal resources to realize value. Aligning the tool with the revenue management organization’s maturity is a stronger predictor of ROI than the vendor’s feature set.
Common pricing use cases by category and channel
FMCG use cases typically include shelf price monitoring, promotional effectiveness, pack-price architecture, mix management, and trade investment ROI. For example, a mid-market FMCG beverage company operated with approximately 1,800 unstandardized deal lines across ERP, trade promotion management, distributor depletion feeds, and syndicated POS. There was no consolidated view of price realization, and trade spend budgets continued without ROI measurement due to data integration challenges. This scenario exemplifies the requirements that any effective pricing analytics software must address.

Seven core capabilities of a best-in-class pricing analytics platform for FMCG and durable goods
Durable goods use cases focus on quote-level pricing, dealer and channel discount governance, competitive price response, and product configuration complexity. For instance, a global durable goods and tech hardware manufacturer managed a $200M U.S. consumer business across major retailers, where reactive and unplanned discounting was common. Manual spreadsheets could not distinguish true promotional lift from category demand shifts, competitor actions, or seasonal events. As a result, effective promotions were penalized, while unprofitable ones persisted due to insufficient data.
Cross-channel promotion and discount management bridge the needs of both sectors. The essential capability is linking promotional investments to incremental volume and margin outcomes at the retailer, SKU, and weekly level. Tools that aggregate data only at the brand and quarterly levels overlook critical decision points. For more details, see Driving Profitable Growth in Retail with Pricing Tools and Software.
Core capabilities to evaluate in a platform
Six core capabilities distinguish pricing analysis platforms that drive measurable EBITDA from those that only generate dashboards.
Key capabilities include: a price waterfall with pocket margin visibility that breaks down list to net to pocket across all discounts, rebates, and cost-to-serve lines; an elasticity engine capable of causal inference (such as Double Machine Learning), rather than simple regression; a scenario modeler for simulating price and promotion combinations before budget commitment; dynamic pricing support where appropriate (more common in B2B and online retail than in brick-and-mortar FMCG); workflow, approvals, and exception management to ensure recommendations are governed; and a business-governed master data and mapping layer to manage frequently changing product, customer, and competitor SKU hierarchies.
The durable goods example above required all six capabilities. The solution included a Revenue and Profit Decomposition module (dynamic price waterfall), an ML-driven scenario modeler, a unified command center using Tableau and Power BI, and a mini-MDM application for business-governed competitor SKU mapping. Transactional pricing tools without integration for competitive scraping or retailer sell-out data led to missed insights.
Data inputs required for reliable pricing analysis
No platform compensates for bad data. The minimum viable input set for FMCG includes customer-tagged general ledger, invoice-level transactions, list and net prices, TPM deal rates and accruals, distributor depletions at weekly customer × SKU grain, syndicated POS, trade-spend budgets, and freight invoices for cost-to-serve. For durable goods, add multi-year competitive pricing history (104 to 156 weeks is a realistic floor for stable elasticity), retailer sell-out data, syndicated category demand signals, and fully loaded cost tables.

Pricing performance typically declines gradually rather than suddenly. Static models and manual spreadsheets are unable to adapt to changing costs, tariff adjustments, and increasing channel complexity.
Data quality is more important than data volume. Dimensional mismatches cause more pricing platform failures than modeling errors. For example, a freight file recorded by cost center and date cannot be reconciled with shipment, item, and customer-level data without a dedicated translation layer. Effective master data governance is essential, including ownership of product hierarchies, SKU classification, and maintenance of competitor mappings as assortments change. Business-owned MDM solutions are typically three to five times faster to implement than IT-managed alternatives, and this advantage increases over a year-long project.
Practical framework for comparing vendors
Begin by identifying the decision you aim to improve, rather than focusing on software categories. If trade spend leakage is the primary issue, prioritize platforms with robust TPM analytics and promotional ROI measurement. For quote-level discounting, select platforms with CPQ integration and deal-desk workflow. After narrowing your options, evaluate use-case fit, usability for key users, integration requirements, total cost of ownership, and time-to-value. Adjust your evaluation criteria based on decision cadence; for example, a platform with monthly refreshes is unsuitable for a weekly DSD-pricing business.
The integrated-platform-versus-point-solution debate deserves its own evaluation. Why your CPG needs an integrated pricing, and RGM Navigator lays out why bolted-together point solutions rarely beat a coherent integrated stack for mid-market manufacturers. The handoffs between promotion planning, pack-price architecture, elasticity, and execution are where value either compounds or evaporates.
Best pricing analysis platforms by functional fit
Instead of ranking vendors in a single list, categorize them by functional strengths. Platforms with strong competitive price monitoring and benchmarking capabilities excel at retailer scraping, SKU-match normalization, and price-gap reporting, which are essential for durables and online retail but less so for brick-and-mortar FMCG. Platforms focused on optimization and recommendations provide causal elasticity, scenario simulation, and prescriptive recommendations, benefiting both industries once a solid data foundation is established. Platforms specializing in discount management and execution support quote-to-cash workflow, approval routing, and deal-desk governance, which are critical for durables and increasingly important for FMCG trade spend approvals.

Moving from gross-to-net to true pocket margin with GL-allocated cost-to-serve
The best pricing analysis platform depends on the specific use case, organizational maturity, industry, and budget. For example, a $50M private-label FMCG manufacturer and a $2B global durables OEM should not consider the same vendors, even if both are potential buyers of pricing analysis platforms.
How to assess automation and dynamic pricing claims
By 2026, nearly all platforms claim to offer AI-driven dynamic pricing. In practice, most mid-market FMCG and durable goods solutions provide rules-based automation with some machine-learning features, which is often appropriate. Dynamic pricing is particularly valuable in B2B segments with high deal volume and configurable quotes, as well as in online retail with frequent competitive updates. It is less effective in FMCG settings where shelf-price changes require retailer negotiation and advance trade calendar alignment.
Explainability is essential. As detailed in Stop Asking for an AI Pricing Tool, commercial teams will not act on recommendations they cannot justify to customers or executives. Platforms that present elasticity and optimization outputs as black boxes consistently underperform, regardless of model sophistication.
The case of the global pharmaceutical manufacturer makes this point concretely. Organizational resistance to black-box machine learning forced the solution into Excel-based scenario simulators that translated Double Machine Learning elasticity outputs into intuitive what-if models. The 5–10x ROI on that pilot came from country general managers making better calls, not from an algorithm making calls on their behalf.
KPIs to track before and after implementation
Consistent measurement distinguishes pricing analysis platforms that deliver value from those that become costly reporting tools. Establish baseline metrics before implementation and monitor them monthly thereafter.
Core pricing KPIs:
• Price realization = net realized price/target net price
• Gross margin % = (revenue − cost of goods sold) / revenue
• Promotion ROI = incremental gross profit/promotion spend
• Price elasticity of demand = % change in volume / % change in price
• Weighted platform score = Σ (criterion weight × platform score)
• Payback period = implementation cost / monthly realized benefit
Supplement these with metrics such as discount leakage percentage, promotional compliance rate, quote-to-close win rate, time from price-change request to implementation, and forecast accuracy for volume response to price changes. Platforms that cannot automatically report these metrics from live transaction data are labeled as analytics tools, not pricing solutions.
Worked example: selecting a platform for a multi-brand manufacturer
Consider a mid-market FMCG beverage manufacturer with $500–700M in revenue, multiple brands, DSD distribution, six bottler partners, and approximately 1,800 unstandardized deal lines across ERP, TPM, and distributor depletions. The primary challenges included unmeasured trade spend, lack of visibility into net price realization below the brand level, and assortment decisions based on intuition rather than a structured velocity-margin-role framework.

Anonymized FMCG case: $4-6M EBITDA lift and 15-20x ROI from proactive promotion planning
The evaluation scorecard weighted TPM analytics at 25%, customer profitability waterfall at 20%, elasticity and scenario modeling at 20%, workflow and governance at 15%, implementation effort at 10%, and vendor viability at 10%. Shortlisting narrowed a long list of 14 vendors to a final three. The winning configuration combined a medallion data architecture, a Promotional Effectiveness engine with three-tier ROI (retail cost, manufacturer cost, incremental profit), a Dynamic Scenario Modeler built on Double Machine Learning, a Customer Profitability waterfall, and a business-owned master data application.
The results included $4–6M in annualized EBITDA, a 15–20x ROI over 12 months, $1.5–2.5M in trade spend efficiency (approximately 3–5% of a $45–55M DSD trade budget), and $2.5–3.5M in net price realization (0.4–0.6% of revenue). These outcomes were not achieved solely by the platform; it provided transparency, while the commercial organization made the decisions that drove results.
Implementation roadmap for a successful rollout
A successful rollout follows three phases. Phase one focuses on diagnostics and data foundation, taking four to eight weeks to assess data readiness, define the target data model, establish master data governance, and build the initial price waterfall. Phase two involves piloting use cases and establishing KPI baselines over eight to twelve weeks, implementing one or two priority use cases, setting KPI baselines, and delivering initial decisions with measurable impact. Phase three covers scaling, governance, and continuous improvement over the next nine to twelve months, expanding use cases, integrating with planning and execution workflows, and embedding ongoing measurement.
The regulated-industry pilot mentioned earlier compressed this to 10-12 weeks for executive-ready insights on a $200M scope. The acceleration came from pre-built methodologies applied to the client’s data rather than being rebuilt from scratch: an Automated Product Equivalence Matrix using natural language processing, WHO-defined Daily Dose equivalization for the Competitive Price Index, Double Machine Learning elasticity, and an opinionated Pricing Quick Wins engine.
Pitfalls to avoid when buying pricing software
Purchasing advanced AI capabilities without process readiness is a common and costly mistake. A platform that generates dynamic pricing recommendations that are not implemented is less valuable than a reliable price waterfall trusted by finance and sales. Model accuracy alone does not determine business value; adoption is critical. A model with 5% mean absolute error used by 80% of category managers is more effective than a model with 2% error that is overridden 90% of the time.

Successful implementations follow a sequence: first, build the data pipeline; then, train the models; and finally, establish governance. Attempting all three simultaneously increases the risk of failure.
Another common pitfall is treating dynamic pricing as a universal requirement. In shelf-price-driven FMCG, frequent automated repricing is often impractical due to retailer negotiations, trade calendar alignment, and price-point thresholds. For configured durable goods sold through dealers, rules-based guardrails with exception approval generally outperform fully automated pricing.
Assuming a platform can compensate for weak transaction data or poor governance is another common mistake. Data quality is fundamental; platforms that import poor data generate misleading dashboards. Applying the same evaluation criteria across different categories and channels is also problematic, as capability priorities differ between a DSD beverage business and a durable goods OEM. Additionally, automation does not ensure adoption. Sales and category teams embrace tools that simplify their work and improve results. Automation without effective change management often leads to underutilized, costly dashboards.
Build vs buy vs augment with consulting support.
Internal BI tools are sufficient when pricing questions are descriptive, data quality is adequate, and decisions are made monthly or less frequently. When questions become causal or prescriptive, or require frequent adjustments (such as weekly shelf changes across many SKUs), a dedicated pricing platform becomes necessary.
Purchasing an established pricing analysis platform is appropriate when there is a strong use-case fit, the internal team can manage master data and workflows, and the vendor’s methodology aligns with the industry context. It is a mistake if implementation requires more internal capability than is available, or if the platform is intended to replace a commercial operating model that is not yet established.
Consulting support often delivers the fastest value for mid-market manufacturers. Consultants accelerate data foundation development, build initial use cases, transfer methodology to internal teams, and facilitate collaboration between IT and commercial functions during platform maturation. The objective is to establish a sustainable operating model with defined KPIs, governance cadence, and a trained team, rather than create ongoing dependency. Revology’s pricing and revenue growth management practice is structured around this handoff approach.
Key takeaways
• Start with the decision to improve, not the software category; FMCG and durable goods often need different workflows, data granularity, and refresh frequency.
• Assess data readiness early, including transaction history, product hierarchy, customer hierarchy, promotion flags, cost data, and competitive price inputs.
• Prioritize use-case fit, such as promotion effectiveness, price elasticity modeling, discount governance, price pack architecture, or dynamic pricing.
• Require explainable outputs and workflow integration so sales, category, finance, and revenue management teams can act on recommendations.
• Measure value using realized price, gross margin, trade spend efficiency, win rate, volume retention, and speed of decision-making rather than model accuracy alone.
• Favor platforms that support practical implementation, governance, and exception handling; automation without operating discipline often underperforms.
Frequently Asked Question
What is the pricing strategy for FMCG products?
FMCG pricing strategy usually balances volume, margin, promotion intensity, pack-price architecture, channel roles, and competitive price position. It often relies on frequent monitoring of elasticity, trade spend, and assortment effects.
What are the 5 C’s of pricing?
A common 5 C framework includes customers, costs, competition, company objectives, and channel context. Companies may define the fifth C differently, so the page should state the version being used.
Which platforms offer the most reliable automation for dynamic pricing?
The most reliable platforms are those with strong data pipelines, clear business rules, exception management, and user adoption. Reliability depends as much on governance and data quality as on the algorithm.
What are the 3 C’s of pricing strategy?
The 3 C’s are commonly customer, cost, and competition. They are a basic framework for setting price direction before more advanced analytics are applied.
How should FMCG companies evaluate pricing analytics software?
They should evaluate software by use case coverage, promotion and trade-spend support, data readiness, scenario modeling, workflow adoption, and realized financial impact. FMCG environments usually require strong support for high SKU count, pack-price architecture, and trade promotion analysis.
How should durable goods companies evaluate pricing analytics software?
Durable goods companies should emphasize quote-level pricing, discount governance, competitive intelligence, product configuration complexity, and margin waterfall visibility. Longer purchase cycles and channel complexity often matter more than refresh frequency.
What data is required for pricing analytics software?
Typical inputs include transaction data, list and net prices, discounts, costs, product and customer hierarchies, promotion history, and competitive prices where available. Better results usually require clean historical data and consistent master data.