How to Measure It and Improve Pricing Decisions
Learn to avoid common errors in assessing B2B price sensitivity and use a 90-day commercial action plan for improvement.
Introduction
Understanding B2B buyer price sensitivity behavior is crucial because lowering a price may not always secure a deal, while holding firm can sometimes result in larger wins. When competitors enter, buyers often request discounts. The key takeaway is that these scenarios are windows into customer behavior, but extracting insights depends on correctly interpreting these signals.
B2B buyer price sensitivity behavior reflects how purchase probability, deal size, product mix, and negotiation intensity change in response to price, discounts, terms, and competitive context throughout the buying journey. It is not a single metric; it varies by customer, product, and deal. The challenge is to measure this variation accurately so your commercial team can distinguish true shifts in willingness to pay from sales pressure, portfolio changes, or data noise. Understanding the full range of factors influencing buyer decisions enables a shift from indiscriminate discounting to targeted, precision pricing.
| Definition: B2B Buyer Price Sensitivity BehaviorB2B buyer price sensitivity behavior refers to how business customers respond to changes in price and commercial terms, including list price, net price, discounts, rebates, bundles, contract structure, service levels, and payment terms. In B2B environments, it is rarely a single elasticity number. It shifts by segment, use case, urgency, competitive options, switching costs, stakeholder group, and buying stage. The practical goal: detect whether buyers are becoming more or less responsive to price, quantify the margin and volume impact, and turn that insight into pricing, discounting, packaging, and sales guidance. |
What B2B Buyer Price Sensitivity Behavior Means
Price sensitivity in B2B differs significantly from consumer purchasing. For example, when a pharmaceutical company evaluates a new supplier, procurement considers not only price but also payment terms, contract requirements, volume flexibility, and support. A buyer may be highly price-sensitive for commodity inputs but inelastic for mission-critical systems.
Consumer price elasticity is generally predictable, while B2B price sensitivity is more complex for several reasons.
First, multiple stakeholders have competing priorities. Procurement seeks the lowest price, operations prioritize reliability, and IT focuses on integration. Price resistance from one stakeholder may reflect technical concerns rather than cost sensitivity.
Second, switching costs influence behavior. For example, a three-year software contract imposes significant switching costs in the second year, even if a competitor offers a 20% lower price. This reduces short-term sensitivity but increases long-term renewal risk.
Third, negotiation dynamics can obscure true willingness-to-pay. The list price is seldom the final price paid. Actual negotiations focus on discounts, rebates, payment schedules, trade spend, and implementation support. As a result, two deals with the same list price may yield very different net margins.
Key Terminology Matters
Willingness to pay is the maximum price or commercial terms a buyer will accept for a specific product or service in a given context. It’s not fixed; it changes with the buyer’s alternatives, urgency, budget, and perception of value.
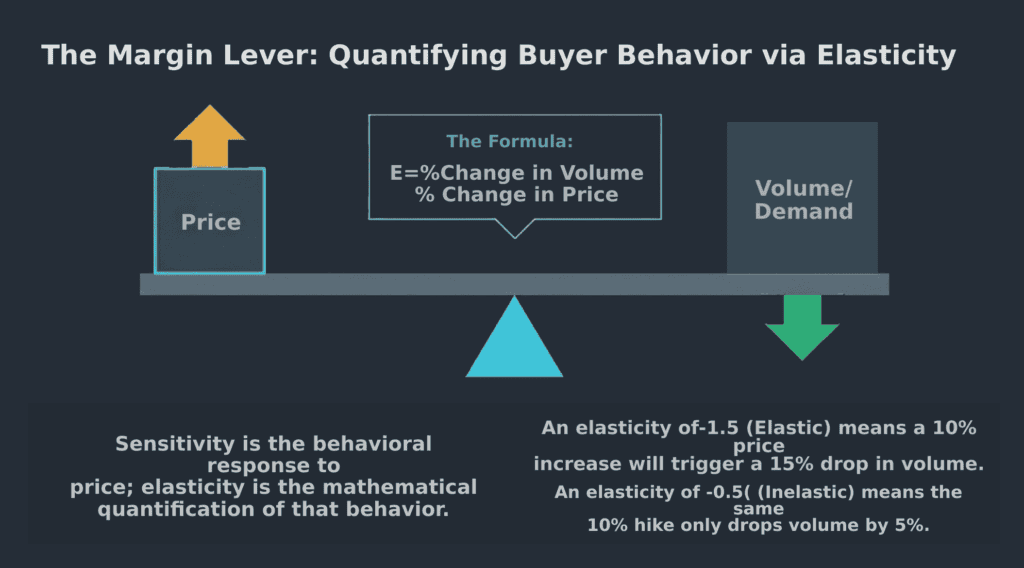
Price elasticity is the percentage change in quantity demanded divided by the percentage change in price. An elasticity of -1.04 means a 1% price increase reduces demand by roughly 1%. Elasticity below -1 is elastic (price cuts increase revenue more than they preserve margin); above -1 is inelastic. In B2B, elasticity varies by segment, and a single enterprise-wide number is usually misleading.
Price realization (net price or pocket price) is the actual price received after all deductions, including discounts, rebates, freight credits, service offsets, and trade spend. Many teams set customer pricing carefully but fail to track what actually gets realized. A $100,000 list price with a 35% average discount realizes at $65,000. Even a 1% improvement in realization can move the operating profit needle significantly (more on the math in the next section).
Discount management is the operating discipline around when, why, how deep, and to whom discounts get granted. Weak governance bleeds margin quietly: sales teams grant discounts to close deals, but they may be discounting to buyers who would have bought anyway, or closing deals too small to justify the margin sacrifice. A sound discount strategy links discounting to segment economics and competitive context, not reflex.
Why Price Sensitivity Matters for Revenue Management
Here is the single most important number in commercial strategy: a 1% improvement in price realization produces a 6-7% lift in operating profit, according to Revology’s “Pricing Still Packs a Punch” study (June 2025) of 2,000 global companies. Price flows directly to the bottom line. A $100 million B2B company with 20% EBITDA margin that improves its price by 1% gains $1 million in additional gross profit. Compare that to cost reduction (1% COGS saves only $0.6M) or volume growth (5% revenue growth requires five times as much new business). Pricing and revenue growth management (RGM) earns attention for a reason.
The main takeaway is that high price sensitivity may signal poor product-market fit, intense competition, or weak sales execution. Teams that resort to deep discounts may misinterpret negotiation tactics as genuine sensitivity.
To clarify price sensitivity, track win rates by price band. The key takeaway is that win-rate patterns—where lower prices close more deals—help distinguish actual sensitivity from other factors, such as product positioning.
Genuine high price sensitivity leads to lower deal quality: buyers negotiate harder, switch faster, and bring in less expansion revenue. The takeaway is that deals with stable willingness-to-pay are typically more valuable and longer-lasting.
When sales teams respond to price objections too quickly, they may misread buyer intentions. The key takeaway is that analytics can reveal where true sensitivity exists, reducing unnecessary discounts without sacrificing win rates.
What Shapes Price Sensitivity in B2B Buying Decisions
Three factors matter most: purchase importance, budget constraints, and switching costs. A purchase that represents 1% of the buyer’s budget receives more price scrutiny than one that represents 10%, because the cost-benefit math changes. Switching costs matter too. A company running mission-critical workloads on a cloud platform faces high switching costs and is sticky at renewal, but more price-sensitive in initial procurement before lock-in.
Competitive alternatives may be the most powerful driver. A buyer with a strong alternative has options; without one, they are more inelastic. When procurement opens a competitive bid process, they deliberately create optionality to pressure price. A supplier with 90% market share exhibits relatively inelastic demand; one with 15% share in a commoditized category faces real price sensitivity.
Procurement dynamics also influence perceived buyer sensitivity. A procurement officer with board-mandated price targets will negotiate aggressively, regardless of their personal views on willingness to pay. This behavior reflects organizational requirements rather than true economic sensitivity. The appropriate response is to understand the procurement context and distinguish between political pressure and genuine price sensitivity.
Value perception drives behavior directly. A buyer who has done the value math and concluded that your solution saves $500,000 annually is far less price-sensitive than one who views it as a commodity. Risk matters similarly: mission-critical applications where failure costs millions get priced differently than nice-to-have projects. When procurement, IT, and the business sponsor all agree that your solution is right, price becomes secondary. When stakeholders are fractured, price becomes the battleground.
Common Signals That Buyers Are More or Less Price Sensitive
Willingness-to-pay changes over time as buyer alternatives evolve, budgets fluctuate, internal champions shift roles, or new competitors enter the market. Detecting these shifts requires comparing current deal data to historical baselines and monitoring observable behaviors such as quote rejection rates, discount requests, win-loss patterns, and sales cycle length.
Monitor buyer engagement closely. Buyers who ask detailed questions about value, implementation, and references are typically less price-sensitive. In contrast, buyers who bypass discovery and request a quote are likely focused on price. For renewals, an early commitment at list price indicates confidence in the value, while last-minute negotiations and discount demands suggest greater price sensitivity.
Quote revision behavior provides valuable insights. If a buyer reduces the scope to save on price, this indicates sensitivity. If a buyer reduces the scope to save on price, this indicates sensitivity. Direct concession requests, such as “your price is 20% above our budget,” indicate budget constraints, while references to competitor pricing signal sensitivity to alternatives.
Price sensitivity varies across your customer base. Larger accounts often negotiate for volume discounts but may be less price-sensitive overall. Industry trends also play a role: regulated industries may be willing to pay higher prices for compliance solutions, while startups and cost-focused enterprises are typically more price-sensitive. The use case is important as well; core operational needs support stronger pricing than discretionary tools.
A Practical Framework to Assess Buyer Price Sensitivity
Step 1: Define segments and buying contexts
Segment your market by customer characteristics (size, industry, geography) and purchase characteristics (product family, use case, deal size, order frequency). For a B2B SaaS company:
• Enterprise, core product, annual commitment (likely low sensitivity)
• Enterprise, add-on product, pay-as-you-go (likely medium sensitivity)
• Mid-market, core product, annual commitment (likely medium sensitivity)
• Mid-market, add-on, pay-as-you-go (likely high sensitivity)
• Startup, core product, monthly commitment (likely high sensitivity)
Within each segment, define buying stages: early-stage exploration (no formal budget), late-stage negotiation (approved budget, competing offers), and renewal (deciding to continue, renew, expand, or switch).
Step 2: Analyze historical transactions and outcomes
Pull transaction data: quote amounts, dates, products, customer segments, competitive context, and outcomes (won/lost/extended). Organize by segment and stage. Build a simple table showing average quote price, realized price, win rate, average deal size, and key patterns.
Key analysis: as net price increases within a segment, observe whether win rates decline and by what margin. This trend indicates price elasticity.
Step 3: Test hypotheses and refine pricing actions
Once you have the data picture, form and test hypotheses. Look at deals with and without competitor context. Analyze win rates by quote price band, controlling for deal size and segment. Use win-loss interviews: ask why you lost deals. Was it price, product, or something else?
A pharma company found that OTC product sensitivity was driven less by price and more by marketing spend and distribution breadth. Prescription products had lower sensitivity and higher sensitivity to medical evidence and clinical relationships. This reshaped their strategy.
Data Inputs Required for Reliable Analysis
Transaction data is foundational: every price quote (list and net), every discount granted (with reason and depth), whether quotes were won or lost, and timing (quote date, close date, sales cycle length by segment). This data lives in your CRM and quoting systems; pulling a clean dataset often requires integration work.
Beyond transaction data, you need context: win-loss data (which competitor won? what was the stated reason?), pipeline data (stage, size, probability, competitive context), and engagement data (email opens, demo attendance, reference calls).
Finally, understand product and commercial context: product mix in each quote, contract terms (length, payment terms, minimum commitments, renewal terms), and competitive context (which competitor, at what price, with what product/terms).
Methods to Measure and Quantify Sensitivity
The mathematical definition of price elasticity is the percentage change in quantity demanded divided by the percentage change in price. With historical deal data (156 weeks, 24 months), run a regression of the log of quantity on the log of net price, controlling for time, seasonality, sales effort, and competitive context. The coefficient on price is the elasticity.
Elasticity of -1.04 means a 1% price increase reduces demand by 1.04%; -0.72 means a 1% increase reduces demand by 0.72% (inelastic). Always segment: calculate elasticity separately for each segment. You’ll find a wide variation.
For new products or markets with limited transaction history, you’ll find a wide variation. The ice Sensitivity Meter (PSM) asks four survey questions about optimal, bargain, expensive, and prohibitive price points. Compute optimal price, acceptable range, and indifference points. Van Westendorp captures stated preferences, not revealed behavior; combine it with elasticity analysis and controlled tests.
Controlled testing gives you the cleanest signal: quote segment A at price P1 and segment B at price P2, controlling for product, customer characteristics, and context. Measure win rates and deal sizes. Price fencing works well alongside testing: offer Starter at $50K, Professional at $100K, Enterprise at $200K. Customers self-select into tiers based on their willingness to pay.
To quickly build an effective B2B price elasticity model, begin with transaction data, control for confounding variables, and analyze by segment. Consider dynamic pricing to implement segment-specific pricing and to test offers operationally.
KPIs to Track Price Sensitivity and Pricing Performance
Price realization is the ratio of actual net price to target price:
If the target is $100K and you realize $75K, the realization is 75%. Track by segment. If the target is $100K and you realize $75K, the realization is 75%. Signal changes in sensitivity or sales pressure in that segment.
Pocket margin accounts for all deductions: invoice price minus discounts, rebates, credits, and concessions. Many teams optimize list price but ignore pocket price erosion. You may have a $100K list price, but after a 25% volume discount, 10% early-payment discount, and 5% promotional credit, you realize $60K.
Build a matrix: for each price band and segment, track win rate percentage.
| Price Band | Enterprise Core | Enterprise Add-on | Mid-Market Core | Mid-Market Add-on |
| -20% to 0% | 72% | 58% | 54% | 31% |
| 0% to +10% | 65% | 42% | 38% | 18% |
| +10% to +20% | 48% | 25% | 22% | 8% |
This matrix provides immediate visibility into price sensitivity. For example, the enterprise core segment shows a gradual decline in win rates (72% to 65% to 48%), indicating moderate elasticity. In contrast, the mid-market add-on segment experiences a sharp drop (31% to 18% to 8%), reflecting high sensitivity.
Renewal rates, expansion revenue, and sales cycle impact by price band are worth tracking alongside win rates. Deals won at deep discounts may close, but they often show lower renewal rates, lower expansion revenue, and longer sales cycles. One Revology client found that deals closed at a 30% discount had 3-month-longer sales cycles, lower renewal rates, and 40% lower expansion revenue than deals closed at a 10% discount.
Worked Example: Diagnosing Sensitivity in a B2B Pricing Model
A global manufacturing company sells industrial components through direct and distribution channels to mid-market customers across three regions. In Q1 2026, discount rates in the Power Systems product family rose from 18% to 28%, yet win rates fell. Leadership asked: “Are customers more price-sensitive, or is something else happening?”
Finding 1: Sensitivity increased only in one subsegment.
Segmenting by customer size and geography revealed the real pattern:
• North America large accounts (>$1M annual spend): discount rate stable at 18–20%, win rates stable at 68–72%
• North America mid-market ($100K–$1M): discount rate rose from 15% to 30%, win rates fell from 65% to 48%
• Europe and Asia-Pacific: no significant change
The problem wasn’t enterprise-wide sensitivity, but rather North American mid-market-specific.
Finding 2: Competitor presence explained the pattern.
Win-loss analysis revealed that a new low-cost competitor entered the North American mid-market in early 2025. Large accounts didn’t face the same threat (the competitor’s solution didn’t fit their complex requirements). Europe and the Asia-Pacific hadn’t seen the competitor yet. The sales team, facing new competition, reflexively matched discounts.
Finding 3: The discount wasn’t working
Despite deeper discounts, win rates fell. Customers who could be won at a 20% discount were offered a 30% upfront discount. The competitor’s price advantage was structural. Customers who switched cited concerns about integration and support, not price.
Recommended actions
For North America mid-market:
1. Create an Essentials tier (fewer features, lower price, higher margin) and a Premium tier (full features, higher price, higher customer success)
2. Tighten exception governance: discount band capped at -15%, requiring director approval beyond
3. Develop a competitive playbook: “Your concerns about integration are valid. Competitor X doesn’t support legacy systems. Here’s what we provide.”
4. Pilot outcome-based contracts: base price $150K plus 10% of documented cost savings if solution delivers >10% annual efficiency gains
For large accounts and other regions: hold list prices and increase marketing investment.
Results (Q3 2026, three months into rollout)
• Mid-market win rates improved to 56%
• Realized price improved to 79% (from 72%)
• Essentials tier captured 18% of mid-market deals at 85% realized price
• Premium tier maintained 82% realized price and higher expansion revenue
• Sales cycles extended 1.5 weeks, but close rates were 5% higher
Key takeaway: Rising discounts and declining win rates did not indicate increased market price sensitivity. Instead, sales responded to competitive pressure with ineffective tactics. Accurate diagnosis required segment-level data, win-loss analysis, and identification of root causes before implementing changes.
How to Respond When Buyers Are Highly Price Sensitive
When data indicates that buyers in a segment have limited willingness to pay, avoid immediate list-price reductions. Price cuts are broad and often permanent. Instead, use targeted tactics such as packaging, price fencing, and offer redesign.
Packaging means bundling features, services, or terms to align with customer value tiers. Instead of one $100K product, offer Starter ($50K), Professional ($85K), and Enterprise ($150K). Customers self-select based on their willingness to pay, capturing more revenue than a single price would.
Price fences are features or terms that prevent arbitrage. The Starter tier has a monthly contract (with an exit optionality fee for the buyer); Professional has a 2-year contract at a lower all-in price. Customers needing flexibility pay a premium; those willing to commit pay less.
Offer architecture redesign means changing what’s included in the base and add-ons. A software company might move premium analytics from the base to add-ons. This lowers the barrier to entry and increases realization for feature-heavy deals.
A CPG beverage brand offered retailers different tiers: volume discount tier (1M+ cases, -15%, weekly commitments), promotional support tier (regular list price plus co-funding displays), and hybrid tier (-8% plus moderate co-marketing). Different retailers chose different tiers based on their business model.
Tighten discount governance without stopping sales by creating a framework that ties discounts to deal characteristics:
• Tier 1 (no exception): Up to -10% for new customers, any segment, any deal size
• Tier 2 (sales manager approval): -10% to -20%, new customers or large renewals (>$500K)
• Tier 3 (director approval): -20% to -30%, only strategic accounts or high-retention-risk
• Tier 4 (CFO approval): Below -30%, only defensive scenarios ($1M+ annual account)
This approach increases visibility without creating unnecessary barriers. Pair it with clear guidelines on non-price terms such as payment terms, contract length, and service bundling.
Equip sales teams with value messaging and negotiation guidelines. When a salesperson hears “Your price is 20% too high,” the appropriate response is to ask for clarification, such as “Let’s step back and discuss your objectives.” Value messaging training helps sales representatives focus on business outcomes, quantify impact for the buyer, and keep discussions centered on value rather than price. Once customers understand this value, price discussions become more productive.
Pitfalls That Distort Price Sensitivity Analysis
Do not confuse procurement pressure with true willingness to pay. Procurement officers are often required to negotiate for lower prices, regardless of their personal assessment of fairness. Mistaking negotiation tactics for actual willingness to pay can lead to poor pricing decisions. Effective sellers distinguish between negotiation roles and genuine economic constraints, responding with, “I understand cost pressure. What I have found is that when we align on your business outcome, cost becomes secondary. Let’s talk about your efficiency target.”
Avoid relying on averages that obscure segment differences. A single elasticity value, such as -1.04, may conceal segments with -0.5 (inelastic) and -1.5 (highly elastic). Uniform pricing across all segments can result in lost revenue. Instead, segment by customer size, product, geography, channel, and buying stage, and estimate elasticity for each segment.
Do not overlook implementation, service, and contract variables. Price is only one aspect of the offer. Implementation complexity, service level agreements, contract terms, support quality, and training all influence customer decisions. A lower-priced quote with extended implementation and limited support may be less attractive than a higher-priced offer with faster implementation and comprehensive support. When analyzing price sensitivity, include these commercial terms in your model.
Implementation Roadmap for Commercial Teams
First 30 days: baseline analysis and data cleanup
Week 1:
1. Convene your commercial team. Agree on the business question: “What is our price sensitivity by segment?”
2. Inventory data sources: quotes, transaction data, deal outcomes, CRM
3. Define initial segmentation: by customer size, product, geography, channel
Week 2–3:
1. Pull 24 months of transaction data
2. Build analysis table: by segment, show average list price, net price, discount rate, deal count, win rate
3. Fix data quality issues
Week 4:
1. Run preliminary elasticity analysis by segment
2. Present findings to leadership
3. Plan Week 5 forward
Data cleanup checklist:
☐ All quotes have a customer segment
☐ All closed deals have an outcome
☐ All transactions have a list price, a net price, and a calculated discount rate
☐ Win-loss data is at least 70% complete
Days 31–60: segmentation, KPI design, and pilot actions
Week 5:
1. Run win-loss analysis: interview 20–30 lost deals
2. Analyze wins that took deep discounts vs. modest discounts
3. Develop refined segmentation
Week 6:
1. Design KPI dashboard: price realization by segment, win rate by price band, average discount rate, sales cycle length, renewal rate, and expansion revenue
2. Build a dashboard in your analytics tool
3. Run baseline measurement
Week 7–8:
1.2. Build a dashboard in your analytics tool to define success criteria
3. Launch pilots in one region, product family, or sales cohort
KPI dashboard checklist:
☐ Daily price realization tracked by segment
☐ Weekly win rate by price band
☐ Monthly discount rate and depth by segment
☐ Monthly sales cycle length by segment
☐ Quarterly renewal and expansion revenue
Days 61–90: rollout, governance, and review cadence
Week 9:
1. Review pilot results
2. Adjust tactics based on learnings
3. Brief sales leadership
Week 10:
1. Roll out governance changes enterprise-wide
2. Launch offer redesign if piloted successfully
3. Brief the full sales team
Week 11:
1. Launch quarterly review cadence (monthly reali3. Brief the full sales teamcity refresh)
2. Create accountability: sales managers’ own realization targets
3. Train reps on value messaging and negotiation guardrails
Week 12:
1. Document what worked and what didn’t
2. Plan Q2 improvements
3. Share results with the board
Implementation checklist:
☐ Discount governance documen3. Share results with the board dashboard live and reviewed weekly
☐ Win-loss analysis completed for 20+ deals
☐ Pilot actions defined and tracked
☐ Sales team trained on value messaging
☐ Monthly and quarterly review cadence established
FAQ About B2B Buyer Price Sensitivity Behavior
What is B2B buyer price sensitivity behavior?
B2B buyer price sensitivity behavior is how business customers change buying behavior when prices or commercial terms change. It encompasses shifts in purchase likelihood, deal size, product mix, and negotiation intensity in response to price, discounts, contract terms, and competitive alternatives. Unlike consumer price sensitivity, B2B sensitivity is highly context-dependent: it varies by customer segment, product type, competitive alternatives, procurement dynamics, and buying stage.
How is B2B price sensitivity different from consumer price sensitivity?
B2B buying usually involves negotiated prices, multiple stakeholders, contracts, switching costs, and non-price terms, so sensitivity is more context-dependent. A consumer buying cereal sees three options and picks based on price and preference. A business buyer purchasing software undertakes a multi-month evaluation, involves technical and financial stakeholders, evaluates integration and support, and signs a multi-year contract. The evaluation is longer, the decision criteria are broader, and once committed, switching costs are high. B2B sensitivity is less about a single price point and more about the total package and the buyer’s confidence in value delivery. rice points, deeper discount requests, lower win rates at historical prices, smaller order sizes, delayed decisions, and mix shifts toward lower-priced options are signals. But be careful: rising discount requests may reflect sales-team behavior or competitive pressure rather than a true shift in willingness to pay. Segment the data to distinguish signal from noise.
Signals that buyer price sensitivity is increasing
Higher quote rejection, deeper discount requests, lower win rates, smaller deals, delayed decisions, and mix shifts are signals. Distinguish these from sales behavior patterns or competitive entry.
How to quantify price sensitivity by segment and deal stage
Quantification requires segmenting your market first—by customer size, product, geography, and buying stage—then running elasticity analysis separately within each segment. A single enterprise-wide elasticity number masks critical variation.
What commercial teams should do when sensitivity changes
Update price guidance, tighten or relax discount guardrails (depending on direction), redesign offers, refine segmentation, and run controlled price tests before rolling out enterprise-wide. Don’t reflexively cut the list price. Investigate root causes first: Is it true that sensitivities, budget pressure increased, or sales execution (team over-discounting, weak value story)?
Why is net price more important than list price?
Net price captures the actual economic outcome after discounts, rebates, freight, payment terms, and other concessions. A $100,000 list price with a 35% average discount realizes at $65,000. A 1% improvement in price realization produces a 6–7% lift in operating profit—leverage that compounds across volume and fixed costs.
Can discounting data alone measure willingness-to-pay?
No. Discounting data is useful, but it must be interpreted alongside win-loss outcomes, competitive context, product mix, and sales behavior. A team granting 35% discounts may have actually closed 70% of those deals at 15% discount. Interpretation requires context: did the discount cause the win, or were these deals destined to win anyway?
What is the best unit of analysis for B2B price sensitivity?
Usually, customers are segmented by product or offer, with separate views for channel, region, and deal stage. Segment first, then estimate sensitivity within each segment.
How often should teams refresh price sensitivity analysis?
At a minimum, quarterly; more often in volatile markets, high-frequency quoting environments, or during major competitive changes. In fast-moving markets (such as SaaS and semiconductors), monthly elasticity updates are warranted. In stable industries, a quarterly or semi-annual refresh is sufficient.
Conclusion: Turning Buyer Behavior Into Better Pricing Decisions
Price sensitivity in B2B should be measured on net price and total commercial terms, not just list price. It may reflect poor targeting, weak value communication, approval friction, or competitor actions. The most useful signals come from transaction data, win-loss patterns, quote-to-close behavior, and discount curves, interpreted in the context of competitive activity and mix changes by customer and product.
Every case study in this article points to the same conclusion: granular segmentationEvery case study in this article points to the same conclusion: granular segmentation reveals what broad averages hide. The technology company whose enterprise products were inelastic, while consumer products were elastic. The pharma company needed a different strategy for prescription products than for OTC products. The manufacturer whose mid-market sensitivity was driven by one competitor, not by a market-wide shift. None of these insights would have surfaced in an enterprise-wide average. nt bands, segment-specific price guidance, offer redesign, exception governance, and targeted testing. A 1% improvement in price realization lifts operating profit by 6-7%, or 10-11% in less regulated industries. That kind of leverage is hard to match with cost-reduction or volume-growth initiatives alone.
| Key Takeaways for Pricing and Revenue Leaders: Measure price sensitivity on net price and total commercial terms, not just list price. Do not assume that rising deal resistance indicates a decline in willingness-to-pay. Investigate root causes first. Sensitivity varies by segment, account, product family, order size, channel, and buying stage. One enterprise-wide average is usually misleading. Connect measurement to guardrails: revised discount bands, segment-specific price guidance, offer redesign, exception governance, and targeted testing. |
If you lack clear visibility into price sensitivity, begin with analysis. Use the first 30 days to build a data foundation, segment your market, and identify areas of high and low sensitivity. If you already have robust data but have not acted on it, prioritize pricing redesign. If you are already implementing changes, continue your efforts. The benefits increase as you progress from diagnosis to execution.