Discover how to select the most effective pricing approach using practical frameworks, KPIs, real-world examples, and an implementation roadmap tailored for B2B teams.
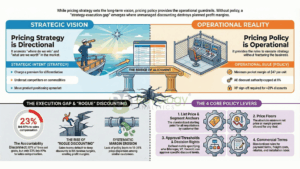
Key takeaway: Without strategic oversight, pricing quietly erodes profits.
Effective pricing is intentional. Start by defining optimal pricing for your business, based on your model, customers, and goals.
Key takeaway: Apply structured frameworks to avoid pricing pitfalls and drive effective initiatives.
What “Best Pricing” Actually Means
Optimal pricing is about alignment, not perfection. It is the price level, structure, and governance that best support your business objectives within your market and competitive landscape.
Confusing pricing strategy, model, and level often causes errors and costly mistakes.
Strategy defines your approach, model defines packaging and segmentation, and price level is the customer-facing amount.
Teams often confuse decisions at different pricing levels. For example, adopting a competitive pricing strategy without segmenting customers by willingness to pay can weaken margins. Similarly, implementing a value-based model while setting prices with cost-plus logic can result in lost revenue opportunities.
Key takeaway: Match pricing approach directly to goals and market realities.
Key takeaway: Always tailor pricing strategy to your business context.
Why Pricing Matters More Than Most Growth Levers
Executives are often misled by apparent pricing stability. While revenue and margins may appear steady, Revology’s research of 2,000 global companies shows that a 1% improvement in price realization increases operating profit by 6–7%, and by 10–11% outside highly regulated industries. This 1% improvement has a significantly greater impact on EBITDA than a comparable increase in unit sales.
Growth discussions often emphasize volume—winning more deals, increasing conversion, or expanding the sales team. While important, pricing directly impacts profit rather than volume. For example, a $100M revenue company with a 20% gross margin that improves price realization by 1.5% adds $300K in annual operating profit, equivalent to closing six additional $50K deals without incurring extra costs.
Key takeaway: Pricing shapes both financial performance and brand perception.
Pricing influences a range of downstream decisions, such as market entry, investment in product development, sales enablement spending, bundling strategies, and acceptable sales cycle lengths. Ultimately, pricing shapes the entire business model.
The Four Core Pricing Approaches to Know
Key takeaway: Learn these four types to build effective pricing strategies.
Cost-plus pricing sets the price as a markup over unit cost. It’s mechanically simple and operationally transparent; everyone can understand it. But it decouples price from customer value, ignores competition, and penalizes efficiency. Lower your manufacturing cost, and you’re compelled to cut prices, even though customer willingness to pay hasn’t changed. Cost-plus works best in stable commodity markets with clear, standardized cost structures and low customer value differentiation.
Competitive pricing benchmarks your price against direct competitors. It’s practical and defensive: you know you’re in the ballpark of the market. But it assumes competitors are right and pushes all players toward the same price, eroding margins across the industry. Competitor prices also signal their cost structure and profit targets, not your own. Competitive pricing works best in crowded categories where customers compare prices directly and product differentiation is minimal.
Value-based pricing sets the price based on the customer’s willingness to pay, typically derived from the economic value your product creates. A CRM that saves a customer $500K per year in sales productivity might support a $100K annual fee. Value-based pricing captures upside from your innovation and aligns seller and buyer incentives: you profit when customers benefit. The challenge is accurately estimating value and segmenting customers by their ability to realize it. Value-based pricing works best for differentiated offers with measurable customer outcomes and segmentable customer bases.
Dynamic price optimization adjusts prices in real-time based on demand, inventory, competitive activity, and customer characteristics. Ride-sharing platforms, airlines, and e-commerce retailers use this constantly. It maximizes revenue and margin in the moment but requires operational sophistication and real-time data. Transparent dynamic pricing can damage brand trust if customers feel exploited. Dynamic price optimization works best in high-volume, transactional markets with significant demand fluctuation and transparent, trustworthy positioning.
Key takeaway: Blending strategies helps balance growth, margin, and risk.
The Strategic Pricing Matrix: four core approaches with definitions, best-use cases, pros, and cons.
When Each Pricing Method Works Best
Cost-plus pricing is most effective in stable, low-differentiation markets such as manufacturing, commodity chemicals, and regulated utilities, where value is commoditized, and cost structures are standardized. If your product is genuinely undifferentiated and cost is the main variable, cost-plus is efficient. However, validate this assumption, as customers may perceive meaningful differences even in seemingly commoditized markets.
Competitive pricing is prevalent in crowded segments where benchmarking is transparent, such as consumer electronics, SaaS tools, and standardized B2B services. Customers in these markets actively compare alternatives, making price a key decision factor. Use competitive data to set guardrails, but do not rely on it exclusively; otherwise, you risk becoming a price follower rather than a strategist. Refer to the competitive analysis 2026 pricing best practices for rigorous benchmarking.
Value-based pricing captures margin in differentiated markets. Custom software, premium consumer goods, and specialized B2B services use value-based pricing because their products create specific, measurable value that varies by customer segment. A Veblen good, where a higher price increases desirability, exemplifies the extreme case. One premium dairy brand used Price-Value Mapping and Conjoint analysis to find that customers had an elasticity of -0.6 (highly inelastic). A $0.50 price increase was safe; a $1.00 increase would result in a 40% loss of preference share. Understanding value, not guessing price, let them optimize.
Key Insight: Premium brands with inelastic demand (elasticity between -0.3 and -0.6) can increase prices by 10% and lose only 6% in unit volume, resulting in a clear margin gain. However, always validate elasticity through research rather than relying on intuition.
Dynamic price optimization thrives in transactional, high-velocity markets. Ride-sharing, hospitality, and ticketing use dynamic pricing because demand fluctuates constantly, inventory decays (an empty hotel room at midnight is worthless), and customers accept price variation. For B2B, dynamic tactics work in distribution and high-SKU environments where you can segment customers and adjust prices by channel, volume, and timing without eroding trust. See dynamic pricing for B2B for real-time B2B applications.
High level value-based pricing framework: we ideally should capture the margin opportunity between our comp reference prices and research-based customer willingness to pay (WTP)
A Practical Framework to Determine the Best Pricing Approach
Use this four-step process to determine which pricing method best serves your business.
Step 1: Clarify business objective and constraints. Are you defending margin, capturing new share, entering a new segment, or establishing a premium position? Each objective prioritizes different pricing methods. Margin defense favors value-based and governance-driven approaches. Share capture often requires competitive or promotional pricing. Premium positioning requires confidence in inelasticity and willingness to absorb unit decline.
Identify hard constraints: regulatory price floors, franchise agreements, cost-to-serve below which deals are unprofitable, and competitive ceilings where you lose all deals above a price. These aren’t failures. They’re guardrails that narrow the reasonable range.
Step 2: Segment customers, products, and channels. Homogeneous pricing is almost always wrong. Different customer segments have different willingness to pay, different cost-to-serve, and different competitive options. A transactional customer who buys commodity volumes wants competitive pricing; a strategic partner who relies on your product for core operations can support value-based pricing.
Segment your customer base by type (small business, mid-market, enterprise), product (core offering, add-on, premium tier), and channel (direct, reseller, e-commerce). The appropriate pricing logic often varies across these dimensions.
Step 3: Select pricing logic and guardrails. Based on objectives, constraints, and segments, assign a primary pricing method to each segment-product-channel combination. Then set guardrails: minimum margin, maximum discount depth and frequency, approval rules for exceptions, and review cadence.
A mid-market CPG beverage manufacturer with 1,800 deal lines experienced pricing drift due to ad-hoc discounting. They deployed Double Machine Learning (DML) elasticity models and driver-based decomposition to identify which deals were price-sensitive and which drivers (volume, payment terms, packaging) were truly price-elastic. Then they built guardrails: segment-specific price floors, maximum discount caps per customer, and monthly monitoring. The result: $5M in annualized value (18.2x ROI), split between $2M in promo efficiency gains and $3M in net price realization improvement.
Step 4: Test, monitor, and refine. Implement pilots with new customer cohorts or regions before a full rollout. Track win rate, price realization, and customer satisfaction weekly, and adjust guardrails quarterly. Pricing requires ongoing management and adaptation to market feedback.
Data Inputs Required for Better Pricing Decisions
Data is essential for effective pricing. While many companies lack an organized way to access their existing data, most already have the information they need in their systems.
Cost-to-serve, unit economics, and margin floors. What does it truly cost to fulfill this customer’s order? Include manufacturing, fulfillment, support, and return handling. Many companies set prices without knowing their own cost structure by customer segment. A customer that demands weekly shipments, custom packaging, and 60-day payment terms has a 3x higher cost-to-serve than a standard customer, yet gets the same price. Cost-to-serve transparency immediately identifies unprofitable customers and sets a hard price floor.
Assessing customer willingness to pay and value drivers can be challenging, but it is essential. Techniques such as economic value modeling, conjoint analysis, and price-sensitivity research help measure willingness to pay. Advanced econometrics is not always required; even simple surveys can provide valuable insights. Recognize that customer value varies across segments to effectively price.
Competitor price benchmarks and market signals. Use tools to monitor competitor pricing in real-time. Revology’s pricing surveillance capabilities track competitive moves, promotional calendars, and channel pricing. This informs guardrails and alerts you when the market shifts. But competitor prices should inform your strategy, not drive it. They’re one input among many.
Analyze transaction history, discounting practices, and channel mix to identify patterns. Review which discounts were granted, customer price sensitivity, channel win rates, and deal closure times. For example, if your data shows higher price elasticity to promotions than to base price changes, as seen in 82% of consumer electronics SKUs, focus on optimizing promotions.
KPIs to Evaluate Whether Pricing Is Working
Three categories of metrics indicate whether pricing is healthy.
Margin metrics include gross margin, pocket margin (gross margin minus cost-to-serve), and price realization (actual selling price divided by list price). For example, if the list price is $100 and the average selling price is $85, there is a 15% pricing leakage. Monitor these metrics monthly. Revology’s analysis indicates that a 1% improvement in price realization yields a 6–7% increase in operating profit (10–11% outside regulated industries), making it one of the most impactful metrics.
Volume and win metrics include win rate (percentage of deals closed), conversion rate (pipeline-to-revenue), average deal size, and sales cycle length. Pricing changes can impact these metrics. For instance, a 10% price increase may reduce the win rate by 5%, which is acceptable if the average selling price rises by 10%. Monitor the entire system, not just pricing.
Mix and quality metrics include average selling price by segment, discount rate (total discounts divided by revenue), mix shift (changes in SKU or channel composition), retention, expansion, and revenue quality (percentage of revenue from high-margin segments). These metrics indicate the sustainability of pricing changes. Aggressive discounting may yield short-term gains but can undermine long-term customer economics and retention.
Measure all three categories monthly. Use pricing policy strategies guidance to set thresholds: gross margin should not fall below 35%, price realization should remain above 92%, and win rate should not drop more than 3% for a 10% price increase.
Good-Better-Best Pricing and Tier Design
Good-Better-Best is a tiered packaging strategy offering three product versions at distinct price points: Good (core offering), Better (full feature set), and Best (premium features with dedicated support or customization).
This approach segments customers by willingness to pay without requiring negotiation. Some customers choose premium features at higher prices, while others prefer basic functionality at a lower cost. Offering a single package risks setting prices too high for price-sensitive customers or too low for value-seeking customers, resulting in lost margin.
The primary challenge is avoiding cannibalization. If Good and Better are too similar, most customers will select Good. If Better and Best overlap, market confusion may result. Each tier should be clearly differentiated: Good offers limited features and support, Better provides full features with community support, and Best includes dedicated support and custom integrations.
A B2B SaaS company tested Good-Better-Best and found that 70% of new customers chose Better, the middle tier. That’s a healthy distribution. If 90% chose Good, the tier design is wrong; if 90% chose Best, you’re leaving margin on the table by not adding a Premium tier above it.
Good-Better-Best also reinforces market positioning. Three price tiers communicate that the company addresses diverse customer needs, not just varying budgets. For example, a mid-market electronics distributor implemented this strategy and increased average deal size by 23% as customers upgraded to Better or Best, while maintaining a stable win rate.
Good-Better-Best tier architecture example: Essentials, Professional, and Enterprise with enforceable fences.
Worked Example: Choosing the Best Pricing Strategy for a B2B Offer
Here’s the framework in action. Assume you’re a B2B software company selling to mid-market manufacturers.
Scenario Setup
Business context and baseline metrics: You have 150 customers with an average annual contract value (ACV) of $40K. Annual revenue is $6M with 60% gross margin ($3.6M). Sales cycle runs 4-5 months. Win rate is 45%. Your top 20% of customers generate 60% of revenue; 40% are small, transactional accounts.
Baseline KPIs: Price realization is 88% (sales discounts average 12%). Gross margin by segment: enterprise customers average 65%, SMB customers average 50% (due to higher support costs on smaller deals). Win rate by segment: Enterprise 60%, SMB 35%.
Comparing Three Pricing Options
Option A: Pure Competitive Pricing. You price 5% below the market leader. ACV drops to $38K. Win rate increases to 52%. Gross margin stays at 60%, but price realization worsens because sales know they’re already discounted. This strategy grows volume but erodes unit economics.
Option B: Value-Based Pricing with Segmentation. You build two offer tiers: Core (for SMB, full support) at $30K ACV, and Advanced (for Enterprise, dedicated support plus custom integrations) at $65K ACV. You research that Enterprise customers realize $400K in annual productivity savings from your software; a $65K price captures 16% of that value, which is reasonable. SMB customers realize $120K savings; $30K captures 25%, a premium justified by full support.
Core win rate for SMB might be 40% (some resist the value claim). The advanced win rate for Enterprise might be 70% (high perceived value). Mix: 70% SMB, 30% Enterprise. New blended ACV is $41K (slightly up). New blended gross margin is 62% (support costs are optimized by tier). Price realization improves to 94% because pricing is anchored to value, not competition. The new blended win rate is 50%.
Option C: Good-Better-Best Tiered Model. Good ($25K ACV): Core features, email support, SMB segment. Better ($45K ACV): Full features, chat plus phone support, mid-market segment. Best ($80K ACV): Full features, dedicated support, custom integrations, and the Enterprise segment.
Expected segmentation: 50% to Good (SMB), 35% to Better (mid-market), 15% to Best (Enterprise). Blended ACV is $45K (up 12%). Gross margins: Good 55%, Better 62%, Best 70% (dedicated support adds cost but enables premium positioning). Blended gross margin 61%. Price realization improves to 95% (tiers reduce negotiation pressure). Win rates: Good 50%, Better 55%, Best 65%, blended 54%.
Recommended Decision and Expected Impact
Option C (Good-Better-Best) is the most effective, increasing ACV by 12%, improving win rate by 9%, preserving margin, and reducing discounting pressure. The tradeoff is the need to clearly define the value of each tier and train the sales team on the tier structure.
Implement strict tier guardrails: $25K minimum for Good, $45K for Better, and $80K for Best, with no cross-tier discounting. Monitor ACV, gross margin, and win rate by tier monthly. If the Good tier win rate drops below 40% or the Best falls below 60%, adjust tier positioning in the next quarter.
What to Communicate Internally and Externally
Expected financial impact: With 150 customers and a 12% ACV increase, annual revenue rises by $72K. At a 62% margin, this adds $44K in operating profit. Improved pricing governance can compound these gains. If price realization increases from 88% to 95%, this represents 7% of existing revenue ($420K) at a 60% margin, resulting in an additional $252K in operating profit.
The $252K pricing pivot, comparing competitive, value-based, and Good-Better-Best options.
Common Pricing Pitfalls and How to Avoid Them
Copying competitors without understanding value is a common pitfall. Sales may advocate for matching competitor prices, but competitors often have different cost structures, customer segments, or strategic objectives. Matching prices without understanding these factors can be detrimental. Instead, analyze the rationale behind competitor pricing and use competitive data as a guardrail, not as your primary strategy.
Over-discounting and weak governance. Sales closes more deals with discounts. Individually reasonable. Collectively, they erode margin systematically, which is pricing drift in action. Guardrails prevent this: max discount caps per customer, exception approval workflows, and monthly dashboards showing discount trends. Companies with formal pricing governance capture 2-4% more margin than those without. Check pricing, quick wins for distributors for practical governance templates.
Ignoring segmentation and channel differences hinders optimization. Different customer segments have varying willingness to pay and cost-to-serve. Partner channels may require deeper margins, while direct-to-enterprise channels can support premium pricing. Failing to account for these differences can lead to under- or overpricing specific segments.
Implementing pricing changes without proper enablement or measurement often leads to failure. Sales teams must understand the rationale and adhere to guardrails, while customers need clear communication about new tiers. Successful pricing changes require sales enablement, effective customer communication, and ongoing measurement through dashboards tracking adoption and KPIs. Allocate at least 10% of the project timeline to enablement for best results.
Implementation Roadmap for Pricing Changes
Most pricing changes fail when treated as one-time events rather than as disciplined processes. Follow this 90-day roadmap for effective implementation.
30-Day Diagnostic and Hypothesis Setting. Week 1-2: Analyze existing pricing, discounting, and margin data. Segment customers by revenue, margin, win rate, and cost-to-serve. Week 3: Research customer willingness to pay (even simple surveys work: “What would you pay?”). Benchmark competitors. Week 4: Form a cross-functional team (Sales, Finance, Product, Marketing) and set a hypothesis. Something like: “We believe moving to value-based pricing with segmentation will increase ACV 10% and improve price realization by 5%.”
60-Day Analysis, Design, and Stakeholder Alignment. Week 5-6: Build financial models for each pricing option (competitive, value-based, tiered). Show impact on ACV, win rate, gross margin, and operating profit. Week 7: Design the new pricing structure. Define tiers or segments. Write the customer value messaging. Week 8: Align stakeholders. Present to Sales leadership, Finance, and C-suite. Address objections head-on. Brief customer advisory boards to gauge reaction.
90-Day Pilot, Rollout, and KPI Review. Week 9-10: Launch as a pilot with one Sales team or geography. Monitor daily: win rate, ACV, deal velocity, customer feedback. Week 11: Adjust based on pilot findings. Then roll out firmwide. Week 12: Monthly review. Did we hit our hypothesis? If ACV is up 8% instead of 10%, is that acceptable? If the win rate dropped 7%, do we adjust? Document learnings. Plan Q2 refinements.
The Four-Step Execution Framework: Clarify, Segment, Select, Refine in a continuous iteration cycle.
Tools, Governance, and Operating Cadence
Competitive pricing tools and data sources. Use tools to monitor competitor prices, promotional calendars, and channel pricing. Revology’s pricing surveillance delivers real-time competitor intelligence. Gartner, Forrester, and Dun & Bradstreet provide industry benchmarks. In-house surveys via Qualtrics or SurveyMonkey measure willingness to pay. Your own transaction data is your best asset. Analyze it relentlessly.
Approval rules, exception handling, establish clear approval rules, exception handling procedures, and discount controls. Allow sales to discount up to 10% without approval; 10-20% requires Regional Manager authorization, and discounts above 20% require approval from VP Sales and Finance. Document all exceptions to ensure accountability and identify patterns. For example, if most exceptions cite customer budget constraints, this may indicate a need to adjust price positioning. Monthly: Analyze pricing metrics (ACV, win rate, price realization, margin by segment). Quarterly: Benchmark competitors and review customer feedback. Annually: Audit pricing strategy. Is it still aligned with market conditions and business objectives? Do you need to adjust tiers, guardrails, or the primary pricing method? Pricing is dynamic. Market moves. Your strategy should move with it.
Practitioner Note: A common failure is conducting quarterly reviews without follow-up action. Assign a pricing owner, such as a VP Commercial or Director of Pricing, who is responsible for implementing review findings within 30 days. Governance must be paired with accountability to be effective.
Buying advanced CPQ or AI pricing engines before establishing rules is the fastest way to automate margin erosion.
FAQ About Best Pricing
What is the meaning of best pricing?
Best pricing is the price level, structure, and governance that best serve your business objective within your market and competitive context. It’s not the highest or the lowest price. It’s the price that optimizes for your specific goals (margin, share, retention, or positioning) while maintaining customer relationships and competitive viability.
What is the best pricing method?
There is no single best pricing method. The right method depends on your business objective, market, and customer segments. Cost-plus works for commodity markets. Competitive pricing works for crowded categories. Value-based pricing works for differentiated offers. Dynamic pricing works for transactional, high-velocity markets. Most businesses use a hybrid: value-based strategy with competitive guardrails and cost-plus floors.
What is the 80/20 rule for pricing?
The 80/20 rule in pricing stems from the Pareto principle: 80% of your profits typically come from 20% of your customers. This means your most profitable customers have different characteristics, willingness to pay, and cost-to-serve than your least profitable. Use this insight to segment pricing. Your top 20% can support premium pricing or premium service levels. Your bottom 20% might need lower prices or self-service models. Pricing should reflect these differences, not ignore them.
What are the 4 types of pricing?
The four core pricing methods are cost-plus (price as a markup over cost), competitive pricing (price relative to competitors), value-based pricing (price based on customer willingness to pay and perceived value), and dynamic pricing (price adjusted in real-time based on demand, inventory, and market conditions). Most B2B teams use a hybrid strategy combining elements of all four.
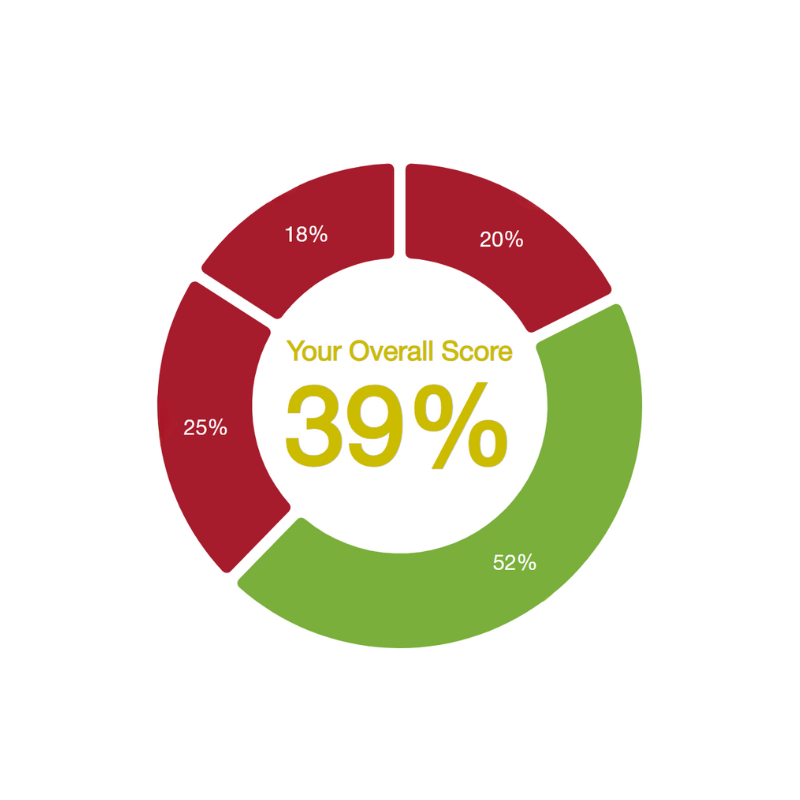
Diagnostic Checklist: Is Your Pricing System Healthy?
Ask yourself:
• Do you segment pricing by customer type, product tier, or channel?
• Can you articulate why each price is set at its level (not just “the market is at X”)?
• Do you measure price realization (actual selling price as % of list price) monthly?
• Does your sales team have clear guardrails: max discount depth, approval workflows, forbidden tactics?
• Have you researched customer willingness to pay in the last 12 months?
• Do you know your cost-to-serve by customer segment?
• Is your gross margin stable month-over-month, or does it drift?
• Do you review pricing strategy quarterly, not annually?
If you checked fewer than five items, pricing drift is likely occurring, and your business may be losing margin. Pricing for Your Business
Start with the diagnostic above. If you identified gaps, the next step is structured pricing. Begin with the diagnostic checklist above. If gaps are identified, proceed with a structured pricing analysis: segment your customer base, research willingness-to-pay, calculate cost-to-serve, and model pricing scenarios. This process typically takes 30-60 days and can reveal 1-3 pricing levers that can increase operating profit by 2-5%. It can also reveal structures and governance frameworks that sales teams actually follow. Most teams find that pricing optimization compounds: the first round delivers $1-3M in annual profit improvement, and systematic quarterly reviews capture incremental gains thereafter.
If you are ready to assess your pricing system, complete the pricing quick wins assessment for a 20-minute overview. For more comprehensive strategy development, contact us to discuss your pricing objectives. Effective pricing is intentional, rigorously measured, and refined quarterly. Companies that follow this approach consistently outperform competitors by 200-400 basis points in margin.