

Overview: Pricing power in Practice
This article from Revology Analytics explains pricing power in the context of modern pricing analytics and revenue growth management. It draws on real engagements with mid-market and enterprise clients to turn pricing power from a buzzword into a measurable commercial capability. Read on for the full perspective, and see our related reading for additional depth.
Situation
A Fortune 500 global pharmaceutical manufacturer’s ~$5B emerging-markets division runs across Latin America, Asia, Africa, the Middle East, and Russia/CIS. Its portfolio of established branded-generic therapies spans dozens of countries. Every country has its own regulatory regime (government price ceilings, International Reference Pricing corridors, or fully deregulated out-of-pocket retail), its own inflation dynamic, and its own competitive set of local and global generic peers.
The brands have clear equity in most of these markets. Pricing, however, was being set by feel. Local country managers anchored to legacy list prices and rarely had causal elasticity evidence or rigorous competitive benchmarking in the room. In markets running 10 to 12% annual inflation, some flagship brands had held list prices flat for two years. That eroded differential value positioning by as much as 25% versus comparable competitor products. In other markets, competitor price increases on higher-strength products were outpacing the company’s, which compounded margin leakage as the portfolio aged.
Leadership brought in Revology Analytics to build a repeatable Pricing Quick Wins engine: an advanced analytics-driven framework that would move local teams from gut-feel pricing to evidence-based decisions, surface the highest-value opportunities market by market, and scale across the division.

Obstacles
Scaling a pricing capability across this footprint surfaced a distinct set of problems.
- Data fragmentation across markets. Sales, volume, and pricing data lived in silos, split across internal list-price systems, internal net-sales systems, and external prescription audits. Every country used its own conventions for strength, pack, channel, and customer classification. Cross-country benchmarking was effectively impossible without heavy harmonization.
- Product-equivalence complexity. In crowded generic markets, differing naming conventions, dosage forms, strengths, and standard units made it very hard to find true one-to-one competitor matches. Manual mapping was brittle, inconsistent, and impossible to maintain at scale.
- No causal elasticity signal. Simple year-over-year correlation was biased and unstable. It conflated price changes with competitor actions, detailing, stock-outs, seasonality, and currency devaluation. Local teams had no defensible basis for pricing moves.
- Regulatory patchwork. Pricing headroom varied sharply: strict ceilings in some Latin American countries, IRP corridors in others, and fully unregulated out-of-pocket private markets in a third group. Every recommendation had to be pressure-tested against local constraints.
- Pack-size blind spots. Inconsistent pricing across strengths and pack sizes had produced illogical price-pack discount curves over time. That left real margin on the table and distorted competitive positioning.

Action
The engagement was built to produce a repeatable pricing engine, not a one-off study.
Phase 1. Pilot scope and market selection
- Four diverse pilot markets. Spanning Latin America and Asia. We picked them deliberately to stress-test the methodology across different regulatory regimes, inflation environments, and competitive structures.
- Tight analytical scope. Around 25-50 client SKUs per country, enough to generate meaningful insights while keeping the pilot tightly bounded.
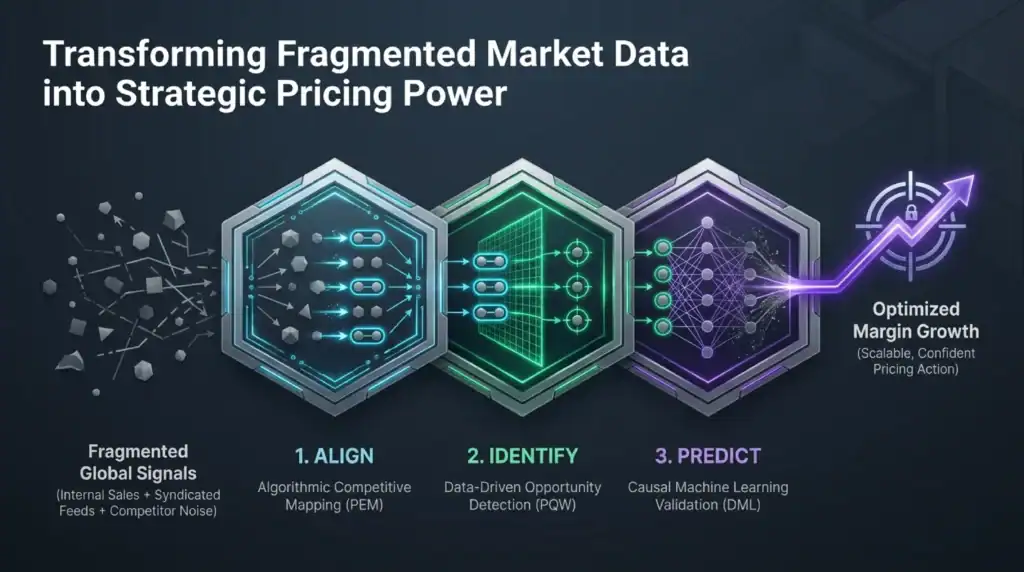
Phase 2. Product equivalence and Competitive Price Index
- Automated Product Equivalence Matrix (PEM). A rule-based engine with fuzzy/NLP matching that evaluates active ingredients, dosage forms, strengths, and therapeutic areas / ATC codes. It produces a 0 to 10 confidence score for every client-competitor product pair.
- Price per Defined Daily Dose (DDD). We equivalized prices to a common basis so the weighted Competitive Price Index is directly comparable across strengths, packs, and channels.
Phase 3. Causal elasticity engine
- Double Machine Learning (DML) as the primary method. Four to five years of monthly historical data, so 48 to 60 data points per SKU. DML strips away confounders (competitor actions, seasonality, stock-outs, promotional activity) before estimating the causal own-price elasticity.
- Pooled by therapeutic segment. This stabilizes estimates where individual SKUs have sparse data. We delivered trusted elasticity coefficients for 47 to 51 brand-channel combinations per pilot market.
Phase 4. Pack-size whitespace and inflation catch-up
- Portfolio screen for pack-size anomalies. Illogical price-pack ladders, missing tablet counts (10/30/60/90), and whitespace segments each valued at ~$1M USD annualized or more where the client has 0% share while competitors are active.
- Inflation-adjusted price move frame. Tracks cumulative inflation gaps over two-year windows. Flags brands where list-price stagnation has quietly eroded competitive positioning.
Phase 5. Interactive pricing simulators
- Country-specific Excel simulators. Local teams input proposed price changes and inflation catch-up percentages. The simulator returns median, best-case, and worst-case volume and revenue outcomes, bounded by the ML elasticity ranges and local regulatory caps.
- Pricing Quick Wins playbooks, per market. An executive-friendly summary of strategic guardrails, success-case opportunities, and execution priorities.

Results
The Pricing Quick Wins engine is now the division’s default pricing decision framework across the pilot markets. Additional-country rollouts have been planned already.
- ~$8M median revenue opportunity. Identified across the four pilot markets, with a best-case of ~$12M. Each opportunity is quantified at the SKU level with required price move, expected volume impact, and risk-adjusted confidence intervals.
- Specific brand-level success cases. ~$4M median opportunity on a flagship digestive-enzyme therapy by correcting the price-pack architecture between two key strengths. ~$1.5M on a women’s-health brand priced 50% below comparable therapies after two years of flat pricing, through a 15% competitive re-anchoring increase. ~$1MM on an extended-release psychiatric brand by enforcing a disciplined 30% price leadership premium over the immediate-release formulation. ~$1MM on a cardiovascular brand by right-sizing its position against branded competitor statins.
- Portfolio elasticity intelligence. The client’s first systematic, causal read on portfolio price sensitivity. The engine confirms that prescription therapies in these markets are meaningfully inelastic at roughly -0.45 own-price elasticity on average, which gives the commercial team a defensible basis to pursue inflation-aware pricing moves.
- In-house capability. Country-specific Excel simulators, coefficient files, PEM outputs, and methodology playbooks live with local commercial teams. They can run their own pricing moves on demand and repeat the analysis annually as inflation and the competitive set shift.

Related Reading
- Rebuilding Pricing and Promotion Analytics for a Global Data-Storage OEM
- Consumer: Food CPG – Case Study
For broader industry perspective on pricing analytics and revenue growth management, see McKinsey’s Growth, Marketing & Sales insights.