Overview: Promotion analytics in Practice
This article from Revology Analytics explains promotion analytics in the context of modern pricing analytics and revenue growth management. It draws on real engagements with mid-market and enterprise clients to turn promotion analytics from a buzzword into a measurable commercial capability. Read on for the full perspective, and see our related reading for additional depth.
Situation
A global data-storage OEM runs a ~$200M U.S. B2C hard-drive business anchored to a single dominant e-commerce marketplace. Over the prior 24 months, it had taken sustained pricing pressure. A massive divergence in storage economics opened up, driven by AI data-center demand squeezing supply in adjacent NAND categories. HDD list prices did not respond symmetrically and the consumer line bled margin. One flagship consumer HDD family saw a substantial net-pricing impact year-over-year from list-price cuts plus escalating discounting.
Promotional activity had also become indiscriminate. Roughly 45% of historical events were generating a 0 to 20% ROI, which means they losing 80 cents on the dollar for each promotional activity. Only ~12% of events were delivering highly accretive returns. Without a systematic, model-driven framework, the business was going to keep ceding margin to promotion-heavy peers in an oligopoly dominated by a handful of storage players, with no defensible basis for when to promote, how deep to go, or which drive families were worth defending.
Leadership set an explicit target: +1% to +3% net-revenue uplift and +1% to +2% EBITDA margin improvement inside 12 months. That is roughly $3M to $6M of incremental EBITDA, or a 10x to 20x return on the engagement investment. Revology was brought in to design and build the analytical engine and the RGM playbook required to hit those targets.

Obstacles
Building a durable pricing and promo capability against a dominant e-commerce marketplace surfaced several distinct problems.
- Granular elasticity signal was missing. Aggregated syndicated audit data understated true price elasticity because of heterogeneity bias. Averaging across SKUs, segments, and time periods obscured the real signal. The team needed SKU-level, time-granular data that reflected actual marketplace pricing dynamics, not syndicated aggregates.
- Promotional ROI was artificially distorted. Prior ROI methods produced artificially low, even negative, promo returns because they failed to credit promotions for unlocking access to massive seasonal demand spikes. They penalized the discount for volume that, in reality, required the discount to capture.
- Competitor surveillance gaps. Out of 184 tracked competitor model numbers, 44 consistently failed automated mapping, and roughly 25 marketplace listings were missing altogether. That left meaningful holes in competitive intelligence.
- Base and promotional elasticity were being conflated. Legacy models treated base-price and promotional-price elasticity as interchangeable. That drove revenue loss on list-price moves and mis-sized promo depth on promotional events. These are different behavioral signals and have to be modeled separately.
- No segmentation framework. There was no elasticity-based segmentation of the portfolio. Every drive family was being managed as if it behaved the same way. In reality, consumer drives are highly sensitive to own-price and promo, while enterprise/NAS drives are relatively inelastic and driven by specification-led buying.
- Durable-goods dynamics. Buyers in this category can wait for price drops. Static demand models miss that. We needed explicit controls for total addressable market, seasonality, and anticipatory purchasing behavior.

Action
The engagement was structured around analytical rigor, commercial realism, and executive-level change management.
Phase 1. Granular data acquisition
- ~156 weeks of weekly SKU-level marketplace pricing data. September 2022 through August 2025, sourced via competitive price-tracking APIs and paired with first-party and third-party sellout unit data. A full three-year view of pricing, promotion, and demand.
Phase 2. Multi-model elasticity evaluation
- Seven elasticity approaches evaluated. From simple regressions up through causal ML. We selected a Global Weighted Master model combining Double Machine Learning (DML) with XGBoost.
- Max-Plausible Promo Selection and Two-Level Empirical Bayes Shrinkage. The first prevents the model from fitting unrealistic promotional depths. The second stabilizes elasticity estimates for SKUs with sparse data and keeps outputs inside commercially reasonable bounds.
- Controls for durable-goods dynamics. Explicit Total Addressable Market controls, annual and semi-annual Fourier seasonality terms, and high-volume holiday and event flags. This isolates real price and discount signals from general market noise.
Phase 3. Retailer Math promo ROI engine
- Retailer Math engine. Computes the client’s true investment per unit by accounting for retailer margin requirements, distributor margin requirements, and the full gross-to-net waterfall.
- Historical Baseline Index (HBI) asymmetric adjustment. Credits promotions run during high-seasonality windows correctly. That fixes the baseline-volume error behind the artificially negative promo ROIs produced by prior methods.
Phase 4. Strategic archetype segmentation
We grouped the 13 drive families into three strategic archetypes. Each has its own pricing and promo posture.
- Competitive Share Fighters. SKUs where the priority is protecting or growing share against direct peers, with active promo and list-price moves.
- Promo-Responsive. SKUs where promo depth and timing drive outsized incremental lift, so targeted promo investment is warranted.
- Promo-Light / Spec-Led. SKUs where buyers are mostly specification-driven and relatively inelastic. Discounting is largely wasted.
Phase 5. Value creation measurement and playbook
- Three-lens value creation measurement framework. The executive-level scorecard: (1) promo-driven incremental gross profit, (2) promo-driven incremental net revenue, and (3) net price realization.
- Pricing and RGM Analytics Navigator playbook. The operating manual the RGM team uses to execute the 2026/2027 pricing plan with analytical discipline.

Results
The client now has a fully operational elasticity engine, promo-ROI tool, segmentation framework, value-creation dashboard, and executive playbook in hand.
- $3M to $6M targeted incremental EBITDA. A projected 10x to 20x return on the engagement, with underlying targets of +1% to +3% net-revenue uplift and +1% to +2% EBITDA margin improvement inside 12 months.
- 10 to 20% targeted lift in promotional effectiveness. By reallocating the ~45% of historical events returning 0 to 20% ROI toward the higher-return mechanisms identified by the new framework.
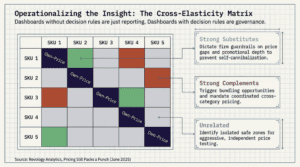
- Portfolio elasticity benchmarks, delivered for the first time. Portfolio-median own-price elasticity of -1.04, promo elasticity of +1.86, and cross-price elasticity of +0.41. The team now has a defensible, causal basis for every pricing and promo decision. The analysis also proved that for 82% of modeled SKUs, promotional discount impact is at least as strong (and often 2x stronger) as regular-price impact, which fundamentally reframes the commercial conversation.
- 50 SKUs modeled across 13 drive families. SKU-level, segment-aware elasticity coefficients and promo response curves covering the full in-scope B2C consumer and enterprise/NAS portfolio.
- ~80%+ targeted price-realization rate. On intended list-price adjustments, up from historically unmeasured and unmanaged realization performance.
- ~50% reduction in planning cycle time. Integrating the elasticity and promo ROI engine into S&OP cuts the planning process by about half, which shifts time from data wrangling into strategic decision-making.
- An in-house advanced RGM Analytics capability the client owns. The full stack (Global Weighted Master Elasticity Model, integrated Pricing & RGM Analytics Dashboard, the three-archetype segmentation matrix, the value creation measurement framework, and the Pricing and RGM Analytics Navigator playbook) lives inside the client’s environment, ready to be re-run and extended as the business evolves.

Related Reading
- Operationalizing Revenue Growth Management Analytics for a Leading Plant-Based Creamer Brand
- Consumer: Food CPG – Case Study
For broader industry perspective on pricing analytics and revenue growth management, see McKinsey’s Growth, Marketing & Sales insights.