This guide provides pricing, RGM, category, and commercial finance leaders with practical methods to measure and address substitution and complement effects across a product portfolio.
Finance often rejects price changes when analysis focuses only on the focal SKU. While own-price elasticities such as −1.2 on the flagship or −0.6 on the premium pack are important, the broader impact on the portfolio is often overlooked. Cross-price elasticities address this gap.
Cross-price elasticities measure how demand for one product responds to changes in the price of another. They help pricing teams quantify substitution and complement effects, enabling better decisions on price moves, pack architecture, promotions, and assortment. According to Revology’s research of 2,000 global companies, a 1% improvement in price realization produces a 6–7% lift in operating profit. Excluding highly regulated industries, the figure sits in the 10–11% range. Source: “Pricing Still Packs a Punch” (Revology Analytics, June 2025). A lot of that price-realization upside lives inside cross-product effects that single-SKU models cannot see.
This guide explains cross-price elasticities, when to apply them, required data, a 7-step estimation framework, a worked example, key KPIs, common pitfalls, and a 30/60/90-day implementation roadmap.
Key Insight: Own-price elasticity shows whether the focal SKU can absorb a price change. Cross-price elasticities reveal how margins shift across the portfolio after the change.
Table of Contents
What this guide covers
This guide includes definitions, formulas, data requirements, estimation steps, a worked example, KPI guidance, common pitfalls, tooling options, FAQs, and a diagnostic checklist. Use it before your next portfolio price review.
Who should read it
This guide is intended for pricing and revenue management leaders, RGM analysts, category managers, commercial strategy partners, and finance professionals. While the terminology is tailored to CPG, technology, distribution, and pharma, the principles also apply to B2B contract pricing, retail assortment, and subscription portfolios.
How to use this framework
If your team is new to cross price elasticity, read this guide in order. If you already estimate own-price elasticities, focus on the 7-step framework, worked example, and common pitfalls. Use the diagnostic checklist as a self-assessment before engaging external support.
What Are Cross Price Elasticities?
Cross price elasticity of demand connects single-product economics to portfolio-level decisions. It is a valuable yet often underutilized concept in commercial analytics.
Definition: Cross price elasticity of demand is the percentage change in quantity demanded for product A divided by the percentage change in price of product B. A positive value usually indicates substitutes, a negative value usually indicates complements, and a value near zero suggests little direct relationship.
Definition in plain business terms
Cross price elasticities help category managers determine where volume shifts when a product’s price changes. If volume moves to a similar product, they are substitutes. If the volume of a paired product declines when its partner’s price increases, the products are complements. If there is no change, the cross effect is near zero.
Cross price elasticity vs own-price elasticity
The own-price elasticity measures how a product’s demand responds to its own price. Cross price elasticity tells you how a price change ripples through the rest of the portfolio. A SKU can look manageable on its own price while still triggering large cross-effects on a sibling SKU one tier up or down. That asymmetry is one of the most common reasons single-SKU pricing decisions quietly erode margin in adjacent products. Revology’s price elasticity modeling guide covers own-price estimation, and the brief guide to price elasticity modeling, part 2, walks through estimation pitfalls that apply to cross effects too.
Substitutes, complements, and unrelated products
Three patterns recur in real portfolios:
• Substitutes carry a positive cross elasticity. A price increase on one drives demand toward the other. Examples include competing brands, private label versus branded products, and adjacent pack sizes within the same brand line.
• Complements carry a negative cross elasticity. A price increase on one suppresses demand for the other. Examples include hardware and consumables, bundled accessories, and platform-and-app pairings.
• Unrelated products sit at or near zero. They share no meaningful demand link, even when they sit in the same catalog.
Avoid treating substitution and complementarity as fixed product labels. These are context-dependent behaviors. The same two SKUs may act as substitutes during a promotion and as complements within a bundle.
Why Cross Price Elasticities Matter in Pricing
Many pricing programs do not pass finance review because they overlook cross effects. A list-price change may appear justified for the focal SKU, but the overall portfolio P&L can move unfavorably after implementation.
Revenue and margin implications
A price change that increases margin on one product but shifts volume to a lower-margin sibling can reduce overall contribution margin. Similarly, a promotion may boost unit sales on the promoted SKU but reduce gross profit if it cannibalizes higher-margin baseline sales. Without cross price elasticities, teams address only one variable in a multi-variable system.
Assortment, promotion, and cannibalization decisions
Assortment design, promotion planning, and price-pack architecture rely on cross price elasticity analysis. Key questions include which SKUs divert volume from each other, which grow the basket, and which pack sizes require price adjustments. Portfolio-level demand estimation enables data-driven decisions. SKU rationalization may also change when cross-effects reveal that a low-contributing SKU supports demand for a more profitable sibling SKU.
Risks of ignoring inter-product effects
A mid-market CPG manufacturer illustrates a common scenario: a temporary multipack promotion can shift demand from single-pack versions, with cannibalization rates of 20–40% depending on category and discount. In reviewed cases, ignoring cross effects led to an overstatement of promotion ROI by 15–25%. Adjusting for cross effects changed several events from positive to break-even or slightly negative ROI. This risk is inherent in promotion plans that treat SKUs as independent.
Practitioner Note: When evaluating promotion ROI, consider not only whether the promoted SKU increased in volume, but also whether the lift resulted from new demand, competitor diversion, or cannibalization of higher-margin products.
Core Terminology and Formula
A cross price elasticity is a ratio. The math is approachable. The data discipline behind it is where the real work lives.
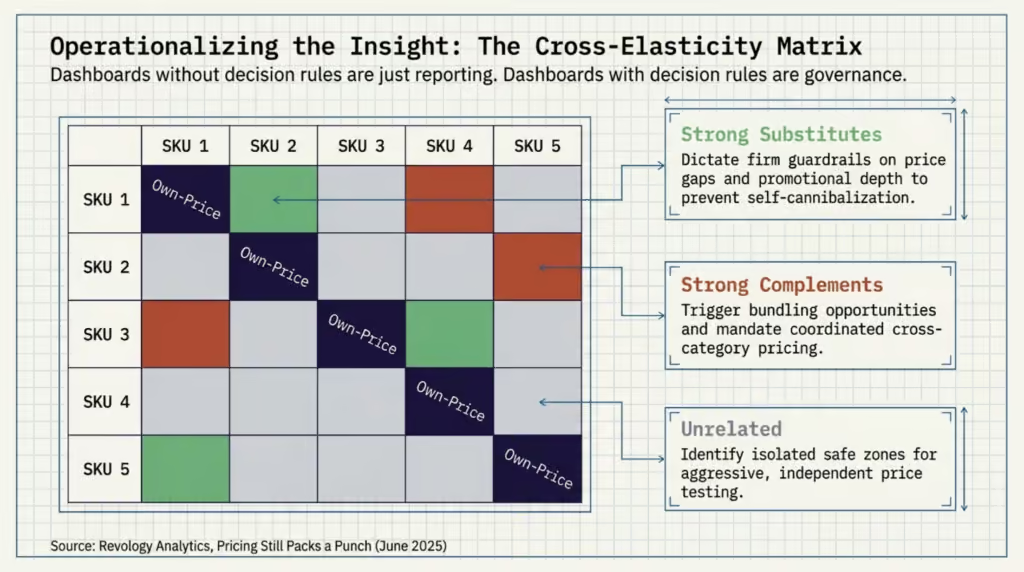
Figure 1. The cross-elasticity matrix shows substitution and complement pairs across SKUs.
Cross price elasticity formula
The cross price elasticity of demand of product A with respect to product B is:
Cross price elasticity (A,B) = (% change in quantity demanded of A) / (% change in price of B)
For larger price changes, the midpoint formula reduces base-period bias by averaging starting and ending values for both quantity and price. This approach prevents errors caused byd by equal percentage increases and decreases, producing inconsistent results.
How to interpret positive, negative, and near-zero values
A positive value indicates demand for A increases when B’s price rises, showing substitution. A negative value means demand for A decreases, indicating complementarity. A value near zero suggests little direct relationship. Magnitude reflects strength: 0.1 is weak, 0.8 is strong. Sign shows direction; magnitude shows impact.
What does it mean if cross price elasticity is less than 1
If the absolute value of cross price elasticity is less than 1, the relationship exists but is relatively weak: demand for product A changes proportionally less than the price of product B. In many portfolio projects, cross effects often range from 0 to 0.6 in absolute value, which can still matter for contribution margin even when no single price move dramatically reshapes demand. The practical question is whether the cross effect is large enough relative to A’s own-price elasticity and margin to matter for the decision at hand. Revology’s note on break-even price elasticities sanity check shows how to put a defensible floor under that question.
—
When to Use Cross Price Elasticities
Cross price elasticity analysis delivers high value in some situations and less in others. Focusing analytical resources where they have the most impact is essential.
Figure 2. Decision tree maps portfolio scenarios to cross-elasticity use cases.
Portfolio pricing and pack architecture
Multi-brand portfolios, tiered product ladders, and pack-size architectures are ideal for cross price elasticity analysis. For example, a global pharmaceutical company with multiple pack sizes per brand found that isolated list-price increases on larger packs shifted buyers to smaller, lower-margin packs. Cross price elasticity analysis quantified this substitution, and adjusting the price ladder using cross-elasticity ratios against a break-even threshold recovered margin while maintaining overall brand volume.
Competitive response planning
When a competitor changes price, the key question is how your portfolio will be affected, regardless of whether you match the move. Cross elasticities between competitors and within your own portfolio clarify these effects. Relying solely on competitive pricing intelligence overlooks significant portfolio impacts.
Bundles, add-ons, and complementary products
Complementary product structures, such as hardware and consumables, or platforms and apps, depend on cross-effects. For example, a printer discount may increase ink cartridge sales, reflecting a negative cross price effect. Bundle pricing relies on cross-elasticity analysis; without it, bundle economics are uncertain.
A global technology company sells storage products across multiple capacity tiers on a major e-commerce platform. Cross price elasticity analysis revealed asymmetric effects between adjacent tiers: discounting the higher tier cannibalized the tier below more than the reverse move pulled buyers upward. That pattern is consistent with the Stanford GSB literature on asymmetric neighborhood effects. Promotional planning shifted from single-SKU decisions to portfolio-level planning. The result was mid-single-digit margin improvement on promoted weeks.
Data Inputs You Need
Estimating cross price elasticities requires more comprehensive data than own-price elasticity. Data preparation is critical to the credibility of a project.
Transaction, price, discount, and volume data
Core inputs include transaction-level price, discount, volume, and revenue data, ideally at SKU-week or SKU-day granularity. Discounts should be separated into list, gross, and net. Volume should reconcile with sell-out data to avoid distortions. Channel and customer identifiers must accompany each transaction for detailed SKU-level analysis.
Product hierarchy, attributes, and competitor signals
Cross effects require a clear product hierarchy, including brand, sub-brand, category, sub-category, pack size, and relevant attributes such as flavor, formulation, capacity, or color. Competitor price signals (list, promo, and shelf) should align with the same time intervals as own-price data. Without competitor data, important substitution patterns may be obscured.
Seasonality, channel, and customer segment controls
Seasonality, holidays, weather, and macro events introduce demand variation unrelated to price. Channel mix shifts can obscure cross price signals if not controlled. Customer segment controls enable segment-specific cross elasticity estimates for actionable pricing decisions.
Data Point: For portfolio cross-elasticity work, we typically want 24–36 months of transaction history with reconciled discount, volume, and channel data, plus a competitor price index aligned with the same time grain. Stable categories may support a narrower window if price variation is clean; volatile categories often need more frequent refreshes.
A 7-Step Framework to Estimate and Apply Cross Price Elasticities
The following steps assume your team already has basic capabilities for estimating own-price elasticity.
Figure 3. The seven-step framework converts data and decisions into cross-elasticity actions.
Step 1: Define the decision and product set
Begin by defining the decision, not just collecting data. Whether setting pack-size price ladders, redesigning promotions, planning competitive responses, or rationalizing assortment, each decision requires a specific product set and a cross price elasticity question. Clearly identify the focal product, potential substitutes and complements, time window, and segments. Estimating the wrong matrix due to an undefined decision is a costly mistake.
Step 2: Clean data and align time granularity
Align transaction, price, and volume data to the same time intervals. Break down discount components. Reconcile sell-in with sell-out data where possible. Explicitly account for stock-outs and supply gaps, as zero volume may indicate either zero demand or zero availability, which must be distinguished in the data.
Step 3: Control for promotions, seasonality, and mix
Include explicit controls for promotional events (both own and competitor), seasonality, holidays, channel mix, and customer mix. Estimating cross-elasticity from raw data that mixes promotion and price changes will overstate the effect. The model should distinguish between price and promotion coefficients. If the data cannot support this separation, communicate this limitation before presenting results to executives.
Step 4: Estimate elasticities and test significance
Estimate own-price and cross price elasticities simultaneously. Common methods include log-log regression at the SKU level, panel models with fixed effects, and demand systems such as AIDS or its log-linear variants. Report standard errors, confidence intervals, and statistical significance. A significant cross price elasticity of 0.3 is more actionable than an insignificant value of 0.7. Treat insignificant cross effects as ‘no signal at this price variation,’ not as zero.
Step 5: Translate outputs into pricing actions
Convert the elasticity matrix into actionable pricing steps, such as revised price corridors, updated pack-size ladders, promotion plans with cannibalization adjustments, bundle pricing, and competitive response rules. Apply a break-even price elasticity check to ensure each recommendation meets a profit threshold, not just a volume target.
Step 6: Pilot changes and monitor results
Conduct a pilot before full rollout. Select a segment, channel, or geography with sufficient volume to yield results within 60–90 days, but limited enough to manage risk. Define success criteria in advance, such as the minimum margin improvement, the maximum acceptable volume loss in adjacent products, and the minimum adoption rate. Monitor results weekly.
Step 7: Refresh the model on a regular cadence
Cross price elasticities change over time due to promotions, assortment changes, seasonality, and competitor actions. Set a regular refresh schedule—quarterly for stable categories, monthly or weekly for volatile ones—and establish governance to determine which elasticities require action, monitoring, or re-estimation.
Worked Example: Substitutes and Complements
The following worked example illustrates the framework. The figures are stylized but reflect common patterns in CPG, pharma, and technology portfolios.
Figure 4. Side-by-side substitute and complement scenarios with profit impact bars.
Scenario setup
A consumer products company sells two related SKUs, Product A (premium) and Product B (mainstream). Both compete for the same household demand pool. Product A sells at $12 per unit with a 35% gross margin. Product B sells at $9 per unit with a 28% gross margin. The pricing team is considering a 10% list price increase for Product B.
Example of the cross price effect for substitute products
Historical data shows that in past quarters when Product B’s price rose by 10%, Product A’s volume rose by approximately 4%. The cross price elasticity of A with respect to B is therefore +0.4. The two are substitutes, but not strong ones. Product B’s own-price elasticity is −1.1, so a 10% price increase on B drops B’s volume by approximately 11%.
Using a base of 100 units per week for each product and gross-margin percentage, pre-move gross profit is ($1,200 × 35%) + ($900 × 28%) = $672. After increasing B’s price to $9.90, B’s volume drops to 89, and A’s volume rises to 104. Post-move gross profit is ($1,248 × 35%) + ($881.10 × 28%) = $683.51, resulting in an $11.50 weekly gross profit increase. This example demonstrates the direction of the portfolio effect. For finance-ready analysis, rerun the scenario using unit contribution dollars with constant COGS.
Example of cross price elasticity of demand for complements
Now consider Product C, a commonly co-purchased accessory for Product B. A 10% price increase on B leads to a 3% decrease in demand for C, resulting in a cross price elasticity of −0.3. B and C are complements. If the price increase on B is implemented without adjusting C, the volume loss on C compounds the loss on B and reduces the substitution benefit on A.
How the pricing recommendation changes by scenario
Recommendations should consider the entire portfolio, not just the focal SKU. In the substitute-only scenario, increasing B’s price yields a modest portfolio gain. Including the complement effect on C reduces this gain, and a competitor’s response could eliminate it entirely. The same own-price elasticity for B can lead to different recommendations when cross effects are included.
Key Insight: A 10% price move on a single SKU rarely lives alone. Cross effects on adjacent substitutes and complements often carry as many profit consequences as the own-price response.
The global pharmaceutical company mentioned earlier hit this pattern in a live pack-size ladder. List-price increases on larger packs were pushing volume into smaller packs, thereby lowering per-unit margins. The corrected ladder used cross-elasticity ratios against a break-even threshold to recover margin while holding total brand volume within a narrow range. The substitution was happening either way. The price ladder simply needed to acknowledge it.
KPIs to Track After Implementation
A cross price elasticity program is only as credible as the scorecard it lands on. Five to seven KPIs usually carry the weight of an executive review. They split into three groups.
Revenue, gross margin, and contribution margin
Net revenue, gross margin percentage, and contribution margin per unit and per category are the headline KPIs. Report them at the portfolio, brand, and pack size levels. Confidence bands matter. A directional margin improvement with a confidence interval is more credible than a point estimate carried to two decimal places. Ranges acknowledge uncertainty without burying the result.
Unit volume, mix shift, and attach rate
Unit volume by SKU, mix shift across brand-pack combinations, and attach rate for complementary products explain how the result was achieved. A margin gain that came entirely from mix shift to higher-margin SKUs is a different story from one that came from price realization. Volume and mix together tell the team whether the cross-effect logic is behaving as the model expected.
Cannibalization rate, win rate, and forecast accuracy
Cannibalization rate (volume lost on adjacent SKUs as a percent of focal-SKU volume gained), win rate against named competitors, and forecast accuracy versus the pre-move plan close the loop. Forecast accuracy is the leading indicator: when cross-effect adjusted forecasts start drifting from actuals, the portfolio’s elasticity structure has shifted.
Common Pitfalls and How to Avoid Them
Cross price elasticity programs fail for predictable reasons.
Confusing correlation with causation
A correlation between two products’ prices and volumes is not a cross price effect. It can be a season effect, a competitor effect, a sales-coverage effect, or a promotion-overlap effect. A positive cross elasticity does not automatically mean a price increase will improve profit. Difference-in-differences, matched-cohort regression, and other causal designs help isolate the price effect from the noise. Cross elasticities estimated without explicit confounder controls invite finance to challenge every result, and finance is usually right to do so.
Using too little price variation in the data
If a SKU’s price has barely moved over the last two years, its own-price elasticity is hard to estimate, and its cross-elasticity readings against other SKUs are even harder. Categories with rigid pricing or high list-price stability often show cross-elasticities that are statistically insignificant because the data lack sufficient variation. The right answer is to design a structured price test rather than publish a noisy estimate as if it were a signal. For teams new to elasticity work, the importance of knowing your price elasticities explains why this matters before it becomes a board-level question.
Ignoring stockouts, competitor moves, and channel effects.
Stockouts in Product A look like a demand collapse to a model that does not know about availability. Competitor moves on a related SKU can produce cross-effect readings that have nothing to do with own-portfolio decisions. Channel effects can dominate the cross price signals if not explicitly controlled for. A low average cross-elasticity does not imply there is no substitution within specific channels, segments, or customer groups. The discipline is to slice cross elasticities by channel, customer segment, and competitor presence, then pressure-test the average.
Products can also switch roles by context. Treat the sign as a context-specific estimate, not a permanent product label. For a deeper background on the conditions that produce reliable elasticity estimates, price elasticity modeling part 2 (Insights) covers the statistical preconditions in detail.
Implementation Roadmap for Pricing Teams
A serious cross price elasticity program is structured into three phases. The cadence below corresponds to a 90-day window from commissioning the work to presenting first results to an executive sponsor.
Figure 5. The 90-day timeline outlines the diagnostic, model-building, and pilot phases.
30-day diagnostic and data audit
The first 30 days are a diagnostic, not a build. The team scopes the decision question, identifies the focal product set, audits the transaction data, and stress-tests the discount and competitor data. The audit usually identifies three to five data gaps that need to be addressed before any model is estimated. Skipping the audit is the single most common reason later results land badly in a finance review.
60-day model build and stakeholder alignment
The next 30 days are the model build, including controls for promotions, seasonality, channel, and segment. The deliverable is a cross-elasticity matrix with confidence intervals, along with a translation layer that converts elasticities into proposed pricing actions. Stakeholder alignment runs in parallel. Sales, finance, category, and supply chain need to agree on the success criteria before the pilot launches.
90-day pilot, governance, and rollout plan
The last 30 days are pilot, governance, and rollout planning. Pre-register success criteria. Run the pilot in a defined segment with a defined control group. Track adoption, override rates, and exception reasons alongside financial outcomes. The governance layer (who can override a recommended price corridor, under what conditions, and with what audit trail) is part of the deliverable. Without governance, the pricing logic erodes within two quarters as exceptions accumulate.
Tools, Models, and Visualization Options
Cross price elasticities sit at the intersection of demand estimation and decision support. The tool choice should follow the decision, not the other way around.
Figure 6. The method comparison table contrasts regression, panel, demand-system, and Bayesian methods.
Regression, panel models, and demand systems
Log-log regression at the SKU-week level remains the most common workhorse for first-pass cross price elasticity estimation. Panel models with product and time fixed effects do better on data with structural heterogeneity. Full demand systems, such as the Almost Ideal Demand System (AIDS) and its variants, are appropriate for category-level decisions in which expenditure share is the primary unit of interest. Bayesian hierarchical models are useful when SKU-level data is sparse, and the team needs to borrow signal across similar SKUs.
Cross price elasticities matrix and heatmap views
For executive consumption, a cross price elasticity matrix or heatmap is hard to beat. SKUs run down the rows and across the columns; cells are colored by sign and magnitude. Strong substitution shows up as a hot cell. Strong complementarity shows up as a cold cell. Near-zero relationships fade to neutral. Heatmaps make portfolio relationships visible at a glance and highlight clusters of SKUs that should be priced together.
Calculator, dashboard, and decision rules
A cross price elasticity calculator built into a pricing dashboard turns the matrix into a decision tool. Pricing teams enter a candidate price move, and the dashboard surfaces the expected portfolio impact, including substitute and complement effects, with confidence ranges. Decision rules convert cross-elasticity outputs into discount and assortment rules that the field can consistently execute. A dashboard without decision rules is a reporting tool. A dashboard with decision rules is a governance tool. For a deeper read on how elasticity diagnostics show up in a working pricing capability, price elastic and inelastic demand lays out the practitioner’s reading of own-price and cross price elasticities side by side.
FAQ About Cross Price Elasticities
What are cross price elasticities?
Cross price elasticities measure how demand for one product responds to changes in the price of another. They are calculated as the percentage change in quantity demanded of product A divided by the percentage change in price of product B. Pricing teams use them to anticipate substitution and complement effects across a portfolio when the price of a single SKU changes.
What is an example of cross price elasticity of demand?
A simple example: a 10% price increase on Brand B leads to a 4% rise in demand for Brand A in the same category, giving a cross price elasticity of +0.4. The positive sign indicates the products are substitutes. A category manager would weigh that effect against own-price elasticity and margin differences before approving the price increase on Brand B.
What does it mean if cross price elasticity is less than 1?
If the absolute value of the cross price elasticity is less than 1, the relationship between the two products is weak: demand for product A changes proportionally less than the price change of product B. In practice, a weak cross effect can still matter if the affected SKU has materially different margins, strategic importance, or attach economics.
What is an example of the cross price effect?
A discount on printers may increase sales of ink cartridges. The cross price elasticity between printers and cartridges is negative because the two are complements. Cutting the printer price expands the installed base, which can raise future cartridge demand. Hardware-and-consumables, base-and-accessory, and platform-and-app pairings all show this pattern.
What are real-world examples of cross elasticity?
Real examples include competing brands within the same retail category (substitutes), private label versus branded products in CPG, printers and ink cartridges (complements), gaming consoles and games (complements), and adjacent capacity tiers in technology hardware (substitutes with asymmetric effects).
What are the 4 types of elasticity of demand?
The four common types of elasticity of demand are price elasticity (own-price), cross price elasticity, income elasticity, and advertising or promotional elasticity. Pricing programs typically focus on the first two. Cross price elasticity is the one most often missing from pricing strategy work, which is why portfolio decisions made on own-price elasticity alone tend to disappoint.
Key Takeaways for Executives
For an executive sponsor, three takeaways anchor a cross price elasticity program.
Where to start first
Start with one decision and one product set. Pack-size ladders, promotion redesign, or a focused competitive response in a single category usually produce a first result within one quarter. Avoid the temptation to estimate the full portfolio matrix on day one. Cross price elasticities build trust through a single credible recommendation rather than by publishing a large heatmap with no owner.
What good looks like operationally
Good operational practice has four signals. Cross elasticities are estimated at the SKU, segment, channel, or customer level rather than only at the total-market average. The estimation process explicitly controls for promotions, seasonality, mix, and competitor activity. Recommendations are wrapped in decision rules and price corridors with named owners. The portfolio is refreshed on a fixed cadence rather than on demand from a deal cycle. Programs that hit those signals tend to compound. Programs that miss them tend to drift.
When to bring in outside support
Three patterns usually justify outside support. The team has reliable own-price elasticities but cannot obtain cross-elasticities that stabilize across refreshes. The data architecture is fractured (multiple ERP instances, inconsistent product hierarchies, gaps in competitor data), and the gap is too large to close inside a quarter. Or the decision is high-stakes and time-bound, such as a portfolio repricing tied to a launch, an entry, or a divestiture.
Practitioner Note: The fastest credibility gain in a cross price elasticity program is one segment, one decision, one quarter. A modest elasticity matrix tied to a named decision and a named owner.
Diagnostic Checklist and Next Steps
Before commissioning external work, leaders can run a quick self-assessment. Five questions usually surface whether the organization is ready for a portfolio-level cross-elasticity program.
1. Can your team name the focal decision the cross-elasticity work would inform, and the segment, channel, or geography where the decision lands first?
2. Do you have at least 24 months of reconciled transaction-level price, discount, and volume data, with a clean product hierarchy?
3. Can you separate promotional events from list-price changes in the data, on both your own SKUs and key competitor SKUs?
4. Is there a named owner who can act on a cross-elasticity recommendation in the field with the authority to set price corridors? cross price elasticities
5. Has the executive sponsor agreed in advance on the success criteria and the threshold above which a pilot is scaled?
If the team can answer “yes” to four of five, an internal pilot is the right next step. If two or fewer, a structured diagnostic protects the eventual model from data and governance gaps that would otherwise surface in finance review. Smaller teams without a dedicated pricing analytics function can still get value by starting with pack-size ladders or promotion cannibalization on one brand, using the 7-step framework as a checklist, and refreshing quarterly.
When the decision is high-stakes, the data is fractured, or the timeline is short, an outside diagnostic accelerates the work and protects the result. Book a pricing and revenue management diagnostic call with Revology Analytics to scope a 30/60/90 cross-elasticity program against your portfolio.