A practical guide for pricing, revenue, and risk leaders: what pricing surveillance is, how it differs from dynamic pricing, and how to detect and govern it without eroding trust or inviting regulatory heat.
On a Monday morning, your CRO drops a screenshot in Slack: two shoppers, same SKU, same minute, different all-in price at checkout. Sales shrugs and says it must be “the algorithm.” Finance asks why margin is slipping on the same product mix. Legal asks what data is feeding the price logic, and whether the customer consented.
This kind of hard-to-explain price drift is a real problem. It happens when data collection, experimentation, and gaps in price execution quietly change what customers pay, and your team cannot clearly explain or defend the outcome.
Looking ahead to 2026, this is not just about margin leakage anymore. Regulatory pressure is growing fast. The FTC is investigating ‘surveillance pricing,’ and states like New York and California are passing new transparency and anti-collusion laws. Revenue leaders need to shift from black-box pricing to transparent, well-governed processes.
What “pricing surveillance” means in practice
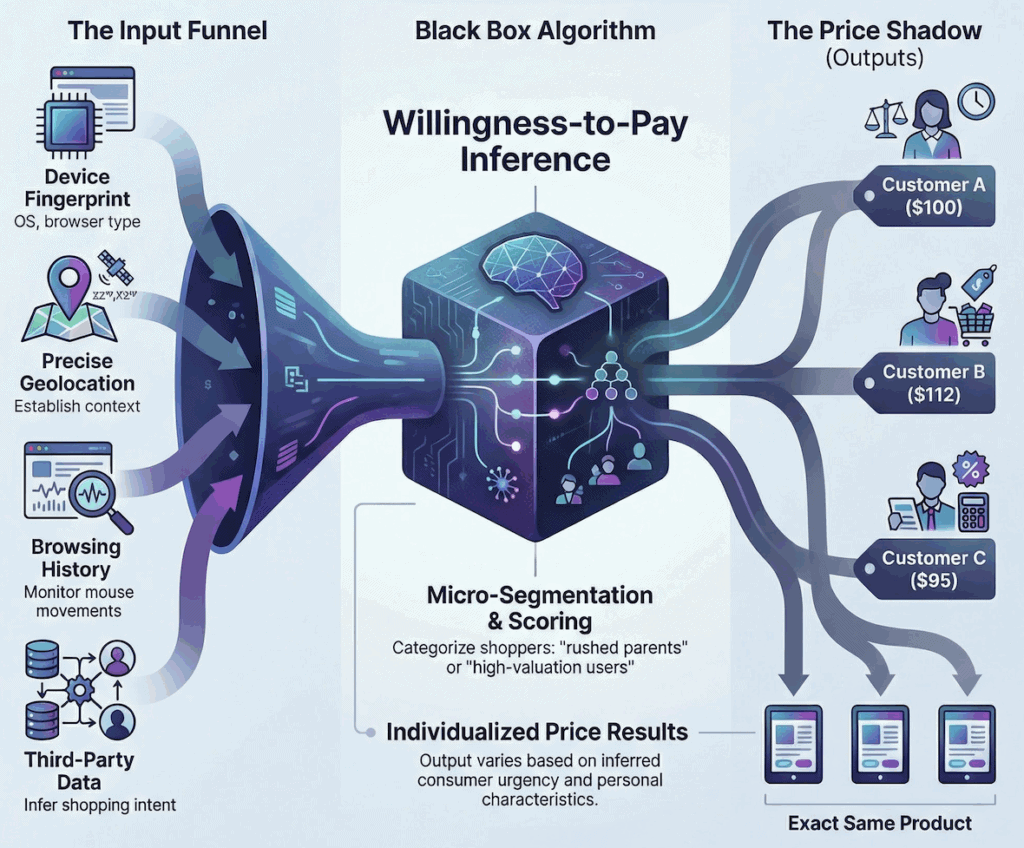
Pricing surveillance is the collection and use of granular data about a shopper, buyer, or transaction context to infer willingness-to-pay (WTP) and then adjust prices, discounts, fees, or offer availability at the individual or micro-segment level.
That’s the version showing up in headlines and regulatory language. The Federal Trade Commission’s 2025 surveillance pricing study described a market where intermediaries use consumer-related inputs—including behavior, location, and channel—to influence the prices or promotions a consumer sees.
In revenue growth management (RGM), practitioners also use “pricing surveillance” in a broader, operational sense:
- External monitoring: competitive price monitoring (prices, promos, availability, positioning)
- Internal monitoring: price execution monitoring (discount discipline, fee consistency, override rates, margin leakage)
These practices are often necessary and add value. The real risk starts when monitoring crosses over into using surveillance-based signals like device IDs, browsing history, or inferred demographics to set prices or offers that your business cannot clearly justify.
Key terms (used precisely):
- Price discrimination: charging different prices to different buyers for the same (or comparable) offering. This can be legal or illegal depending on context, market, and the basis for the difference.
- Personalized pricing: tailoring price/offer to an individual (or near-individual segment), often using customer data.
- Surveillance pricing: a term regulators use for personalized pricing that depends on “surveillance-like” data collection and inference.
- Dynamic pricing: changing prices based on market-level factors like supply, demand, or time—not necessarily specific to the individual.
- Willingness-to-pay (WTP): the maximum a buyer would pay before walking away.
Where it shows up (B2C and B2B contexts)
Pricing surveillance is not confined to consumer retail.
Common B2C touchpoints:
- E-commerce sites and mobile apps (price tests, fee tests, “member price” logic)
- Delivery and service fees that vary by context
- Subscription trial offers and “discount” framing
Common B2B touchpoints:
- Quote tools (CPQ), deal desks, distributor portals
- Rebates, freight, payment terms, and “special bid” approvals
- Sales rep discretion that quietly becomes individualized pricing (often without a defensible fence)
What it is not (common misconceptions)
Pricing surveillance often gets confused with three things:
1. Competitive price monitoring (tracking market prices). This is a market observation, not individualized pricing.
2. Value-based pricing (charging more because value is higher). That aligns price with differentiated value, rather than inferring WTP from surveillance-like signals.
3. Dynamic pricing (changing prices based on market conditions). Dynamic pricing can be clean (e.g., inventory, time, demand) or messy (e.g., personal data inputs). The inputs matter.
Pricing surveillance vs. dynamic pricing vs. personalization
Dynamic pricing (time/market-driven) vs. surveillance-driven signals
Dynamic pricing changes price based on observable market factors: inventory, time window, supply constraints, seasonality, competitor moves, or service level.
Pricing surveillance is different: it changes price (or fees, or the offer itself) based on who the buyer appears to be (or what the system infers), not what the market is doing.
A clean mental model:
- Dynamic pricing: “The market changed.”
- Surveillance pricing: “The buyer changed (or the system thinks they did).”
For a deeper primer on dynamic pricing models (and when they belong outside travel and hospitality), see The Executive’s Guide to Surge Pricing and Dynamic Pricing Models.
Personalization vs. discrimination: the boundary
Personalization can be benign, such as member pricing, contract pricing, student pricing, volume tiers, or service-level pricing. The key is a clear fence that customers can understand and that your teams can defend.
It crosses into problematic discrimination when:
- the fence is invisible or hard to explain,
- the signals look like proxies for protected traits (or correlate tightly with them),
- the business cannot document why differences exist,
- and outcomes show systematic gaps that are hard to justify.
Why the distinction matters for governance and messaging
Governance: If you treat pricing surveillance as just another growth lever, you risk skipping the controls that keep your pricing fair and defensible. This is how pricing problems quietly build up.
Messaging: Customers tolerate price differences when there’s a rationale (membership, volume, service level). They react badly when the difference feels personal and hidden.
Recent laws underscore this. Reuters reported that New York’s new law requires businesses to explicitly disclose when an algorithm using personal data sets the price, with civil fines of up to $1,000 per violation.
Why pricing surveillance matters to revenue leaders
Trust, churn, and brand risk
Surveillance-based pricing can quickly erode customer trust. When a customer feels singled out and you cannot explain the reason, you have a trust issue before you have a pricing issue.
In January 2026, California Attorney General Rob Bonta announced an investigative sweep focused on businesses using personal information to set targeted, individualized prices, warning that these practices may trigger obligations under (and potentially violate) the California Consumer Privacy Act (CCPA), including “purpose limitation.”
Regulatory and legal exposure (high-level overview)
This is not legal advice, but here’s the practical landscape revenue leaders need to understand:
Consumer protection: If a pricing practice is opaque, misleading, or framed deceptively (for example, “discounts” that are individualized without disclosure), it can become a consumer protection issue. The FTC’s Office of Technology has discussed surveillance pricing risks alongside concerns about deception and unfairness.
Privacy compliance: If you use personal data (especially sensitive categories, precise location, or inferred traits) to set individualized prices, privacy laws can apply. In the European Union, GDPR allows administrative fines up to 4% of global annual turnover (or €20M, depending on the provision).
State disclosure laws: Some jurisdictions are moving toward “tell the customer when an algorithm using personal data sets the price.”
Antitrust and collusion risk: Pricing surveillance can become legally perilous if it slides from “observing competitors” into “coordinating with competitors.” Even without explicit agreements, algorithmic price coordination can raise scrutiny, especially when competitors rely on the same pricing tool or signaling.
Margin impact and competitive response dynamics
Pricing changes often seem minor, just a few dollars here or there, until you look at the impact on your P&L.
Revology Analytics notes that a 1% improvement in realized price typically lifts operating profit by 3.3% to 14.3%, with a global median impact of 6.4%. This leverage exists because price falls straight to the bottom line, though the magnitude is shaped by industry economics.
Deloitte describes a revenue leakage case where discrepancies between contracts and billing data were costing a company 3–4% of revenue across approximately 20,000 transactions. That’s the kind of “internal pricing surveillance” you want—because it finds leakage you can actually fix.
For a practical perspective on tightening discount discipline and reducing irrational price variation, see How Strategic Price Customization Recaptures Value.
Common data signals used for surveillance-based pricing
You cannot govern pricing surveillance until you name the signals. A useful way to think about it is “business context” vs. “buyer surveillance.”
Device, browser, and app signals
These are common in digital pricing stacks and experimentation:
- Device type (mobile vs. desktop)
- OS (iOS vs. Android), browser, app version
- Persistent identifiers (device IDs, ad IDs)
- Device fingerprinting (combinations of attributes used to re-identify devices)
The risk is that device details often align with income or demographic factors, so they can serve as stand-ins for sensitive traits even if you never ask for them directly. For example, some studies found that Mac users were shown higher hotel prices.
Location, network, and behavioral signals
- Location data (GPS, IP-based location, store proximity)
- Network (Wi-Fi vs. cellular), ISP, VPN usage
- Browsing behavior: time on page, search/referrer, cart abandonment, prior visits
- Clickstream patterns that infer urgency (“looking at competitors,” “visiting the page three times”)
These signals are helpful for tasks such as fraud prevention and order routing. The risk comes when you use them to guess willingness-to-pay and set personalized prices, especially if you cannot clearly explain the logic to customers or regulators.
Identity graphs, third-party data, and data broker inputs
This is where much of modern concern lies. High-risk inputs include:
- Third-party demographic segments (inferred income, life stage)
- Identity graphs that link devices to households
- Data broker segments appended to profiles
- “Lookalike” audiences that shadow protected characteristics
A good rule of thumb: if you cannot explain to a customer in one sentence why a signal is used to set their price, it should not be driving your pricing decisions.
A practical detection framework: audit → test → monitor
Most companies do not set out to use surveillance pricing. It creeps in over time—a price test here, a new fee rule there, a tweak to loyalty offers, or a sales rep making exceptions. That is why you need a systematic approach to detection.
Step 1: Map price decision points and channels
Start by mapping where the customer sees a price and where the price is actually computed.
Typical decision points:
- Base/list price (or contract price)
- Promotion eligibility (who gets which offer)
- Discounts (automatic or rep-applied)
- Fees (delivery, service, payment method)
- Shipping/taxes handling
- Availability (what is shown vs. hidden)
Channels: Web, mobile app, call center, marketplace listings, B2B portals and quote tools, in-store POS.
Output of Step 1: a “price flow map” and a list of every place customer/session data touches pricing logic.
Step 2: Hypothesis-driven testing (A/B, multivariate, holdouts)
You are not trying to prove “we are bad.” You are trying to answer a narrow question:
“Do two comparable cohorts receive meaningfully different all-in prices, after controlling for legitimate cost and service differences?”
Use controlled testing where you can:
- A/B with holdouts: Keep a “no surveillance signals” group as a control.
- Multivariate tests: When multiple elements change (e.g., fees + promo), isolate the effects.
- Difference-in-differences: If you change a rule, measure the before-and-after gap relative to a stable cohort.
Step 3: Ongoing monitoring and alerting
Once you have audited and tested, put it on a dashboard with thresholds. You want weekly (or even daily for high-volume ecommerce) monitoring for:
- Dispersion spikes on key SKUs
- Fee variance that customers experience as “random.”
- Offer parity gaps between matched cohorts
- Override rate creep in B2B quoting
The goal is not to have perfectly uniform pricing everywhere. The goal is to have price differences you can clearly explain and defend.
Data inputs you need to investigate pricing surveillance
Detection fails when teams cannot reconstruct what happened.
Transaction and quote logs (price, discount, fees, taxes)
Minimum fields:
- SKU/offer ID, timestamp, channel
- List/base price, discount amount, net price
- Fee components (delivery/service/payment)
- Quantity, shipping method, fulfillment cost proxy
- Order outcome (converted vs. abandoned)
Customer/session attributes and consent flags
- Anonymous session ID + customer ID (when known)
- Loyalty status, membership tier
- Geography at a coarse-enough level to be defensible
- Consent flags (cookie consent, ad personalization settings, privacy choices)
Experimentation logs and model feature stores
If you run pricing experiments or models:
- Experiment ID, variant assignment, start/end dates
- Feature list used by each model version
- Change logs: when a rule or model went live and who approved it
This is where good governance overlaps with basic operational discipline.
KPIs and metrics to quantify surveillance risk
Below are practical metrics that pricing and revenue teams can actually run, with formulas you can hand to an analyst.
Core metrics:
Realized Price (RP): RP = Net Revenue / Units. Use net revenue after discounts (and rebates if you can allocate them), and keep fees separate if you want fee governance.
Discount Rate: Discount Rate = 1 − (Realized Price / List Price). Useful for spotting discount creep and comparing across segments.
Price Dispersion Ratio (PDR): PDR = P90(Net Price) / P10(Net Price) for the same SKU/offer, same time window, comparable service level. A widening PDR is a classic “The Price Shadow” tell.
Offer Parity Gap (OPG): OPG = (Avg All-In Price Cohort A − Avg All-In Price Cohort B) / Avg All-In Price Cohort B. “All-in price” should include mandatory fees. This is the metric customers feel.
Incremental Margin (IM) from a pricing change: IM = (P_new − VC) × Q_new − (P_old − VC) × Q_old, where VC is variable cost. This makes elasticity conversations concrete.
What to monitor and when to escalate
| KPI | How to calculate | Why it matters | Trigger example |
| Price Dispersion Ratio | P90/P10 net price per SKU & channel | Spots uncontrolled variation | PDR increases >10% week-over-week |
| Offer Parity Gap | Cohort A vs B matched on service level, geo, basket | Surfaces “unfair” outcomes | OPG >2% without documented fence |
| Fee Variance Index | Std dev of mandatory fees for same service | “Junk fee” perception risk | Variance increases after a release |
| Override Rate | % of quotes/orders with manual override | Governance health | Overrides >15% of volume |
| Discount Tail Share | % of sales at max discount tier | Sales discipline | >25% of units at max discount |
These trigger values are starting points. Calibrate using your own history.
Worked example: detecting suspicious price differences (and fixing them)
Scenario: A mid-market retailer sells branded replacement parts online (web + app). They run frequent price tests and have a loyalty program. A product manager notices something odd: conversion is strong on mobile, but gross margin dollars lag, and customer service tickets mention “my friend paid less.”
Step 1: Form a testable hypothesis
“Mobile app users see higher mandatory fees than web users for the same service level.” Define “mandatory fees” precisely (delivery + service fee, excluding optional add-ons).
Step 2: Build matched cohorts
Match orders by the same SKU, the same fulfillment mode, the same geo band (state or region, not ZIP-level precision), a similar basket size (±10%), and the same time window. Then compare Cohort A (mobile app) vs. Cohort B (desktop web).
Step 3: Calculate Offer Parity Gap (OPG)
If Cohort A average all-in price = $108 and Cohort B average all-in price = $104:
OPG = (108 − 104) / 104 = 3.85%
That is a big enough gap for customers to notice and question.
Step 4: Control for legitimate cost drivers
Test whether the gap persists after controlling for distance bands/carrier costs, order weight/size class, time windows (same-day vs. standard), and promo eligibility. If the gap persists, you likely have a signal problem (device/app context acting as a proxy for willingness-to-pay) or a rule-drift problem (fee tables not aligned across channels).
Step 5: Apply governance, not guesswork
Actions taken:
- Remove device/app as a pricing signal for mandatory fees (keep it for fraud detection if needed).
- Add a weekly monitor: Fee Variance Index by channel and service level.
- Require a documented fence for any intentional channel-based differences.
- Add customer-facing clarity: fees shown earlier and consistently.
Governance: policies, controls, and decision rights
A working governance framework has three layers: policy, process, and proof.
Acceptable-use policy for data signals
Create a short policy that answers: Which signals are allowed to influence price, discount, fees, or offer eligibility?
Allowed (examples):
- Inventory position, service level (standard vs. expedited)
- Geographic cost bands (not precise location trails)
- Contract terms, volume tiers, loyalty tier (explicit, customer-facing)
- Channel costs (if documented and consistent)
Prohibited or high-scrutiny (examples):
- Precise location trails, browsing history used to infer urgency
- Third-party inferred demographics, data broker segments
- Device fingerprinting is used for WTP inference
- Any attribute that is a proxy for protected traits (even if not labeled)
Approval workflow and documentation
Pricing Council: cross-functional (Pricing, Sales, Marketing, Finance, Legal/Privacy). It approves new fences and new data signal categories.
Deal envelopes (B2B): target price, floor price, authority levels for exceptions.
Change control: every pricing rule/model change gets an owner, a reason, a risk rating, and a rollback plan.
Documentation: model cards, pricing logic, and audit trails
At minimum:
- Model card (for pricing models): purpose, features used, exclusions, limitations, test results, monitoring plan.
- Experiment register: what was tested, when, outcomes, and whether it shipped.
- Audit logs: who changed what, and what it impacted.
Next step: book a pricing & revenue management diagnostic call
If any of this sounds familiar, you do not need a new strategy. What you need is visibility: a clear map of where pricing decisions are made, what signals drive them, and what outcomes you are seeing.
Revology’s Pricing & RGM diagnostic work commonly targets:
- net price realization and margin leakage,
- discount and exception discipline,
- competitive price monitoring that informs (not hijacks) decisions,
- and governance guardrails for experimentation and personalization.
If you want to pressure-test your current approach, book a pricing & revenue management diagnostic call.
Disclaimer: This article is for educational purposes and does not constitute legal advice.
FAQ
What is surveillance pricing?
Surveillance pricing adjusts prices, fees, or offers using detailed customer-level data and inferences (e.g., browsing behavior, device IDs, location) to estimate willingness-to-pay and target individuals or microsegments. The distinguishing feature is reliance on surveillance-like data collection and inference rather than observable market factors.
Surveillance pricing vs. dynamic pricing: what’s the difference?
Dynamic pricing typically adjusts prices based on market conditions such as demand, inventory, time, or costs. Surveillance pricing relies on tracking and inference about a specific customer or context to personalize price or offer terms. The inputs matter: “the market changed” vs. “the buyer changed.”
Is surveillance pricing legal?
Legality depends on jurisdiction, data-collection and consent rules, and whether the practice is deceptive, unfair, or discriminatory. There is no single federal law, but the FTC enforces the FTC Act against unfair/deceptive practices. States like New York have passed the Algorithmic Pricing Disclosure Act, and California has amended the Cartwright Act to target algorithmic collusion. Companies should involve legal/privacy teams and implement documented controls and audits.
What is the law against surveillance pricing?
There is not one universal “surveillance pricing law.” Enforcement typically comes through consumer protection (unfair/deceptive practices), privacy laws (data collection/consent), anti-discrimination rules, and sector-specific regulations.
How does surveillance pricing work?
A firm collects signals (first-party and third-party), builds a willingness-to-pay estimate or propensity model, and then serves different prices, discounts, fees, or bundles through rules or algorithms at the point of quote or checkout. Companies use tracking pixels, cookies, and apps to gather data on a user’s device, location, and shopping habits.
How can consumers avoid price surveillance?
Consumers can reduce tracking signals by limiting cookie and app tracking, using private browsing, comparing prices across devices/accounts, and checking logged-in vs. logged-out experiences. Avoidance is not always possible, and the onus should not fall entirely on consumers.
What are pricing fairness metrics?
They are measures that quantify whether price/fee variation is defensible and consistent. Practical examples include Price Dispersion Ratio, Offer Parity Gap, and fee variance by service level, tracked with thresholds that trigger review.
How do you detect price discrimination in transaction data?
Start with a transaction-level audit: discount-curve analysis, net price vs. volume scatterplots, price-band analysis for the same SKU, and override-rate tracking. Then run matched-cohort tests to control for cost and service differences.