Turn Cost Crises into Competitive Advantage with Revify Analytics – Join Our Waitlist
Tariffs as a Margin Stress Test
Another round of import duties hits. For a mid-market manufacturer or distributor, the impact is immediate and visceral: landed costs surge, spreadsheets bleed red, and leadership faces the urgent question: how much can we pass on? The gut reaction is often a uniform price hike equal to the tariff percentage, or to keep the Gross Margin Percent whole. It feels fair and it’s fast to implement.
Yet, decades of pricing science, painful real-world experience, and recent studies confirm that this approach is, unsurprisingly, flawed. As Revology Analytics highlighted in our Revenue Growth Analytics Maturity Report, over half of mid-market commercial leaders report low-to-medium analytics maturity, and only 1 in 10 consistently use predictive analytics for pricing decisions. This capability gap makes navigating cost shocks incredibly risky.
Navigating Tariff Uncertainty
Before diving into specific pricing mechanics, it’s crucial to understand the broader landscape. Tariffs, once seen as temporary, are increasingly persistent features. For US industrial firms (think manufacturers and distributors, the focus of our article), navigating this uncertainty requires proactive strategies, not just reactive adjustments. Recent analysis reveals key trends:
-
Tariffs Tend to Persist: History shows tariffs often become entrenched. Expect current and future tariffs to have lasting implications as markets reset, not just be fleeting issues.
-
Market-Wide Price Increases Follow: When tariffs raise costs for some, competitors often follow suit, even if only affecting a portion of their portfolio. Tariffs effectively elevate market price expectations. Following the 2018 steel tariffs, many domestic US firms not directly sourcing imports still adjusted prices upward.
-
Affected Companies Seek New Markets: Businesses hit hard will actively diversify customer bases (geographically or by segment) to offset losses.
-
Supply Chains and Production Adjust: Companies reconfigure operations, relocate production (e.g., nearshoring to Mexico/USMCA partners), or diversify suppliers to mitigate costs and risks.
-
Innovation is Spurred by Cost Pressures: Tariffs drive R&D towards alternative materials (e.g., composites vs. steel) or efficiency improvements to reduce reliance on newly expensive inputs.
-
Customer Spend is Reshaped: Shellshocked customers often review their spending and look for alternative ways to source business, sometimes outpacing their suppliers in making permanent procurement changes.
Given these trends, US industrial firms should consider:
-
Integrate Increases into Core Pricing: When adjustments are needed (direct impact or following the market), build them into list prices. Transparency about market pressures is often understood by customers (think back to the days of heavy inflation in recent years).
-
Maintain Competitive Price Positioning: Crucially, even if you aren’t directly hit, monitor affected competitors. As they raise prices, adjust yours strategically to maintain desired positioning and capture the upward shift in market price expectations. You can still remain competitive in the marketplace, but do not leave margin on the table!
-
Price Strategically in New Markets: When diversifying, research local needs, willingness to pay, and competitive dynamics thoroughly. Don’t assume home market pricing translates – have a localized competitive price gap approach and quantify your differential value.
-
Retain Efficiency Savings: If tariffs spur cost-saving innovations, resist passing them back immediately. Market prices have likely risen; capitalize on efficiency to improve margins or reinvest.
Implementing these strategies effectively requires a solid foundation in Pricing and Revenue Growth Management (RGM) – understanding segmentation, mix, discounts, cross-selling, and value-based pricing. While tariffs create uncertainty, proactive strategies turn disruption into opportunity.

The Perils of Uniform Price Hikes
While market prices may rise broadly due to tariffs, simply applying a uniform cost-plus hike across your own portfolio remains a deeply flawed approach internally. Why? Because your specific market isn’t uniform. Some products are contractual, others spot-bought. Some customers see your part as strategic, others as a commodity with ready substitutes. Some SKUs face minimal competition, others are a click away from alternatives. Treating this complex reality as a single price-elastic blob invites a pricing and profit disaster later on.
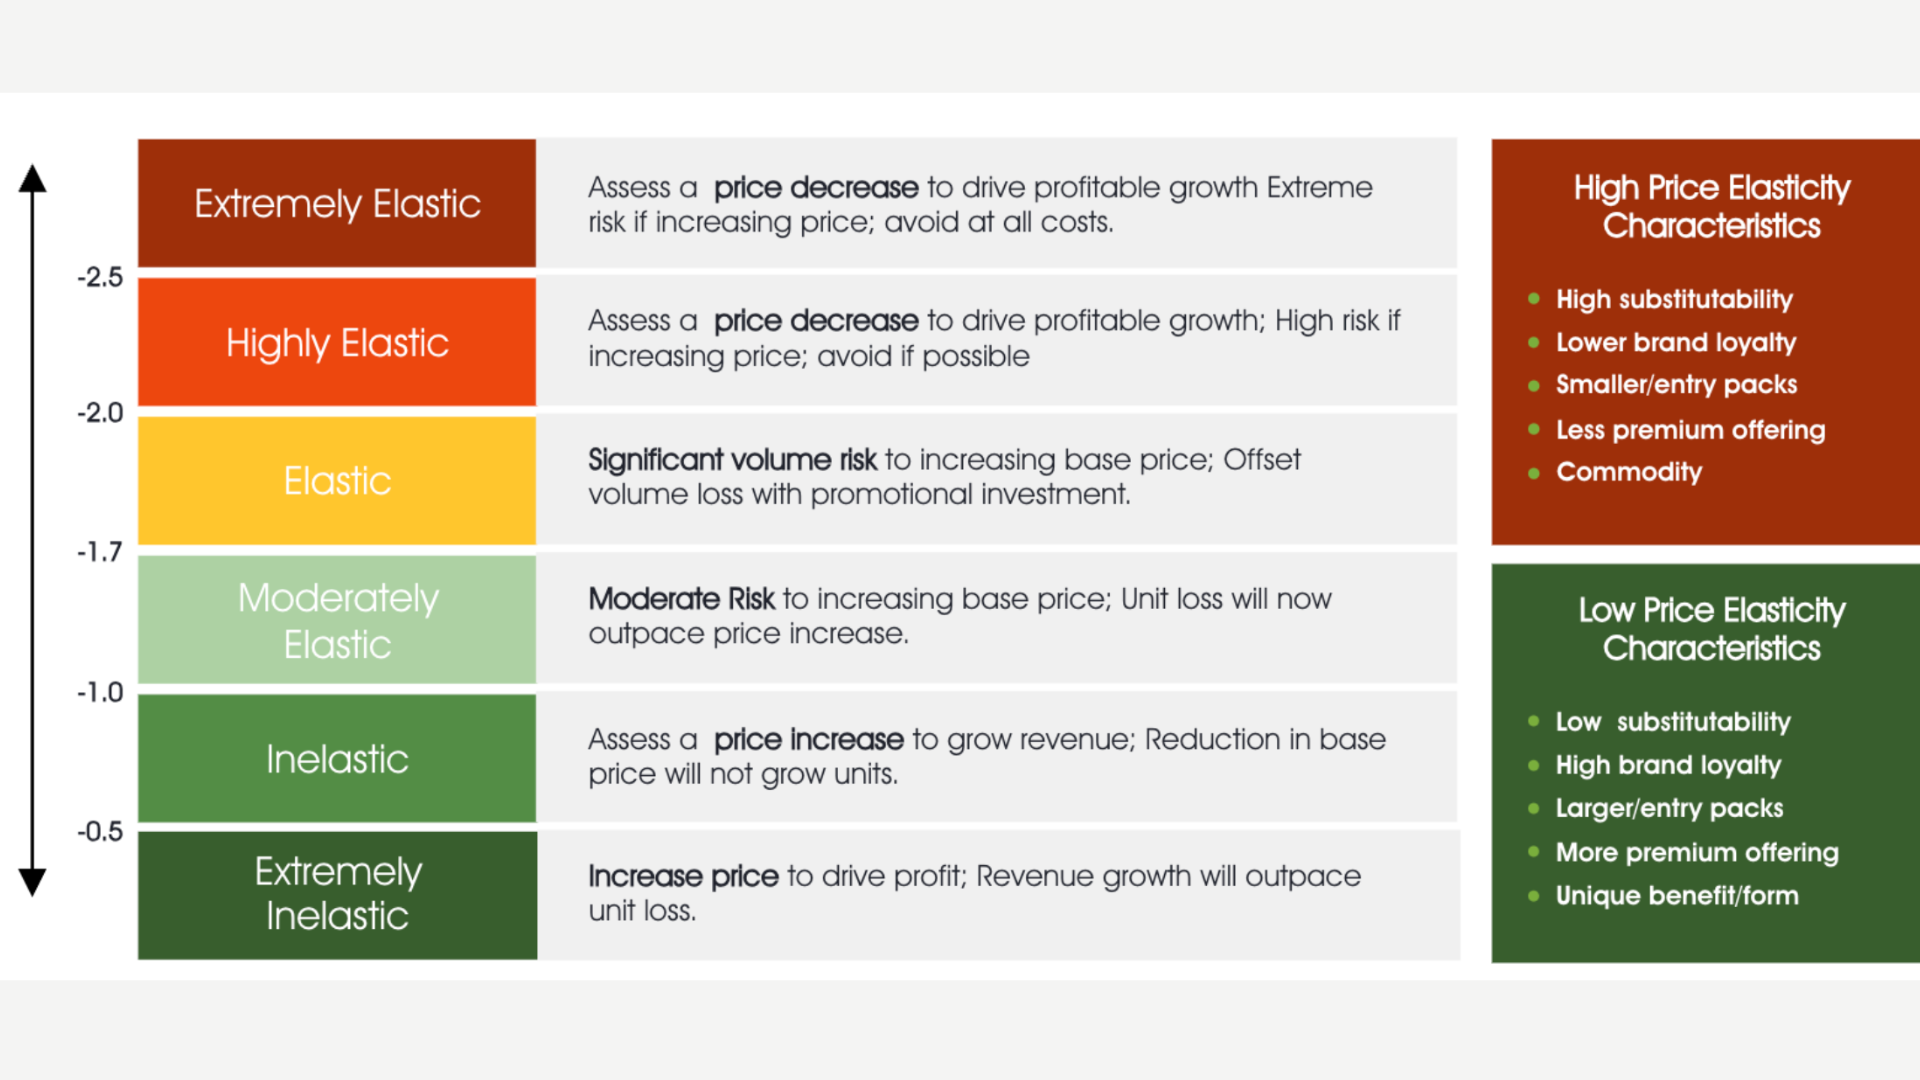
Pricers use the price-elasticity coefficient to measure demand sensitivity. A value of –0.3 suggests a 10% price rise might cut volume by 3%. A coefficient of –2.5 means the same hike could slash volume by 25%. Without understanding this across SKUs and customer segments, deciding between a 25%, 15%, or even 0% increase becomes guesswork.
Ignoring elasticity triggers predictable problems, especially during sudden cost shocks like tariffs:
-
Volume Hemorrhage: Highly elastic items lose market share rapidly, often faster than the tariff cost can be recouped on remaining sales.
-
Margin Left on the Table: Highly inelastic items (where customers are less price-sensitive) remain under-priced, sacrificing recoverable margin.
-
Sales Force Undermining: Facing customer backlash on sensitive items, sales teams inevitably carve out ad-hoc discounting exceptions, dismantling the uniform policy and creating pricing chaos (e.g.: high discounting variability, margin loss, etc.)
-
Profit Dilution: The combined effect isn’t just lost volume; it’s often a net reduction in gross profit dollars, even if margin percentage looks okay on paper for the units still sold.
As our prior Revology article notes, tariffs aren’t a “free pass” to raise prices indiscriminately. Customers ultimately care about value, not your cost structure. Understanding your specific “Pricing Game” – whether Cost, Uniform, Power, or Custom – is crucial, as tariffs stress each differently.
The Mid-Market Choke Point: Being Data Rich, But Insights Poor
Large enterprises navigate these complexities with armies of analysts, data scientists, and advanced tools churning out elasticity curves and pricing simulations. Mid-market firms ($10MM – $2Bn revenue) often lack these resources. For many data is fragmented across ERPs, spreadsheets, bespoke price lists, and rebate programs. The lone pricing manager might also handle bids and sales support. This creates a chronic capability gap: leaders know they need sophisticated analysis but struggle to justify the cost, complexity, and lengthy implementation times (6-12+ months) of traditional enterprise tools. They remain “data rich, insights poor,” relying on intuition or lagging indicators when agility is paramount.
Enter Revify Analytics: RGMaaS Tailored for the Mid-Market
Revify Analytics closes this gap. We deliver Revenue Growth Management as a Service (RGMaaS) – a subscription combining a powerful, purpose-built advanced analytics platform with on-demand strategic advisory expertise, designed specifically for the realities of mid-market businesses.
-
A Purpose-Built Analytics Platform (Live in 1-2 Weeks): Forget lengthy implementations. Our cloud-hosted platform (initially via Tableau Online) provides rapid insights:
-
Price Elasticity & Affinity: Machine-learning models calculate demand sensitivity at SKU and customer levels, revealing where you have pricing power and where you risk volume loss.
-
Scenario Analysis: A dynamic sandbox to test various pass-through strategies (full, partial, segmented). Instantly see projected impacts on revenue, volume, and gross profit dollars.
-
Net Price Realization: Track how list prices increases translate to pocket price realization after all discounts and rebates, ensuring tariff recovery isn’t silently eroded.
-
Supporting Modules: KPI Dashboards, Profit & Revenue Drivers (including Price/Volume/Mix/Cost walks), Customer Diagnostics (RFM, Trends), Assortment Diagnostics and Cross-Sell / Up-Sell recommendations provide a holistic view.
-
Embedded Advisory Expertise: Analytics alone don’t produce outcomes. Revify’s expert Pricing & RGM advisors (leveraging deep industry experience) work alongside your team to:
-
Validate model outputs and translate complex analytics into clear insights.
-
Develop practical, customer-ready pricing strategies, roadmaps, and negotiation points.
-
Coach commercial teams to implement insights-backed strategies confidently.

The Importance Scenario Analysis Capabilities in Action
A mid-market distributor of industrial fasteners, with baseline revenues around $50M from three key product families (Hex Bolts, Socket Screws, Threaded Rod), faces a significant challenge: a new tariff is announced, increasing their Cost of Goods Sold (COGS). Simultaneously, market intelligence suggests key competitors are also adjusting prices. The distributor, historically reliant on simple cost-plus pricing, decided to employ advanced analytics for a data-driven approach, aiming to protect profitability without triggering excessive volume loss.
Step 1 – Data Load & Baseline Establishment
The distributor compiled and analyzed 24 months of internal invoice data (SKU, customer, volume, net price, cost) and integrated external market data. This established a clear baseline performance before the tariff and competitor price changes:
Step 2 – Insight: Tariff Impact, Competitor Moves & CPI Elasticity
The tariff directly increased COGS. Furthermore, market intelligence on anticipated competitor price adjustments was incorporated into the analysis. Calculations then determined the Competitive Price Index (CPI) elasticity for each product family, revealing how the distributor’s volume would likely change relative to its price position against competitors.
New Market Conditions & Elasticity Insights:
-
New COGS per Unit (Post-Tariff):
-
Hex Bolts: $3.40
-
Socket Screws: $5.00
-
Threaded Rod: $6.00
-
New Competitor Prices (Post-Moves):
-
Hex Bolts: $5.00 (+25% vs. Baseline)
-
Socket Screws: $6.90 (+15% vs. Baseline)
-
Threaded Rod: $8.80 (+10% vs. Baseline)
-
Modeled CPI Elasticities:
-
Hex Bolts: –0.20 (Very inelastic)
-
Socket Screws: –1.00 (Unit elastic)
-
Threaded Rod: –2.50 (Highly elastic)
Step 3 – Scenario Modeling: Evaluating Pricing Strategies
Using scenario analysis tools, leadership modeled three distinct pricing strategies, focusing on the impact on both Gross Profit dollars and Total Revenue:
Scenario A: Blanket +20% Price Increase
Distributor’s Action: Apply a uniform 20% price increase (Hex $4.80, Socket $7.20, Rod $9.60).
Analysis (A): This aggressive blanket increase boosted Revenue and GP compared to baseline. However, the high price on the elastic Threaded Rod (Effective CPI 109.1) caused significant volume loss (-22.7% based on the 9.1 point CPI increase * elasticity), capping the potential GP gain. Overall volume dropped by 9.3%.
Scenario B: Blanket +10% Price Increase
Distributor’s Action: Apply a moderate, uniform 10% price increase (Hex $4.40, Socket $6.60, Rod $8.80).
Analysis (B): This strategy yielded the highest revenue and slightly increased volume (+1.8%). Pricing was very competitive (Raw CPI 88 on Bolts hit the 90 Effective CPI floor, resulting in a 2% volume gain based on the -10 point effective CPI change * elasticity; Raw CPI 95.7 on Screws; Raw CPI 100 on Rods). However, the price increases were insufficient to cover the higher COGS, especially on Bolts, resulting in a lower total Gross Profit than the baseline and Scenario A.
Scenario C: Segmented “Surgical” Price Increase
Distributor’s Action: Leverage CPI elasticity insights: Aggressive on inelastic (Hex +35% to $5.40), moderate on unit elastic (Socket +10% to $6.60), conservative/strategic on highly elastic (Rod +8.75% to $8.70).
Analysis (C): The surgical approach optimized outcomes. The large +35% price increase on highly inelastic Hex Bolts maximized GP gain ($5.90M) with minimal volume loss (-1.6%, from the +8 point CPI change * elasticity). Socket Screws gained volume (+4.35%, from the -4.3 point CPI change * elasticity) by pricing competitively. Threaded Rod was priced slightly below the competitor (Effective CPI 98.9), leveraging high elasticity to gain volume (+2.84%, from the -1.1 point CPI change * elasticity) while still capturing a solid margin increase over baseline. This strategy yielded the highest Gross Profit dollars and the highest Revenue.
Concluding Interpretation: The analysis, incorporating CPI elasticity and competitor actions, clearly demonstrated the superiority of a segmented pricing strategy. While blanket increases offered mixed results (Scenario A improved GP but hurt volume; Scenario B boosted revenue/volume but killed GP), the analytical approach leading to Scenario C delivered the optimal outcome.
Beyond Tariffs: Building Lasting Pricing Resilience
Tariffs are just one type of shock – raw material spikes, freight surcharges, currency swings – that test pricing discipline. Mastering elasticity-driven RGM now builds a durable competitive advantage:
-
Decision Speed: Shrink pricing decision cycles from weeks of spreadsheet analysis to hours of scenario modeling.
-
Evidence Over Anecdote: Shift internal pricing debates from gut feel to data-backed insights.
-
Value-Focused Conversations: Equip sales teams to discuss price changes based on value and market dynamics, not just cost pass-through.
Take Your First Step Towards Intelligent Pricing
If tariffs—or any cost surge—are threatening your margins, stop reacting and start responding intelligently. The fastest way to see elasticity-aware RGM in action is to join the Revify Analytics waitlist.
Waitlist Members Receive:
-
Immediate Resources: Access our whitepaper, “Overcoming Growth Headwinds,” detailing AI/ML-driven pricing tactics.
-
Exclusive Live Demonstration: Get invited to a session where Revify advisors model real tariff/cost scenarios and answer your specific questions.
-
Priority Demos: Be first in line for a demo of the soon-to-be-launched Revify Platform.
Tariffs may fluctuate, but building advanced analytics provides growth and defensive capabilities for both the short and long term. By replacing reactive cost-plus reflexes with proactive price-elasticity intelligence – delivered through Revify’s accessible RGMaaS – mid-market leaders can turn today’s cost crisis into tomorrow’s competitive edge.
Join the Revify Analytics Waitlist Now
Unlock first-look access to Revify’s RGMaaS platform – purpose-built to bring enterprise-grade analytics and on-demand expert guidance to mid-market teams. Reserve your spot today and be among the first to transform your pricing strategy from reactive to resilient.

