
RFM Analysis as an Important Revenue Growth Analytics Capability - Part 2
Part 2: Methodology and Customer Segments
Part 1 of our article described RFM Analysis as a powerful Revenue Analytics technique. RFM helps us understand customer behavior and segment them into performance groups we can target with surgical sales and marketing campaigns.
By analyzing the Recency, Frequency, and Monetary value of customer purchases, companies can gain helpful insights into their purchasing behavior and make data-informed decisions to improve customer retention, increase profits and drive revenue growth.
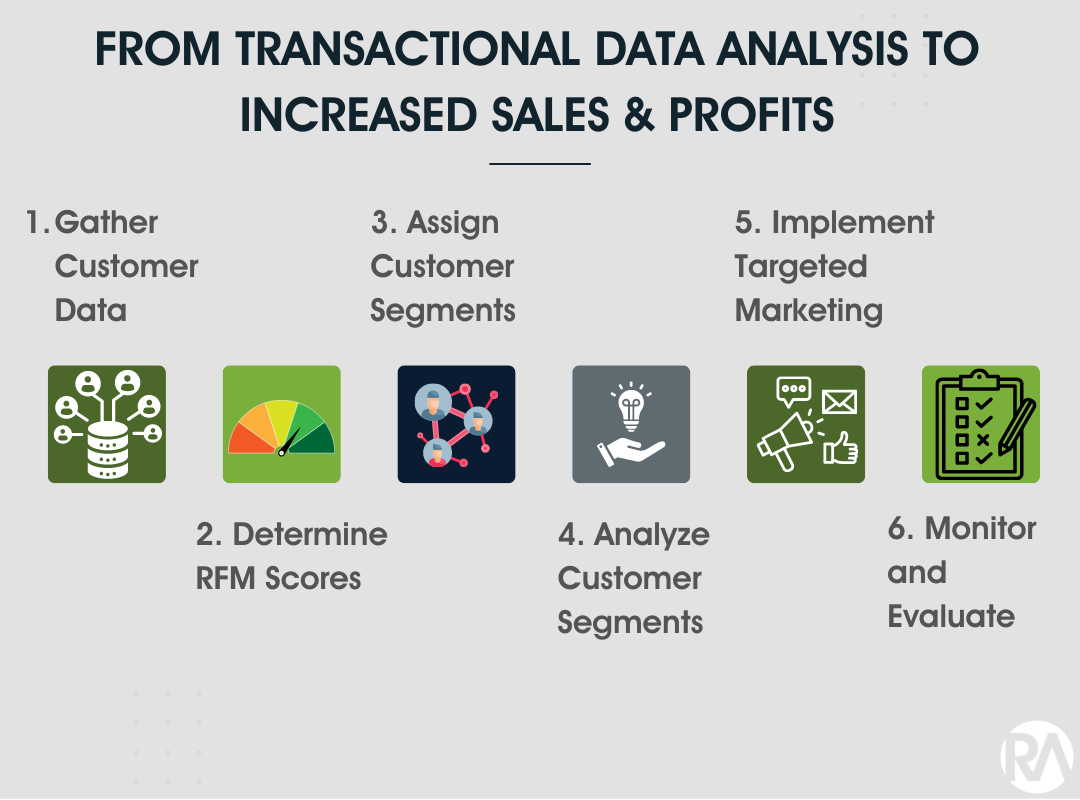
The six-step process for leveraging RFM Analysis to drive profitable growth involves the following:
Gathering customer data
Determining RFM scores
Assigning customer segments
Analyzing customer segments
Implementing targeted marketing
Measuring the effectiveness of the campaigns
Although RFM Analysis is commonly used in the retail industry, we can apply it to any functional domain that touches the customer, including pricing, supply chain, A/R, and customer service. RFM Analysis can benefit nonprofit organizations by understanding donor behavior to optimize fundraising initiatives.
How to Calculate RFM Scores
The overall RFM score consists of three metrics, each assigned a value from 1-5, with 5 being the best score. This scoring system is based on the customer's Recency, Frequency, and amount of money spent (i.e., how recently they purchased, how often they are buying, and how much they typically spend). A customer who has made several high-value purchases within the past month would receive an RFM score of 555, while one who bought only one (cheap) product a year ago would receive an RFM score of 111.
There are two main ways in which we can calculate RFM scores:
A. Performance quintiles divide customers into five distinct groups (quintiles) based on their Recency, Frequency, and amount of money spent. Using the performance quintiles method, each group would have an equal number of customers depending on the size.
B. The heuristics approach uses predetermined intervals (set by internal experts) to assign RFM scores. For example, a customer who purchased 12 months ago might receive an R score of 1, while someone who bought six months ago would get a score of 2. It's important to note that when using this method, it's vital to determine appropriate values for the preset intervals, as inaccurate values will lead to incorrect assessments of customer loyalty and RFM levels.
To conduct a simple RFM analysis, let's assume we have 100 customers. We will rank our customers based on each of the three criteria separately.
We will begin with ranking customers on Recency first, sorting them from the most recent purchasers at the top to the oldest at the bottom. Since we are using the Performance Quintiles approach (automatic segmentation), this results in 20% of customers receiving a recency score of 5 (top 20%), followed by 20% of customers getting a 4 (next 20%) and so on until the bottom 20% gets marked with a 1.
Next, we will follow a similar process with Frequency - sorting customers from most frequent at the top to least frequent purchasers at the bottom. Again, 20% of customers will receive a 5, while the lowest 20% will get a 1.
Lastly, we'll rank these same people by Monetary value (either Total or Average Spend), with the big spenders (top 20%) getting marked with a score of 5 and low spenders (bottom 20%) receiving a score of 1.
Combining these individual R, F, and M rankings helps us arrive at an aggregated RFM score which is the simple or weighted average of each attribute's scores. If you are using a weighted average method, when it comes to determining the importance of each RFM variable, it depends on the industry:
In Medical Devices, the average transaction value is typically high, but Frequency and Recency are low. After all, a dentist will not buy a $100K 3D Imaging equipment every month. Therefore, you might give more weight to the Monetary and Recency attributes rather than Frequency.
On the other end of the spectrum, specialty retailers like thrift stores may prioritize a customer's Recency, and Frequency stores over their Monetary since their most loyal shoppers may have many purchases throughout the year at lower Average Transaction Sizes.
How to Create RFM Segments
There are a couple of different ways you can build your RFM segments:
A. Manual: Using the RFM score sequence
We can use the RFM score sequence (e.g., 345, 543, 255) to gather valuable insights about our customer base, from how recently/frequently they purchase your products to how much money they tend to spend.
You can bucket each customer's RFM sequence in one of 11 traditional RFM segments, from Champions and Loyal customers to Hibernating and Lost.
B. Automatic: Using a popular clustering algorithm like "k-means."
Instead of relying on the previously calculated RFM scores to manually assign segments, we rely on a popular unsupervised Machine Learning model like "k-means" to group customers into distinct clusters based on their "Recency," "Frequency," and "Monetary" values. The distinction with this option is two-fold:
We are letting the algorithm assign customers to different clusters. We can use several methods to determine the "optimal" number of clusters (i.e., "elbow" or "silhouette" methods), but we'll save that for another article.
We are using the raw metrics (i.e., $$$ spent, # of days ago last purchased...) to perform customer segmentation instead of the RFM scores that range from 111 to 555.
The manual approach (RFM score sequence) is more convenient, and we can explain it easier to a non-technical audience. However, using a clustering algorithm often lets us create more meaningful groups vs. just using percentiles or the heuristics method.
Review of RFM Segments
To make this article more intuitive, let's stick with our manual approach and review which types of customers make it into each segment, along with reviewing examples of appropriate sales and marketing actions for each.
We will also review which score belongs to each RFM segment, although much like the weighted average RFM example above, this one is also subject to industry nuances. I recommend that you review the logic for your industry in detail and make any necessary changes.
We'll use a modified version of the "RFM Analysis" workbook found on Tableau exchange to visualize the customers and segments. If you work with Tableau regularly, please check out this resource, as it has a decent collection of purpose-built dashboards for various functional areas (marketing, finance, supply chain, etc.).
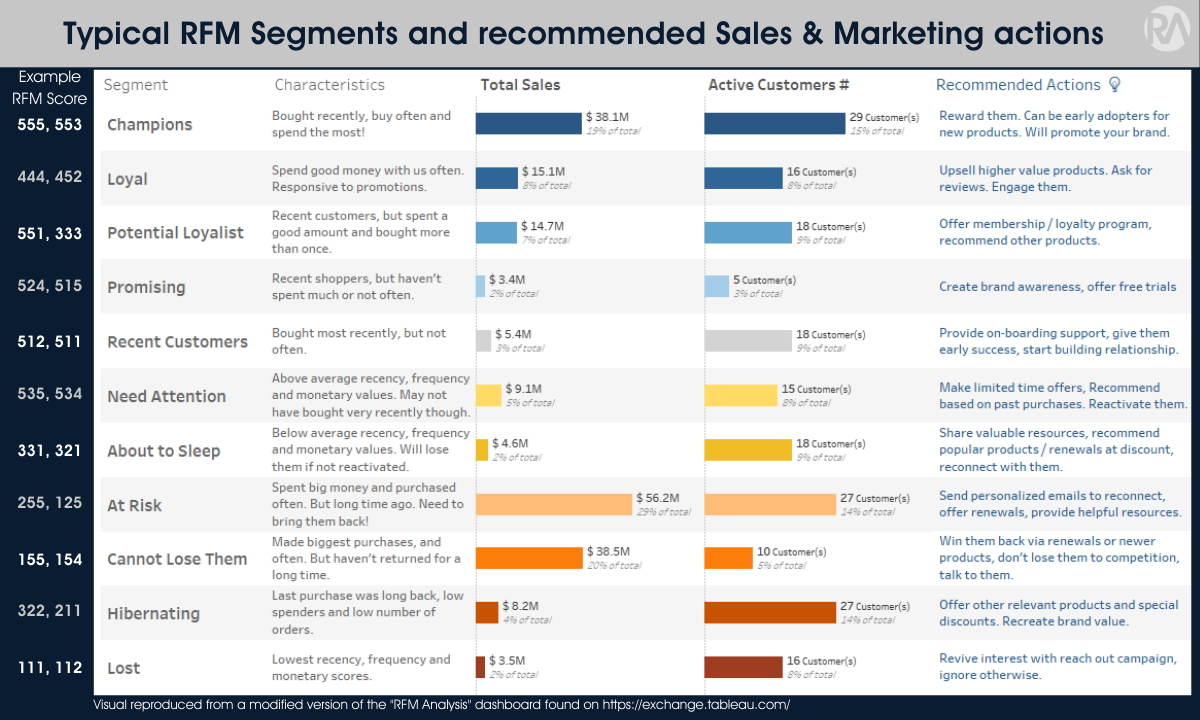
The visual below depicts the classic 11 RFM segments, their purchase characteristics, and recommended sales & marketing actions.
Some of the most critical segments to pay attention to are:
Champions: Customers with high RFM scores (e.g., high Frequency, high monetary value, and recent purchases). These customers are loyal and valuable and are likely to make repeat purchases. Recommended sales and marketing actions include offering personalized incentives and rewards to maintain their loyalty.
Loyal Customers: Customers with High Frequency and monetary value but fewer recent purchases than Champions. These customers are loyal and valuable but may require incentives to keep them engaged. Recommended sales and marketing actions include offering exclusive promotions, personalized incentives, and loyalty programs.
Cannot Lose Them: These customers have low Recency scores but high Frequency and Monetary value scores. They are frequent shoppers but last purchased a while ago. Recommended sales and marketing actions include re-engagement campaigns, special offers or discounts, and customer feedback programs.
The table below lists our RFM Segments and Scores. Please note that these assignments are industry-agnostic (a general rule with RFM analysis), and you must apply your judgment about your specific industry or business model.
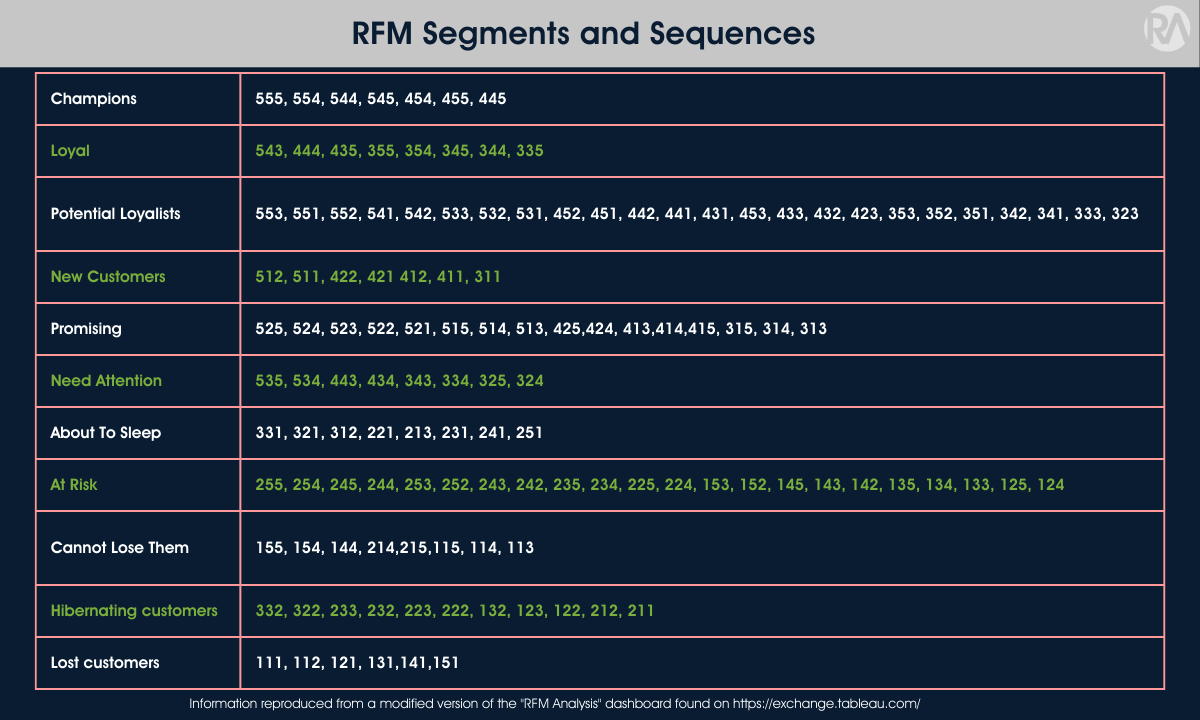
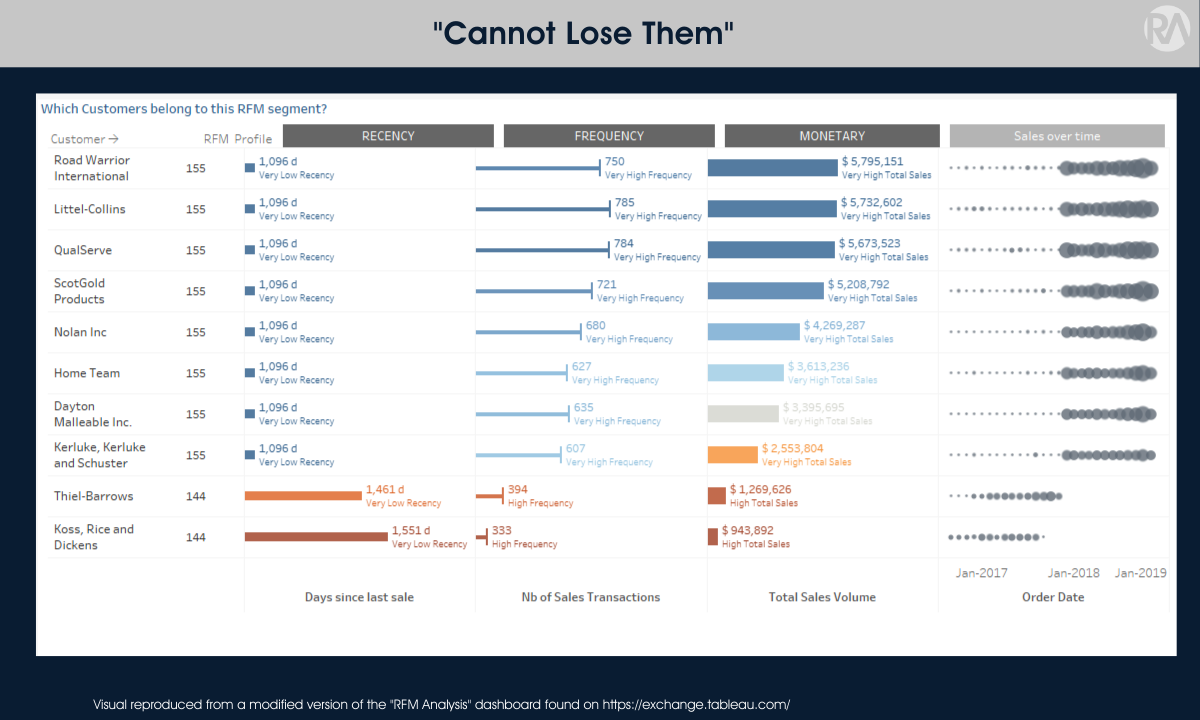
Notice the contrast between the "Champions" and "Cannot Lose Them" segments:
Champions (our Best of the Best) all feature customers that have made purchases in the last month (and most of them purchased in the last couple of days), made orders at least every other day throughout their tenure, and generally have spent more than $1MM with us.
On the other hand, the "Cannot Lose Them" segment features customers who are often substantially larger ($2MM-5MM) than our Champion segment and make similarly frequent purchases. However, it's been a while since they last purchased from us.

Vs.
To read Part 1 of this article, please click here.
Subscribe to
Revology Analytics Insider
Revenue Growth Analytics thought leadership by Revology?
Use the form below to subscribe to our newsletter.