
Driving Sales & Margin Performance with Self-Serve Analytics
B2B Sales and Pricing Dashboard Example
Many middle-market companies are struggling to do action-oriented Commercial Analytics on a real-time basis. Understanding Sales, Pricing, and Margin performance vs. corporate objectives and strategies, along with proactively identifying and quantifying quick wins for improvement, is often a multi-day reactive, knee-jerk exercise. Pricing, Finance, and Commercial leaders are reticent to invest $MMs in turnkey price analytics solutions given high costs and long lead times – not to mention lack of flexibility and adoption issues that often yield a suboptimal return on investment.
Fortunately, you can do most of the above quickly, effectively (and cheaply!) using popular self-serve BI solutions like Tableau or Power BI, open-source tools like R/Python (or a combination of BI + open source to incorporate predictive and prescriptive analytics).
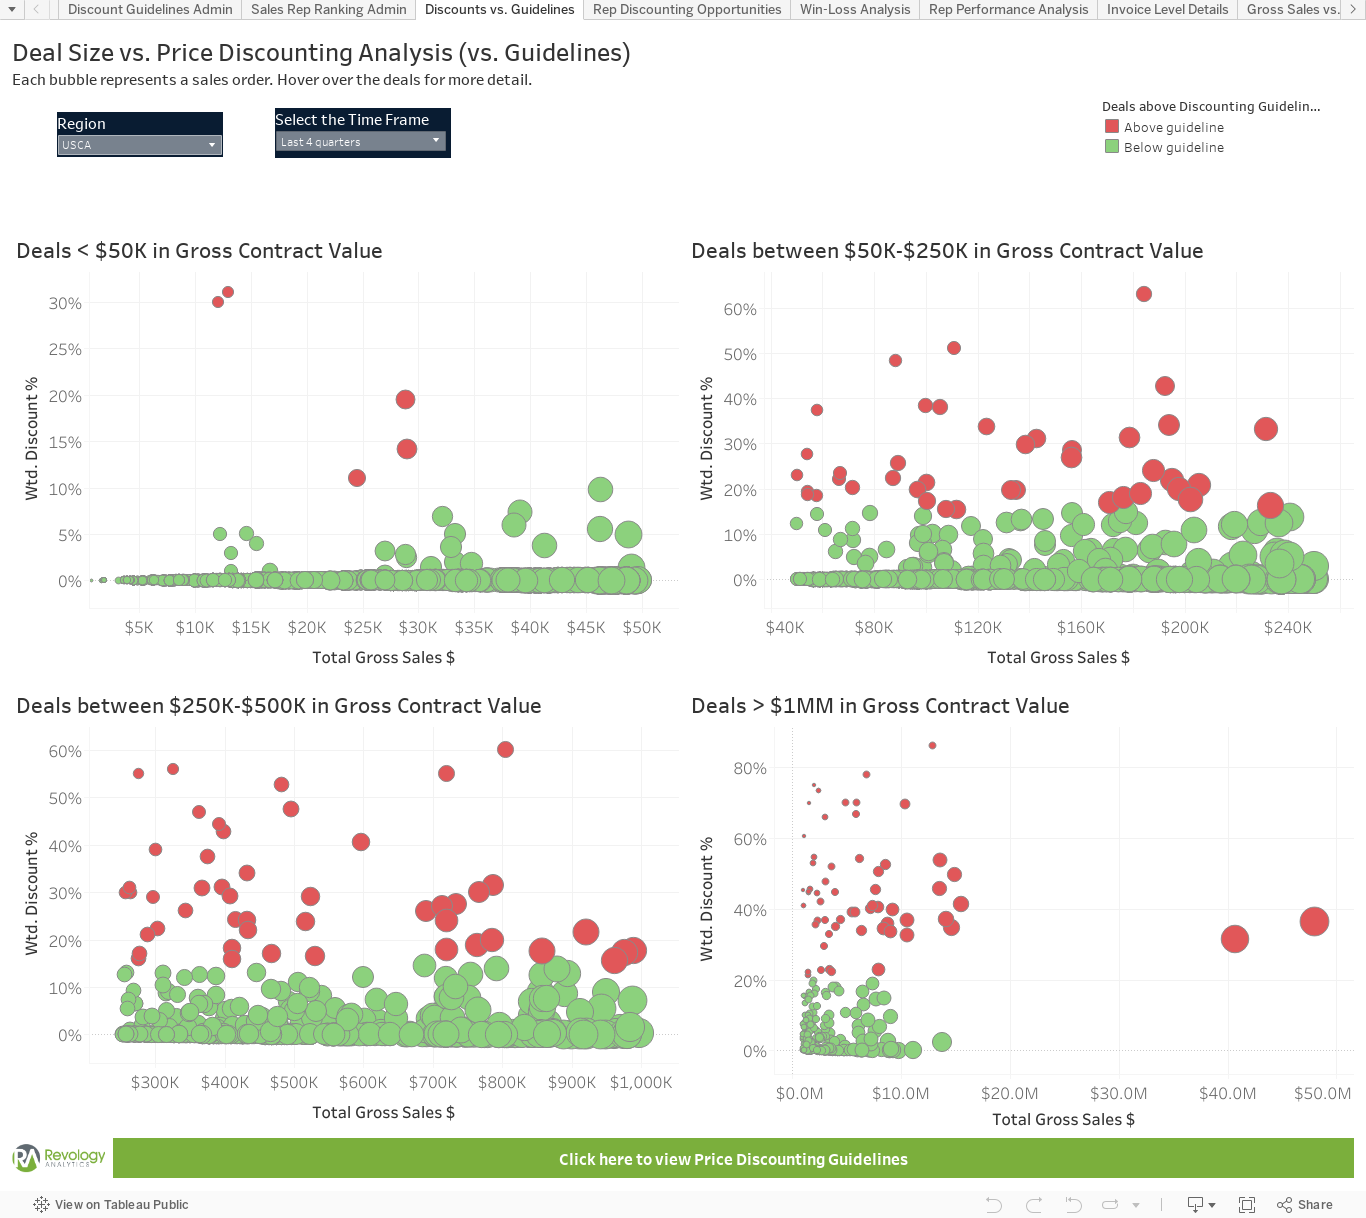
Check out this example B2B Pricing Dashboard we built (in under 4 hours) on Tableau Public (B2B pricing bid data courtesy of Tableau).
Once you align with your stakeholders, a) on the business outcomes you want to drive, b) sketch out the analyses/visuals/insights you want users to engage with, and c) determine the suitable data sources and metrics to use, the rest is a piece of cake. I’ll be sure to post more examples shortly – in the meantime, feel free to play with it, download it, or add your suggestions.
Subscribe to
Revology Analytics Insider
Revenue Growth Analytics thought leadership by Revology?
Use the form below to subscribe to our newsletter.