
RFM Analysis as an Important Revenue Growth Analytics Capability - Part 1
Part 1: A gentle introduction
By now, most of you know that Revenue Growth Analytics is all about building the foundational commercial analytics capabilities that enable and dictate transformative Revenue Growth Management (RGM) strategies for organizations.
RGM goes well beyond "Pricing," which is mainly about determining a product's optimal prices that maximize Gross Profits. RGM takes this "Pricing" concept further by introducing strategies and tactics to increase a company's Net Revenue and Profitability over time.
Revenue Growth Analytics helps answer critical Customer questions, such as:
How can we improve Gross Profits through smarter Customer Mix Management?
Where are my most significant Customer retention, upsell, and cross-sell opportunities to drive Growth, and what's the annualized value to my company?
Which prospective customers have the highest propensity to drive the best Customer Lifetime Values?
How should we adjust our sales and marketing efforts based on customer segmentation?
Which customers deserve lower Discounts (or higher List Prices) due to their purchase history and Gross Margin (or their Cost-To-Serve profiles)?
Given their history, which groups of customers deserve reduced or free freight charges?
What is RFM Analysis?
RFM (Recency-Frequency-Monetary) Analysis is a critical Revenue Growth Analytics technique that sets the foundations for answering the above questions.
RFM Analysis has traditionally been employed in the Marketing domain, although it applies to any functional domain that touches the customer (Pricing, Supply Chain, A/R, Customer Service, etc.). It's a simple analytical technique but highly effective at driving customer insights that lead to improved customer retention, increased profits, and greater customer satisfaction through smarter and more surgical sales and marketing campaigns.
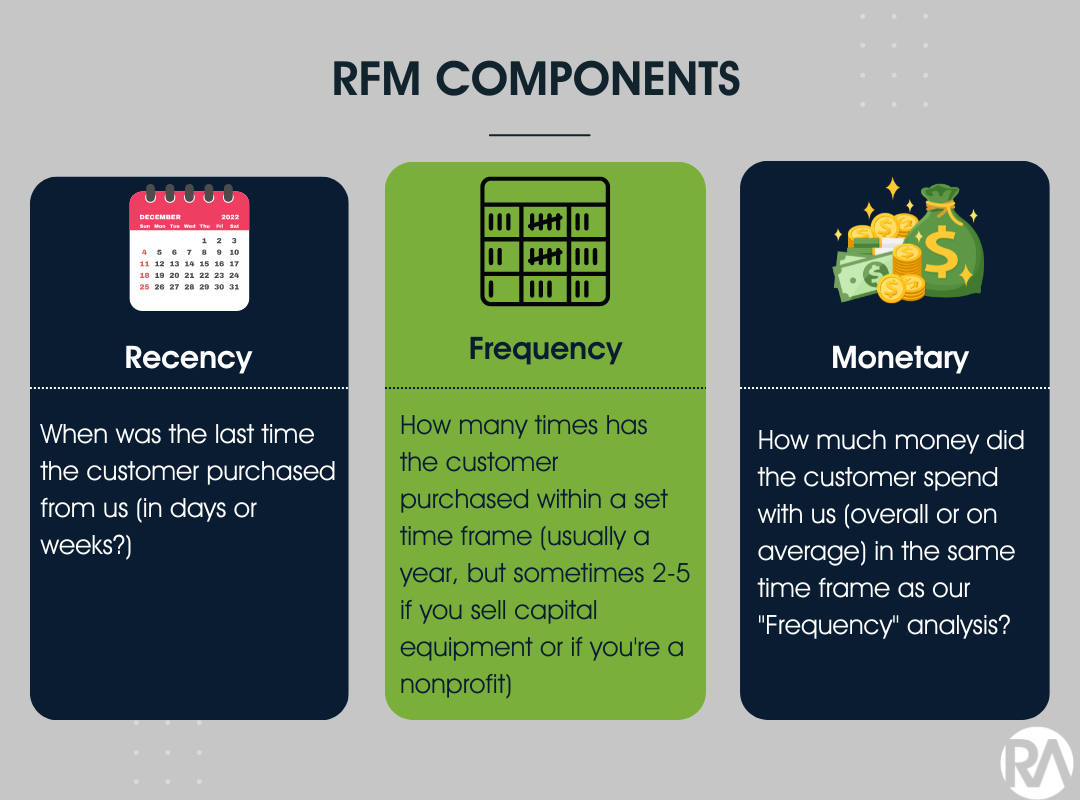
"Recency" refers to the length of time since a customer's last purchase. This attribute helps you identify customers who have most recently engaged with you vs. those who may be at risk of leaving.
"Frequency" indicates how frequently a customer purchases within a set time frame. By understanding purchase frequency by customer, you can improve your customer acquisition strategies through look-alike modeling or spur additional purchases from existing customers via targeted promotions and discounts.
The "Monetary" value measures the amount of money a customer spends within a set period. You can use this information to determine which customers are worth investing more or less marketing resources in or who you should give special incentives or rewards for their loyalty. You can also use this data to adjust pricing strategies (carefully) for different customer groups based on their purchasing power and spending habits.
From Transactional Data Analysis to driving Profitable Growth
The path to leveraging RFM analysis to drive profitable Growth in organizations is roughly a six-step process, as illustrated below:

Gather Customer Data: query your transactional and CRM data for customer sales history, demographics, and other customer identifiers.
Determine RFM Scores: Once you have your transactional data in a structured format, you need to determine the Recency, Frequency, and Monetary Value scores for each customer.
Side note on RFM Scores:
Part 2 of this article will dive deeper into the various analytical methods for calculating RFM scores. For now, assume that Customers will receive a score of 1 (worst) to 5 (best) for each R-F-M metric based on which performance quintile they fall in. So if Customer ABC's Recency (in # of weeks) is in the 1st quintile (the top or best quintile), they will receive a score of 5. Suppose their Frequency puts them in the middle quintile (receiving a score of 3), and their Monetary behavior based on total purchases puts them in the 5th quintile (worst, receiving a score of 1). We sum up their R-F-M scores to get a 9 (out of a possible total of 15).
Assign Customer Segments: Once you have determined the RFM scores for each customer, you can assign them to a segment. You can do this based on a popular, predetermined logic that groups RFM scores into eleven possible segments; you can assign the segments based on expert opinion and your numerical thresholds, or you can do it based on a clustering algorithm (preferred).
Analyze Customer Segments: After assigning each customer to a segment, you should analyze each to better understand their purchase behavior and formulate hypotheses on what sales or marketing treatment they should receive to boost performance.
Implement Targeted Marketing: You can implement targeted marketing campaigns or sales conquests for each customer segment based on customer segment insights. It can include personalizing promotions or discounts, improving customer engagement to reduce churn, driving product cross-sells or upselling for specific customer segments to boost revenues.
The underlying logic for RFM analysis and the foundations for sales and marketing actions are the same for every industry, regardless of whether it's B2B or B2C.
Retailers will typically have the largest (and most diverse) customer data available. RFM Analysis, coupled with other behavioral segmentation data, can be a gold mine for boosting sales and profitability.
Many manufacturers and distributors struggle with inaccurate and incomplete CRM data, so RFM segmentation based solely on transactional data analysis is often the only path. Nevertheless, this approach can still offer a considerable upside for B2B companies as it's a relatively underutilized capability.
One industry that gets rarely talked about is the Nonprofit sector. Nonprofits can also benefit from RFM Analysis by understanding donor behavior to rightsize their fundraising initiatives. Nonprofits can prioritize fundraising efforts towards their most valuable donors, create custom marketing campaigns to retain at-risk donor groups or bring in new, high-potential donors based on look-alike modeling of the "best" RFM customer segments.
To be continued…
In Part 2 of our RFM Analysis series, we'll dive deeper into the analytical approach with examples and discuss the various RFM segments and their sales and marketing implications.
If you enjoy the Revenue Growth Analytics content by Revology Analytics, please leave us your feedback here.
Subscribe to
Revology Analytics Insider
Revenue Growth Analytics thought leadership by Revology?
Use the form below to subscribe to our newsletter.