
Businesses today have no shortage of data but many have a shortage of real-time, actionable insights. They may spend countless hours combing through datasets and organizing them into the appropriate warehouses, but their analytics processes may still fail to drive greater profits.
Part of the reason companies are insight-starved despite being data-rich is that their revenue growth analytics processes may only focus on pricing. Without a comprehensive revenue growth analytics pipeline, companies’ insights may prove superficial, causing them to miss out on opportunities for further expansion. When teams look deeper into more advanced metrics, they can reduce operational inefficiencies, access new demographics, and obtain higher conversion rates, ultimately achieving greater profitability.
In this article, we’ll look at the importance of digging deeper with more comprehensive revenue growth analytics capabilities. First, we’ll prove how revenue analytics goes beyond pricing and highlight techniques for gathering more comprehensive revenue data. We’ll also examine how you can leverage leading-edge technology to create a more advanced analytics pipeline, as well as some of the most effective strategic revenue management practices. Then, we’ll show how organizations armed with these insights can improve their business performance — and how Revology Analytics can help drive their growth.
Comprehensive Revenue Growth Analytics
Much of today’s Revenue Growth Analytics & Management practices focus on optimizing the price of a company’s goods and services offered. While the value of proper pricing cannot be overlooked, there are many other metrics that a strategic revenue analytics pipeline will evaluate as well. Some of these include:
-
Customer Acquisition Cost (CAC): The total cost required to acquire a new customer. CAC = Total cost of acquisition / Total number of new customers acquired
-
Customer Lifetime Value (CLV): The total revenue a business can expect from a single customer account throughout its relationship with the company.
CLV = (Average Purchase Value × Average Purchase Frequency × Average Customer Lifespan)
-
Churn Rate: The percentage of customers who stop doing business with a company over a given period.
Churn Rate = (Number of Customers Lost in a Period / Total Number of Customers at Start of Period) × 100
-
Net Revenue Retention (NRR): The percentage of recurring revenue retained from existing customers over a given period, including expansions and contractions.
NRR = (Revenue at start of period + Upgrades – Downgrades – Churn) / Revenue at start of period
-
Average Revenue Per User or Account (ARPU / ARPA): The average amount of revenue generated per user or customer.
ARPU = Total Revenue / Number of Users
-
Conversion Rate: The percentage of potential customers who take a desired action (e.g., making a purchase or signing up for a service).
Conversion Rate = (Number of Conversions / Total Number of Visitors or Leads) × 100
-
Customer Acquisition Payback Period: The time it takes for a company to earn back the cost of acquiring a new customer.
Payback Period = CAC / (Average Revenue per Customer per Month × Gross Margin %)
-
Revenue Growth Rate: The rate at which a company’s revenue is increasing over a specific period.
Revenue Growth Rate = ((Current Period Revenue – Previous Period Revenue) / Previous Period Revenue) × 100
-
Net Promoter Score (NPS): A measure of customer loyalty and satisfaction based on how likely customers are to recommend a company’s products or services.
NPS = % of Promoters – % of Detractors
-
Gross Margin Return on Investment (GMROI): A metric that evaluates the profitability of inventory by measuring the amount of gross profit earned for every dollar invested in inventory.
GMROI = Gross Margin / Average Inventory Cost
These are some of the most fundamental revenue analytics metrics that can help companies improve their business intelligence — and they help analysts dive deeper than just pricing metrics (e.g., net price realization, profitability, mix impacts, etc.). When companies scour their revenue data for more comprehensive insights into their operations, they can better optimize their prices, identify which demographics drive the most value, how best to appeal to their base, how sustainable their current revenue model will be in the future, and how they can become more resilient and profitable.
Integrating Advanced Analytics
Most mid-market companies (those $10MM – $1B in revenues) have too much data to be managed manually or in random Excel sheets. If businesses hope to convert their vast datasets into profit, they’ll need to integrate the popular advanced analytics technology into their workflows.

Fortunately, recent technological advancements in artificial intelligence (AI) and related fields have given businesses more opportunity than ever to extract meaningful value from the data they store. Some of the most beneficial capabilities for building an advanced analytics pipeline include:
-
Machine Learning and Predictive Analytics. Powered by advanced statistical algorithms, these tools use massive datasets to detect patterns and predict future trends. Possible uses include forecasting customer churn based on engagement patterns, optimizing product mix recommendations for cross-selling, and predicting customer lifetime value to inform acquisition strategies. These insights go far beyond simple pricing analysis, allowing businesses to anticipate future outcomes and make data-driven decisions across multiple aspects of revenue growth.
-
Natural Language Processing (NLP). This ML capability can analyze unstructured text data to gain insights. Applications include analyzing customer feedback to improve product features, monitoring social media sentiment to gauge brand perception, and extracting key information from sales call transcripts to improve conversion rates. By tapping into these rich sources of data, companies can uncover revenue opportunities that traditional analytics might miss.
-
Data Visualization Tools. Popular tools like Tableau or Power BI transform complex data into easily understandable visual formats, with easy drill-downs for diagnostic analytics. They can be used for creating interactive dashboards to track key revenue and profitrability metrics in real-time, visualizing customer journey maps to identify drop-off points, and illustrating market segmentation for targeted marketing strategies. This allows teams to quickly grasp complex revenue trends and act on them effectively.

-
Automation Tools. Analytics (including Pricing and Finance) teams are often understaffed and overwhelmed. Automation tools can remove the burden of menial analytics processes and enhance your team’s productivity. The result is potential savings in labor, faster analysis, and a staff that’s free to dive deeper into the data to find more chances for profit. Examples include automating data collection from multiple sources, setting up alerts for significant changes in key performance indicators, and generating regular reports on revenue growth metrics.


Another key tool for building an advanced analytics pipeline is a robust cloud infrastructure (e.g.: AWS, GCP or Microsoft Azure). With so much data to store and process, many businesses would be unable to analyze the opportunities for revenue growth if they kept it on premise — and would find it too cost-intensive to do so. Cloud platforms offer scalable solutions for real-time data processing, collaborative analytics environments, and cost-effective storage and computing resources for big data analytics.
Case Studies
With these tools in place, many companies have leveraged revenue growth analytics to optimize their operations and improve their business performance. Some case studies of organizations that Revology has helped with revenue growth analytics capabilites include:
-
A tire manufacturer who needed an algorithm that would automatically generate clearance points designed to eliminate unproductive inventory while maximizing gross profits.
-
A brick & mortar retailer that needed a new automated, dynamic pricing system so it could update its legacy pricing process and eliminate manual pricing.
-
A food and beverage supplier that sought to expand their in-house Promotion Effectiveness Optimization system and educate their 150+ member sales team on the new pipeline — and we did it twice as fast and at 25% of the cost as a turnkey solution
-
A leading European fashion retailer who needed a foundational Revenue Analytics platform built in Tableau to replace their Excel workbooks.
-
A key chemical manufacturing company that wanted to develop a dynamic Sales and Performance Insights Navigator for their US division using Power BI, replacing static Excel reporting.
From eliminating excess inventory to shifting to offering smarter promotions, revenue growth analytics can help streamline operations while keeping companies ahead of competitors.
Optimizing Key Financial Metrics
Even if companies have the technology to dive farther into revenue and profitability data, they still must implement the right tactics to drive business growth. Revenue growth management (RGM) seeks to leverage the insights gained by revenue growth analytics so that organizations can increase their profitability.
Many tools that RGM employs hinge upon the findings discovered by analytics teams that reside in Pricing, Finance, Marketing or a centralized Analytics COE organization. That makes revenue analytics the foundation of RGM, empowering decision makers to maximize profit and net revenue, among other financial metrics.
RGM goes far beyond pricing, though, seeking to maximize revenue and profitability over the long haul. Revenue analytics must, therefore, attempt to answer deeper questions about all the facets that pertain to a company’s RevOps, such as:
-
How can smarter Product or Customer Mix Management improve our revenue and profit optimization?
-
Which retention, upsell, and cross-sell opportunities could generate the most gross profit?
-
Which prospective customers are most likely to have the highest Customer Lifetime Values (CLV), and how can I target them?
-
How can we better tailor our sales and marketing campaigns to our customer segmentation?
-
Do our list prices and discounts accurately align with our customers’ purchase history and cost-to-serve profiles?
-
Given their history, which groups of customers deserve reduced or free freight charges?
Once your analytics teams have posed these questions, they have several tools at their disposal to mine your data for answers. For example, you can conduct a Recency/Frequency/Monetary (RFM) analysis to assess which customers last purchased your service or product, which ones buy the most often, and how much revenue they deliver. Armed with this knowledge, you can convert your analytics into profit with this process:

-
Gather data on sales history, demographics, and other customer identifiers from your CRM.
-
Determine RFM scores by stratifying each category and combining them for a cumulative score.
-
Assign customer segments according to RFM scores or a clustering algorithm.
-
Analyze each segment to understand consumer behavior better and determine how to stimulate each segment.
Once you’ve taken these steps, you can target each customer segment with unique campaigns designed to drive the most revenue or mitigate loss. Examples include providing sales or discounts to demographics that purchase the most, giving special retention offers to customers that appear likely to leave, or selling new products based on customers’ interests.
Driving Business Performance
A comprehensive revenue analytics strategy should go beyond sales and marketing and should seek to identify growth opportunities in every aspect of your business operations. RGM can leverage revenue analytics to add value to your operations in many ways, including:
-
Pricing optimization. Market fluctuations, changes in consumer behavior, and policy changes can all make price optimization a complex endeavor. Advanced analytics can help pricing experts choose between dynamic or competitor-based pricing models so they can get the most for their products and services.
-
Sales and marketing enhancement. Revenue analytics can enhance both sales and marketing operations. For example, teams can use sales data for sales forecasting, setting sales quotas, and minimizing unnecessary expenditures, while marketing data such as CAC and conversion rates allows teams to track their campaigns’ performance.
-
CX improvement. Businesses that fail to create a positive customer experience (CX) won’t remain profitable for long. Over 80% of customers prefer a personalized experience, and revenue analytics allows companies to tailor their interactions with each client to their preferences, resulting in greater business growth.
-
Operational efficiency. The manufacturing industry must often pivot its operations based on external factors, many of which advanced analytics can better predict. Inventory and sales data can be essential to helping executives determine production levels, establish supply chains, and decide which products to build.
-
Reduced downtime. Operational downtime can cost anywhere from thousands to millions of dollars per hour. Businesses that leverage analytics to monitor their equipment’s performance can keep downtime to a minimum so their profits remain at a maximum.
-
Improved worker safety. Employee injuries can be one of the biggest expenses for an organization, costing US employers up to USD 167 billion in 2022. ML tools can identify trends in worker injuries, enabling businesses to take proactive measures to stop them. This creates a safer work environment for employees and saves companies the expense of an injury.
-
Enhanced sustainability. Businesses that prioritize sustainability are more profitable than those that don’t. Not only do consumers place a higher premium on sustainability than in years past — and customers increasingly buy from brands that share their values — but data such as shipping mileage and energy costs can reveal ways to reduce transportation and power consumption, creating a greener world and higher profits.
From optimizing everyday operations to building resilience by anticipating future events, organizations can use revenue analytics to improve their processes across nearly every department. This is why businesses that look beyond pricing to mine out hidden chances for revenue growth are sure to find unexpected operational benefits, while those that don’t may be left behind.
Go Deeper Than Pricing With Revology Revenue Analytics
Revenue growth analytics must dive deeper into your RGM processes than simply looking at pricing. If your revenue growth analytics operations don’t provide actionable insights into your products, people, and processes, they will cause your company to miss out on opportunities for greater profits.
At Revology Analytics, we leverage our comprehensive revenue growth analytics capabilities to help businesses overcome their growth hurdles. We specialize in Profitability & Revenue Management, Sales & Marketing Enablement, and Commercial Analytics Transformations, and our engagement framework lets us create customized strategies tailor-made for each client. Our solutions go beyond technology and analytics alone to establish in-house capabilities in 30 to 120 days.
Our roadmap is designed to enhance sales and marketing efficiency, boost profit margins, and ensure sustainable growth. Contact us today and see how we can strengthen your revenue analytics infrastructure today.

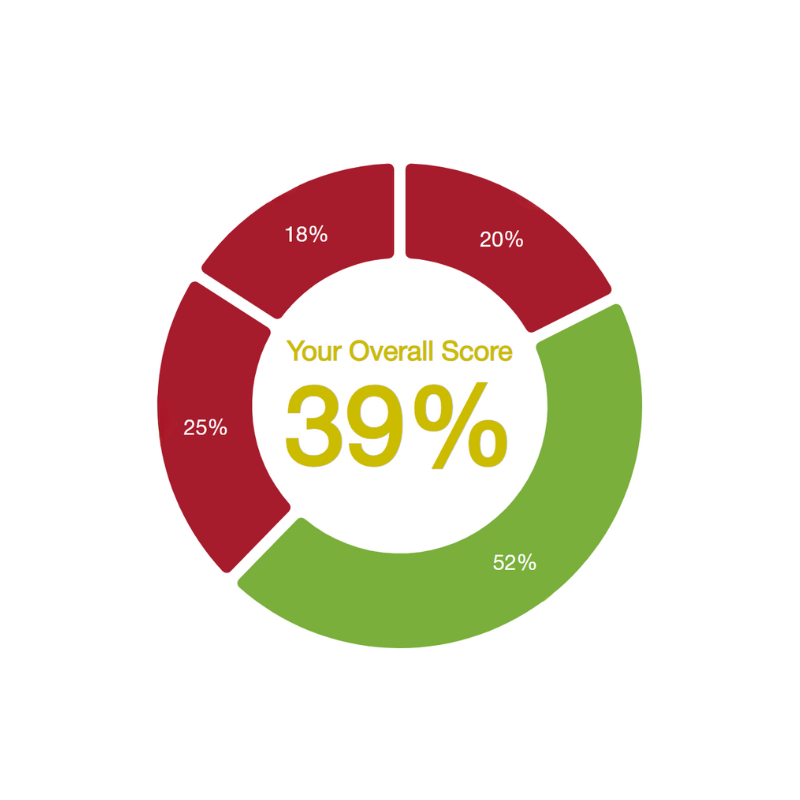
Interested in a free, personalized insight into your Revenue Growth Analytics capabilities?
Take our 5-minute quiz to discover your strengths and areas for improvement, and get ready to elevate your company to industry best-in-class!